 |
|
Original Articles Indian Pediatrics 2000;37: 1051-1059 |
||||||||||||||||||||||||||||||||||||||||||||||||||||||||||||||||||||||||||||||||||||||||||||||||||||||||||||||||||||||||||||||||||||||||||||||||||||||||||||||||||||||||||||||||||||||||||||||||||||||||||||||||||||||||||||||||||||||||||||||||||||||||||||||||||||||||||||||||||||||||||||||||||||||||||||||||||||||||||||||||||||||||||||||||||||||||||||||||||||||||||||||||||||||||||||
|
Growth in the First year in children following iap policy on infant feeding |
||||||||||||||||||||||||||||||||||||||||||||||||||||||||||||||||||||||||||||||||||||||||||||||||||||||||||||||||||||||||||||||||||||||||||||||||||||||||||||||||||||||||||||||||||||||||||||||||||||||||||||||||||||||||||||||||||||||||||||||||||||||||||||||||||||||||||||||||||||||||||||||||||||||||||||||||||||||||||||||||||||||||||||||||||||||||||||||||||||||||||||||||||||||||||||
|
Objective: To study the growth pattern in the first year in children fed according to recommendations of IAP Policy on Infant Feeding. Design: Longitudinal. Setting: Department of Pediatrics, S.C.B. Medical College Hospital, Cuttack, Orissa. Subjects and Methods: 114 infants (68 boys and 46 girls) with birth weight ³ 2500g from upper and middle S-E status were regularly followed up from birth to 12 mo of age and fed according to recommendations of IAP Policy on Infant Feeding. Mean and standard deviations of weight for age (W/A) and length for age (L/A) and mean Z-scores for W/A, L/A and W/L (weight for length) were calculated separately for boys and girls with reference to NCHS-WHO and BFDS data. Observations: Mean Z-scores for W/A with reference to NCHS-WHO data showed a positive trend from birth upto the age of 3-4 mo, subsequently declining upto one year. The Z-scores for L/A showed only a minimal downward trend. The W/L Z-score remained above the baseline value up to 3 mo in boys and 7 mo in girls. When BFDS was taken as the reference, W/A Z scores showed consistent positive increments, from birth in girls and 1 mo in boys. L/A Z scores increased from 3 mo in boys and 11 mo in girls. Using NCHS data as the reference, the percentage of infants below -2SD for weight was 0-7% during first 6 mo and 14% at 12 mo. Ten per cent were below -2SD for length at 12 mo. With BFDS as the reference, the percentage of infants below-2SD for weight was 25% at birth, 5% at 6 mo and 12% at 1 yr. For length, it was 12% at birth and 8% at 1 yr. The increments in weight and length closely followed BFDS upto 12 mo age. Conclusion: The IAP Policy on Infant Feeding results in adequate growth of non low birth weight infants in the first year of life. Key words: Breastfeeding, Infant feeding, Growth. The World Health Organization’s infant feeding recommendations are based on the technical review and discussions undertaken in 1979 in connection with a Joint WHO-UNICEF meeting on Infant and Young Child Feeding(1). These recommendations(2,3) include exclusive breastfeeding from birth to 4 to 6 months of age followed thereafter by addition of nutritionally adequate and safe complementary foods, while continuing breastfeeding beyond one year of age. In order to assess the growth pattern of infants following the above feeding recommendations a WHO Working Group on Infant Growth examined the growth characteristics of a set of infants so fed. The data obtained are referred to as the "12 Month Breast Fed Pooled Data Set (BFDS)"(4). On the basis of analysis of these data a WHO Expert Commitee(5) concluded that the current NCHS-WHO reference for growth(6), which was obtained from a cross-sectional study of infants mostly artificially fed, are inadequate and that new references should be developed which should reflect the current health recommendations. In India, until 1994, there was no unanimously accepted infant feeding policy till the Nutrition Sub-speciality Chapter of the Indian Academy of Pediatrics (IAP) organized a workshop on the subject. The recommenda-tions of the workshop(7) have subsequently been endorsed by the IAP and have been also recognized as the National Guideline on Infant Feeding by the Food and Nutrition Board, Department of Women and Child Develop-ment, Ministry of Human Resources Develop-ment, Government of India. The policy has all the basic features of the WHO recommenda-tions, giving stress on locally available and culturally acceptable complementary foods. The present work was undertaken to study the growth pattern in the first year of life in children fed according to the IAP Policy on Infant Feeding, to compare it with the BFDS babies who were fed according to the WHO recommendations and the current NCHS-WHO reference.
The present longitudinal study on infant growth was undertaken in the Well Baby Clinic of the Department of Pediatrics, SCB Medical College Hospital, Cuttack, Orissa, from January 1996 to September 1998. During this period a total number of 593 infants registered in the immediate postnatal period for immunization and growth monitoring. Low-birth-weight and premature babies, and babies from low socioeconomic status families numbered 188 and were excluded. Babies of middle and upper socioeconomic status with birth weight ³ 2.5 kg were 405 in number. Of these, 249 reported in time, i.e., within ± 3 days of the scheduled date. Out of these only 114 (68 boys and 46 girls) adhered to the IAP feeding recommendations. The rest 135 infants were either early or late weaners and/or were stopped breastfeeing before completion of one year. The selection was done in line with the work done by the WHO Working Group on Infant Growth. The criteria adopted were: (i) delivery at term, (ii) birth weight ³ 2500 g (4% of the babies were large-for-dates), (iii) middle and upper socioeconomic status, (iv) without any significant illness, (v) regular reporting at intervals not greater than two months in the first 6 months of age and not greater than three months between 6-12 months of age, and (vi) adherance to feeding recommendations. The numbers of babies studied at different ages of observation were – 0-114, 1½ mo - 114, 2½ mo - 114, 3½ mo - 114, 4½ mo - 102, 6 mo - 110, 9 mo - 110 and 12 mo - 108. Parents were educated and motivated to follow the feeding schedule advocated by the IAP(7). All babies were exclusively breastfed for a minimum period of 4 months. Those who showed growth faltering at 4-5 months were advised to start complementary feeding by 5th month and those who maintained steady growth were given complementary feeding at 7th month. Breast-feeding was continued till the age of one year. The periods of contact with the mother and babies were at 0, 1.5, 2.5, 3.5, 4.5, 6, 9 and 12 months of age. The initial appointments were decided mainly by the primary immunization schedule. At each point of contact the babies were weighed and their length measured by two health workers and one lady health visitor as the superviser who were trained prior to the start of study as per the anthropometric procedure guidelines laid down by WHO(6). Instruments were standardized prior to measurements. Weight was measured by a beam balance calibrated at intervals of 50 g. Length was measured by a standard infantometer. The mean of three length measurements was recorded. Each time, the babies were also clinically examined by the pediatricians conducting the study.
Age specific means and standard deviations (SD) of weight and length were computed separately for boys and girls. Data so obtained were interpolated to the nearest month using the formula of cubic interpolation. To get smooth curves for each variable, namely, weight and length, the data were modelled with the cubic polynomial model. Mean Z-scores(8) were calculated for weight for age (W/A), length for age (L/A) and weight for length (W/L) with reference to the 12 mo BFDS and the current NCHS-WHO references, all separately for boys and girls, using the EPI-INFO-5 software. Mean growth velocities of the infants at one month intervals were calculated separately for boys and girls and were compared with that of the BFDS. Data on growth velocity with respect of NCHS-WHO reference babies are not available for comparison. Lastly, the age specific percentage of infants below –2SD for weight and length with respect to each of the references were calculated.
The population was relatively homogeneous with respect to average maternal weight, height and age. Mothers were in the age range of 25.4 ± 4.4 years. Their weight and height were 52.7 ± 7.3 kg and 151.7 ± 6.5 cm, respectively. Maternal education was for 8.7 ± 4.2 yrs. Parity was 1.7 ± 1.0. The birth weight of boys and girls were 2.89 ± 0.31 kg and 2.81 ± 0.27 kg, respectively. Weaning foods were introduced at 5 months of age in 76% of infants and at 7th month in the rest 24% of infants. The mean and standard deviations for weight and length of boys and girls at different ages (both observed values and the adjusted values after cubic interpolation) along with the reference values are shown in Tables I-IV. Table I - Weight (kg) for Age of Boys with Reference Values
Table II - Weight (kg) for Age of Girls with Reference Values
Table III - Length (cm) for Age of Boys with Reference Values.
Table IV - Length (cm) for Age of Girls with Reference Values.
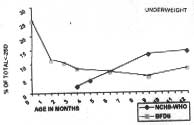
The weight of the babies doubled between 3-4 months and exceeded three times the birth weight at the completion of one year in both the sexes. There was minimal variation or dispersion around the mean. Figures 1 and 2 show the mean Z-scores of boys and girls respectively for W/A, L/A and W/L with reference to both NCHS-WHO reference and the BFDS. In the former, W/A Z-score increased upto the age of 3 months in both boys and girls, declining thereafter to reach –1.4 in boys and –1.0 in girls at 12 months. But when the BFDS was taken as the reference, it showed a positive trend, more marked in girls, being –1.45 in boys and –1.6 in girls at birth, reaching –1.0 in boys and –0.6 in girls at 12 months of age.
So far as L/A is concerned, when compared with NCHS-WHO reference, a continuous decline in Z-score was observed up to 11 months in both the sexes, with a minimal upward trend in the 12th month. The decline was less compared to W/A. In contrast, when compared with the BFDS, the Z-scores showed an almost continuous increase after the initial three months. The increments were less pronounced in boys. The W/L Z-score with reference to BFDS remained lower in comparison to the NCHS-WHO reference upto 8-9 months. Thereafter results were similar. With NCHS-WHO values as the reference, the W/L Z scores increased in the initial 2-3 months, thereafter declining till the 12th month. When BFDS was taken as the reference, the scores for girls variably increased upto the age of 10 months, while in boys it started declining early from the age of two months.
Figure 3 shows the mean velocities of growth (weight and length) of the infants at one month intervals compared with that of the BFDS. The increments in both weight and length followed very closely that of the 12 mo BFDS.
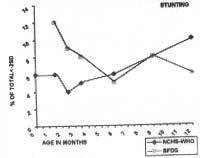
Figure 4 shows the percentage of infants in the study group below –2SD for weight and length. With reference to NCHS-WHO values, 0-7% of infants were below –2SD for weight during first 6 months which increased to 14% at 12 months. When compared with BFDS data it was 25% at birth which decreased to 5% at 6 months and 12% at 1 year. The percentage of infants found stunted with reference to NCHS-WHO data was 6% at 6 months and 10% at 12 months of age. Compared to BFDS data, in contrast, it was 12% at birth declining to 5% at 6 months and 8% at 12 months of age.
The currently used NCHS-WHO reference standard has several limitations(8). The anthropometric indices of the BFDS babies fed according to the WHO recommendations and living under conditions that favor the achievement of genetic growth potentials have shown significant healthy deviations from the presently accepted NCHS-WHO reference. The WHO Expert Committee(8) has concluded that the current NCHS-WHO reference is inade-quate. In this context, the growth pattern of the BFDS babies may be taken as optimum, though at variance with the former. The infants included in this study were both lighter and shorter in comparison to the infants of both the international references, more so with respect to the BFDS. With NCHS-WHO values as the reference, the Z scores of these babies showed variations similar to that of the BFDS. The maternal weight, height and education were less in comparison to the BFDS mothers. Inspite of these deterrents, the infants under study did well in their achievements in terms of theW/A, L/A and W/L Z scores as well as the observation that weight of the infants doubled between 3-4 months and exceeded three times the birth weight at the completion of one year. Growth velocity is a more sensitive index of growth and is less dependent on birth weight. In the present study the velocities of growth of both boys and girls showed a pattern remarkably similar to the BFDS, again lending support to the adequacy of the feeding policy adopted. The percentage of under-weight and stunting also significantly decreased upto 6 months when compared with either of the references, again validating the nutritional adequacy of the feeding promoted to these babies. The weight and length of the infants under study minimal disperesion around the mean at birth because low birth weight babies were excluded and there were only a few large-for-date babies (4%). This pattern was also maintained throughout infancy. This was probably due to less number of sickness episodes as a result of continued breastfeeding. A similar observation emerged in the BFDS babies. In conclusion, the IAP Policy on Infant Feeding results in adequate growth of non low birth weight infants in the first year of life.
We are thankful to the Superintendent, S.C.B. Medical College Hospital, Cuttack, Orissa, for permitting us to carry out this work and publishing it. We also gratefully acknowledge the help rendered by Mr. A.S. Acharya, Regional Medical Research Center, Bhubaneswas, Orissa for statistical analysis. Contributors: ACP and MMD co-ordinated the study design and interpreted the data. RT was responsible for planning and designing the study, training and supervision of data collection, statistical analysis and drafting of the manuscript; she will act as guarantor of the paper. RND collected the data and helped in statistical analysis and drafting the manuscript. Funding: None
| ||||||||||||||||||||||||||||||||||||||||||||||||||||||||||||||||||||||||||||||||||||||||||||||||||||||||||||||||||||||||||||||||||||||||||||||||||||||||||||||||||||||||||||||||||||||||||||||||||||||||||||||||||||||||||||||||||||||||||||||||||||||||||||||||||||||||||||||||||||||||||||||||||||||||||||||||||||||||||||||||||||||||||||||||||||||||||||||||||||||||||||||||||||||||||||
![]()