Christina S. Sit and David L. Yeung
From the Department of Nutritional Sciences, Faculty of Medicine, University of Toronto, Toronto, Ontario, Canada and Heinz Institute of Nutritional Sciences, Pittsburgh, Pennsylvania, U.S.A.
Reprint requests; Dr. David L. Yeung, Heinz Institute of Nutritional Sciences, 60th Floor, 600 Grant Street, Pitts- burgh, Pennsylvania, USA 15219.
Email: dlyeungdl@heinz.ca
Growth of China's infants and children has improved since the introduction of economic reforms. After 1979, secular increases in both weight and length have been observed. In certain industrial centers, infant lengths have caught up to international standards. Overall prevalence of underweight and stunting have declined. However, the health benefits from economic growth have not been shared equally among the Chinese population. There remain large disparities in the standard of health delivered to different sectors of the Chinese population. Rural children and children of minority nationalities continue to suffer from malnutrition and thus lower growth as compared to urban children. Economic reform has also changed the Chinese diet. Infant and child obesity is rising.
Therefore, although economic. reform has stimulated improvements in the growth
of China's children, continued development and attention is needed in disadvantaged areas and populations. Public education is also necessary for China's children to avoid the diet-related diseases frequently seen in the west.
CHINA is geographically the third largest country in the
world(1). With a population of 1.2 billion people (1995), China is the world's most populous country, accounting for about one fifth of the global population(2). Approximately 800 million or 66% of China's population live in rural areas(3). China is a land of diversity in terms of geography, climate, economy, ethnicity, and dialects (although it has only one language).
Since the establishment of the People's Republic of China in 1949, changes in
social conditions and universal health services greatly improved the health
status of the Chinese people. Between 1952 and 1982, life expectancy almost
doubled from 35 years to 68 years. During the same period, infant mortality declined from 250 to 40 deaths per 1000
live births. These achievements may be attributed to China's communist philosophy of more equitable distribution of resources and China's creation of a community oriented universal health care system. Under this system, more than 90% of the population received preventative and basic health care services( 4).
In the late 1970' s, China's political climate underwent drastic changes. Deng Xiaoping introduced drastic reforms that changed both the economic and social environment
of China. The communist philosophy gave way to free enterprise. The universal
health care system was shifted from a free to a fee-for-service system. In an
attempt to control the rapid population growth, the 'One Family One Child' policy was established.
The Central Government regarded the curbing of population growth as essential for economic expansion and improved living standards. By 1970, there were approximately 830 million Chinese. The birth rate of 33.6/ 1000 people was well in excess of the death rate of 7.611000 people. If China's population had continued to increase at the same rate, the country would have had a population of 1.3 billion by 1991 (5) whereas the actual population in 1995 was 1.2 billion.
Under the 'One family, One Child' policy couples in urban areas are limited to one child. In rural areas, if the first-born child is a daughter, a couple may try for a second child after 5 years. Couples from ethnic minority groups can have two children. In border areas, three children per couple are permitted(6). Slogans such as, "With two children you can afford a 14 inch TV, with one child you can afford a 21 inch TV", advertise the benefits of the policy. Compliance is encouraged through rewards and penalties are imposed on those who violate
the policy. Urban couples who comply receive a monthly bonus until the child turns 14, preferential treatment on housing, increased maternity leave, highest priority in education and health care for the child and a supplementary
pension for the parents. Rural couples receive a larger allocation of farming plot. Those that have another child face possible loss of benefits for the first child, fines, job loss and seizure of possessions(4).
What effects have these reforms had on the health of the Chinese population? More importantly, what effects has it had on China's infants and children? Infancy is a period characterized by rapid growth(7). At no other time of a person's life is the growth velocity so great. Failing to grow during this critical period can lead to irreparable consequences that can have lasting effects. Since the future of China rests upon its children, it is
important for society at large to optimize the growth of her infants.
The purpose of this paper is to present an overview on infant and child growth
in China focusing on the period after 1978. It will first discuss the economic
reforms and the resulting changes. Secondly, it will examine the secular trends in growth of Chinese children and compare their growth to international growth standards. Then it will discuss the disparities
in growth among the regions and minorities and the possible health problems that infants and children in China face today.
Economic Reforms
In the late 1970' s reforms were introduced to modernise China and bring it into the global economy. The Central Government felt tJ1at China's long term national security depended upon keeping pace with world wide trends in technology and economic efficiency. Selected areas were designated special economic zones where private ownership and free market forces were permitted. In rural areas, collective
farming was replaced with private farms in which each household farmed its own
leased land and retained a portion of the earnings. In urban centers, promoting
private ownership and private investment encouraged industrial growth(8).
These reforms allowed for improvements in the purchasing power and lives of the
people. Between 1980 and 1993, the per capita disposable income increased 6.1 %
annually after inflation(9). This rate was more than 3 times that experienced in the United States during the same time period. Per capita saving deposits rose from 21.88 yuan in 1978 to 3163 yuan in 1996(10). In 1980, there were only 0.4 television sets per 100 households in rural areas. By 1996, 88.0 households out of 100 had televisions. Urban residents experienced an even greater increase in material
goods. By 1996, 93.5 households out of 100 had color televisions.
Growth of Chinese Infants Secular Changes in Growth
Growth is considered to reflect conditions in society pertaining to changes in
nutrition, hygiene and health(11,12). In China, changes can be used to measure
the impact of economic reforms introduced in 1978(13).
In the past 20 years, the growth and development of children in China has shown significant improvements. Un et at. (14) studied the growth and development of healthy 7 to 18 year old Han (the majority nationality) children (n
=
14688) in "12 Chinese metropolitan
cities (Fig. 1). They reported that secular changes had occurred consistently between the 1950's and 1985. During this period, there was a general increase in both weight and
.
height. In every decade between the 1950' s
and 1985 the average height increased by 2.66 cm for boys and 2.4 cm for girls. The average weight increased by 1.64 kg per decade for boys and 1.14 kg for girls.
 |
|
Fig. 1. Height and weight
increments per decade from 1952 to 1985 (midpoint and range). |
The secular increases observed by Lin
et al.(14) were also observed in the Second National Growth and Development Survey of Children(15). This was a cross sectional survey of urban and rural children (n
=
152874) between 0 to 7 years of age from nine major cities in China. When the
results of this survey were compared to those of the first national child growth
survey conducted in 1975, further secular increases were observed in both weight
and height. This study also reported a decrease in the urban-rural difference in
stature as rural areas exhibited a greater secular increase than urban areas (Table I).
Growth improvements continued into the 1990's. Shen et al.(13) pooled data from the 1987 Nine Province Child Growth Survey, the 1990 Seven Province Nutrition Surveillance Pilot Survey and the 1992 National Child Growth Survey. When the heights of children 24 to 72 months of age were compared, a 2.5 cm height increase in urban children and a 0.5 cm increase in rural children was observed.
There can be no doubt that the improvement in growth is related to the economic reforms introduced in the late 1970's. The authors reported that the secular changes
TABLE I
Change in Urban-Rural Height Differences of 0 to 7
Year Old
Children from 1975 to 1985(15)
|
Urban-Rural |
Males |
Females |
|
Height Differences
(cm) |
1975 |
1985 |
1975 |
1985 |
|
Age group |
|
0 to 3 days |
0.4 |
0.0 |
0.3 |
0.0 |
|
6 to 8 months |
1.3 |
1.1 |
1.3 |
1.0 |
|
12 to 15 months |
1.9 |
1.6 |
1.8 |
1.7 |
|
2.0 to 2.5 years |
2.9 |
2.5 |
3.1 |
2.8 |
|
3.0 to 3.5 years |
3.3 |
2.6 |
3.6 |
3.2 |
|
4.0 to 4.5 years |
2.7 |
3.1 |
4.2 |
3.4 |
|
5.0 to 5.5years |
3.3 |
3.3 |
4.5 |
3.3 |
|
6.0 to 7.0 years |
4.9 |
4.4 |
4.9 |
3.8 |
between 1975 and 1985 were greater than the changes between 1950 and 1975. When the increase in height in China was compared to the changes in height in different parts of the world, China showed greater secular in- creases(l4,16-18).
Comparison to International Reference Standards
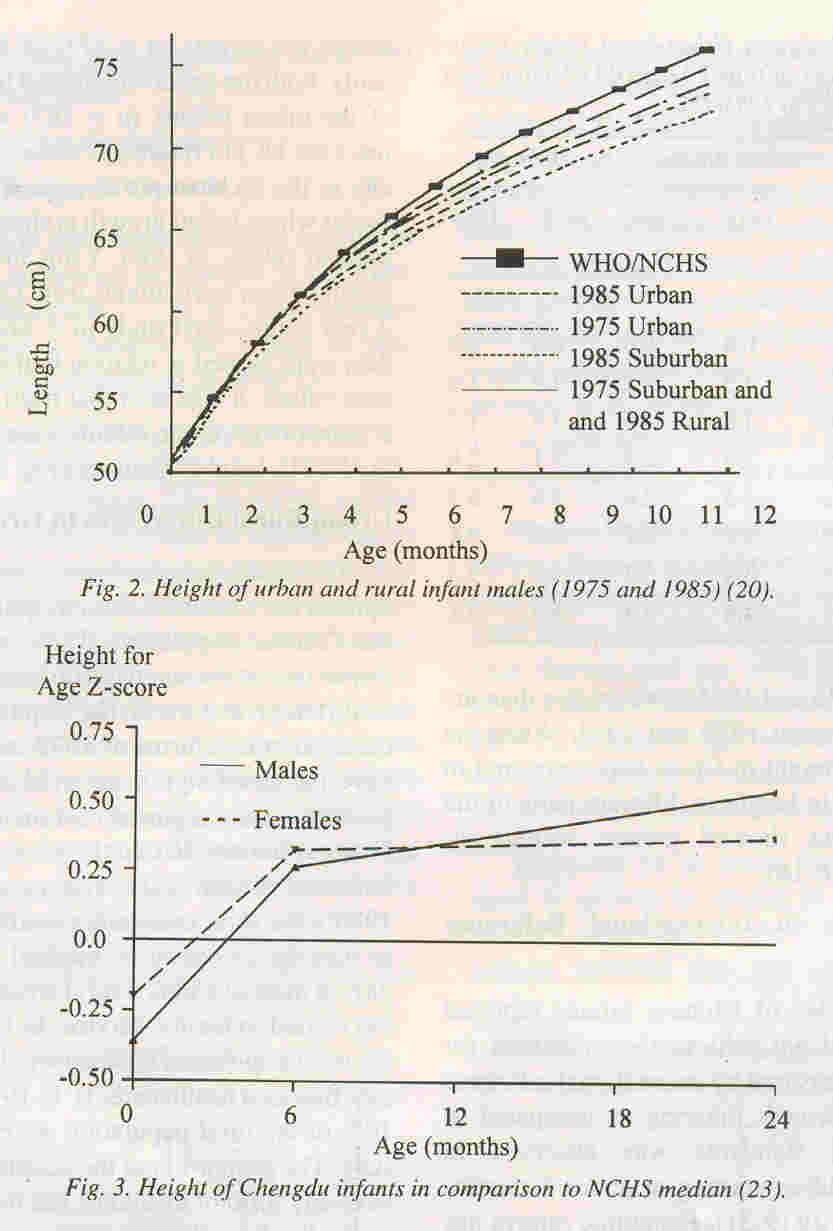
Past studies of Chinese infants reported that they did not achieve their potential for growth as measured by international reference standards. Growth faltering as compared to international standards was observed in Chinese children starting at about 4 months of age (Fig. 2)(l9~21). Economic reform pas changed this situation.
Recent reports showed that infants in certain industrial centres of China were able to exhibit a pattern of growth that met international standards such as the National Center for Health Statistics (NCHS) reference values. Guangzhou, is the capital city of the large southern province of Guangdong. He et al.(22) conducted a cross-sectional study of 4
month old infants (n
=
777) in 1993. In this
study, both the mean weight and height values
of the urban infants (n
=
383) were able to meet the NCHS reference values. Chengdu, a city in the Sichuan province is another urban center where infant growth is similar to NCHS median values. In 1988, Yang and Leung(23) recruited new born infants from Chengdu for a
2 year longitudinal study (n
=
202). When the
data were plotted in relation to the NCHS median values, it was seen that from 6 months to 2 years of age, urban infants were able to meet the NCHS height reference (Fig. 3).
Urban Rural Differences in Growth
The health benefits from economic development have not been shared equitably among the Chinese population. There remain large disparities in the standard of health delivered to different sectors of the population. Since the economic reforms of 1978, medical costs have increased significantly(24,25). Thirteen provinces have reported cost increases of 30- 50% per annum(26). In the past, China had a universal health. care system. During the 1980' s the rural communes were dismantled, as was the co-operative medical system. To- day, in most of China's rural areas, health Care has shifted to fee-for-service. In 1975,85% of the rural population were covered by community
financed health care(3). In 1993, less than 10% of the rural
population were covered by
state. The proportion of the people who do not have any form of insurance has increased dramatically, from 29% in 1985 to 79% in 1993. Of those that are uninsured, 81 % are from rural areas. Urban residents are covered by work related benefits w4ich rural residents do not have. In addition, health spending per capita in urban areas is four times the average in rural areas. All these factors combine to worsen the disparity between rural and urban health.
The differences between rural and urban
health were further exacerbated by the policy shifts of 1985. From 1979 to 1985, the Central Government made agricultural productivity a priority(24). After t985,
the focus of reforms changed to industrial growth. The change in focus
had drastic effects on the economic situation in rural areas. In 1980, the average per capita disposable income of urban residents was 3.1 times that of people in rural areas. By
1985, the ratio decreased to 2.3. However in 1993, after the 1985 shift in political focus, the ratio had increased to 3.3 times(27).
The disappearance of universal healthcare and the policy shifts caused a slower growth pattern in rural infants and children as compared to urban areas. Shen et al.(3) studied the effect of economic reforms on child growth. They examined the trends in height of children
2 to 5 years of age by pooling the data from five large
cross-sectional surveys con- ducted between 1975 and 1992. Between
1975 and 1992, a general secular increase in height was observed. As
mentioned earlier, between 1975 and 1985, the height difference
between children in urban and rural narrowed as rural children
experienced a greater secular increase. However, between 1987 and
1992, the differences between the groups increased. The net increase
in the height of rural children was only one fifth those of urban
children. The situation was further examined on a provincial level by Chang et al. who pooled the data from the 1987 Nine Province Child Growth Survey and the 1992 Child Growth Survey in 26 provinces and autonomous regions and 3 municipalities(28). On a provincial level, the researchers found that in the 9 provinces, overall height in the period between 1987 and 1992 did not increase. In fact, in 4 provinces, the mean height actually declined.
The urban-rural differences in health are much more. serious than the
height differences. Rural children have higher rates of nutritional anemias. Studies conducted in the 1980' s indicate that in some rural areas, 80% of children under 7 suffered from iron deficiency anemia(29). Around 20% of 7 year olds suffer from vitamin D deficiency rickets. Rates in the rural north were as high as 50%. In Beijing, it was believed that as many as 40% of young children suffered from rickets(30). Thus rural children suffer from much higher rates of malnutrition.
The prevalence rates of underweight, stunting and wasting have been
used as markers for malnutrition. Underweight has been defined as
having a weight for age Z-score of less than 2 standard deviations
below the international reference as represented by the NCHS reference median. Similarly, stunting and wasting have been defined as having height for age and weight for height Z-scores of less than 2 standard deviations below the NCHS median values.
Chang et al.(28) analyzed the data of children under 5 years of age (n
=
179705) taken from the 1992 cross sectional Child Growth Survey of China. They found that the prevalences of all three markers of malnutrition were higher in rural areas. In the 26 provinces, autonomous areas and 3 municipalities surveyed, the prevalence of underweight in the urban areas was much lower than that found in rural areas (Table II). The highest rates of underweight were seen in 1 year old infants and 7.1 % and 23.1 % of urban and rural 1 year,
old infants respectively, were found to be underweight. Between 1986 and 1989, Chang et al.(31) surveyed nearly 10,000 pre-school children in 19 poor rural areas in 7 provinces. They revealed that the prevalence rate of underweight in these poor areas was even higher. Between 1985 and 1989, these areas reported prevalence rates of between 30 to 35% among one year old infants.
TABLE II
Prevalence (%) of Malnurtrition Among 1 year Old Urban and Rural Chhildren
| |
Underweight |
Stunted |
Wasted |
| |
Males |
|
Females |
Males |
|
Females |
Males |
|
Females |
| Urban (28) |
8.13 |
|
5.97 |
14.40 |
|
11.56 |
4.14 |
|
3.42 |
| Rural (28) |
23.96 |
|
22.11 |
43.99 |
|
42.56 |
6.76 |
|
6.05 |
| Poor Rural (31) |
|
30-35 |
|
|
40-50 |
|
|
< 10 |
|
There was also a substantial difference in prevalence rates of stunting between urban and rural areas. Among children under 5 years of age, the prevalence of stunting was 11.4% and 11.5% for urban males and females, respectively(28). Among rural children, the prevalence was 39.3% and 40.5% for males and females, respectively. Again children from poor rural areas faced a more severe situation, where in 1989, the prevalence of stunting among children under 6 was 41.8%(31).
In comparison to the rates of both under- weight and stunting, the prevalence of wasting in China was comparatively low. Urban children again faired better than their rural counterparts. The prevalence of wasting in urban children in the 1992 survey was 3.0% and among rural children 5.0%(28).
Chang et al.(28) were also able to compare changes in the prevalence of
stunting between 1987 and 1992 by matching the data from the 1992
Child Growth Survey with the 1987 Nine Province Child Growth Survey.
Between 1987 and 1992 the prevalence of under- weight, stunting and wasting in urban children decreased. However, rural children did not enjoy the same improvements in their health status. Generally, there was a decline in the prevalence of underweight. Unfortunately in recent years, the prevalence of stunting and wasting in rural children has not improved and in some provinces has even increased.
Geographical Differences in Malnutrition
The distribution of malnutrition across the country varies widely; the highest prevalence of underweight in some regions was 10 times that of others(28). In general, it seems that northeast and central north China including' Shanghai have the lowest prevalence rates. Economic factors certainly playa contributing role to malnutrition. As mentioned
above, the poorer rural regions have higher prevalence rates of malnutrition. However, economic development is not necessarily a buffer against malnutrition. Guangdong province has the fifth highest per capita income in China(32) whereas it has a high prevalence of underweight, stunting and wasting. The causes of malnutrition in China are multifaceted. Other contributing factors include food supply, pre-natal and post natal care, access and availability of health care, feeding practices, sanitation and government policies.
Differences Between Han Chinese and Minority Nationalities
There are disparitie3 in health status within China's cultural mosaic.
There are 56 cultural groups in China and Han in the majority, ac-
counting for 93.7% of the population. Fifty- five minority
nationalities comprise the remaining 6.3%(33). Traditionally, there
have been great inequalities between the Han majority and the
minorities with the Him being substantially better off. Most
minorities live in the poorer western part of China. Economic growth
since the reforms of 1979 has been higher in the mainly Han eastern
China. The higher level of poverty among the minorities has resulted
in a lower health status as compared to the Han(34).
Yunanis one of the border provinces in the south. Racial minorities constitute one third of the province's population. and account for 13.45% of all minority groups in China. A survey in 1990 of 18 minority counties in Yunan of children aged 0 to 4 years of age revealed a picture of poverty. Socioeconomic conditions in the minority counties were low. The infant mortality rate was 73.13 deaths per 1000 live births and 64.9% of fatalities under 5 had never visited any medical facility. Similarly, 83.6% of deaths under 5 years of age occurred at home or en route to a medical centre(35).
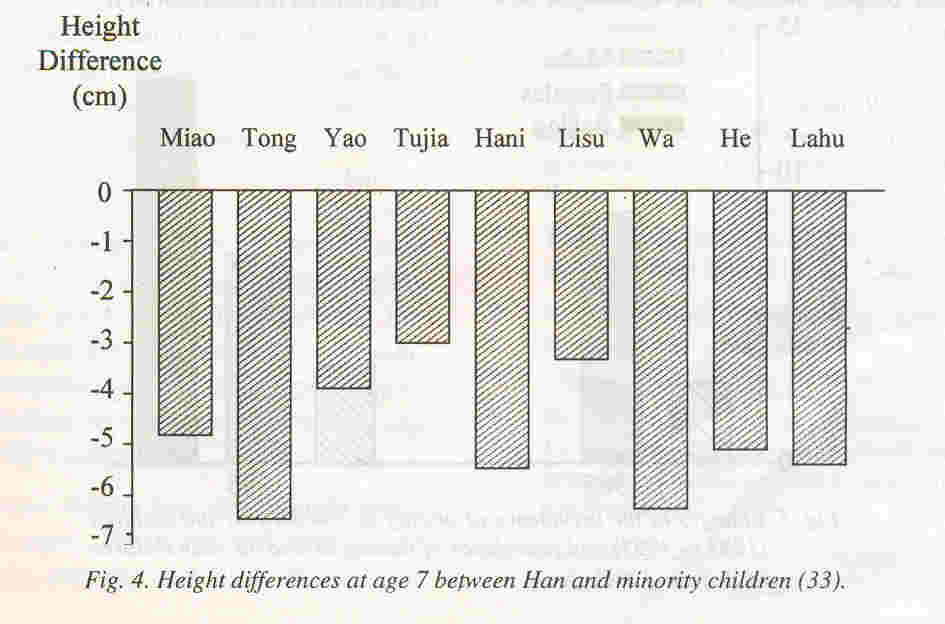
A survey of 7 to 18 year old children (n
=
480,239) in 1985 of29 administrative regions in China compared the growth of 27 minority nationalities to that of
Han children(33). At all ages, the minority children weighed less and were shorter than the Han children (Fig. 4). Most of the height differences occurred before puberty. Minority males were on average 4.77 cm shorter and minority females were on average 4.83 cm shorter at age 7. These height differences at age 7 accounted for 67.7% and 75.9% of the total difference between Han and minority males and females respectively at age 18.
 |
|
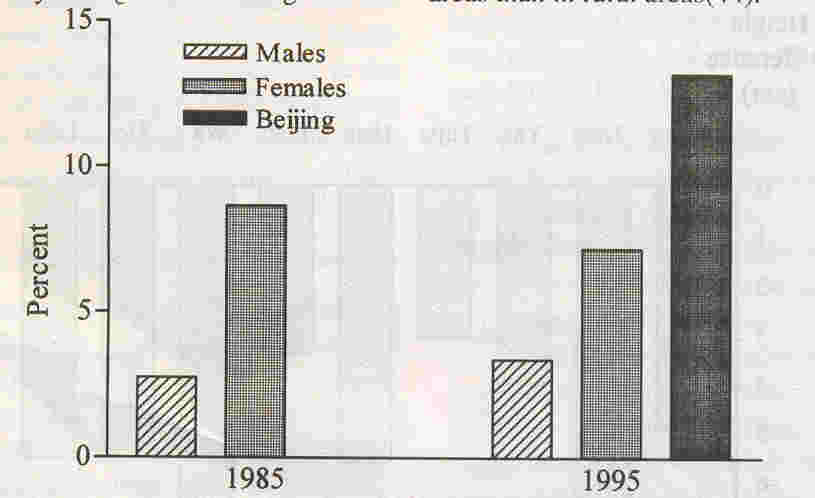
Fig. 5. Changes in the
prevalence of obesity in 7 to 18 year old children (1985 to
1995) and prevalence of obesity in 8 to 18 year children in
Beijing (1995) |
Changes in Feeding Practices
Economic reform has also changed the traditional feeding patterns of Chinese infants. . Breastfeeding 30 to 40 years ago was universal. However, China is experiencing a rapid decline in the prevalence of breast- feeding. According to a study conducted between 1 983 and 1986, the average breast- feeding rate among infants under six months of age was 48.8% in urban areas and 75.1 % in rural areas(36). In certain large urban centres, the rate is much below the national average. In
Beijing, a survey done in 1982 revealed that only 22% of the infants in the city and 61.5% in the surrounding areas were breastfed. In contrast, in the 1950' s, Beijing had a breastfeeding rate of 81 % in the city and 95% in the surrounding areas. Within 30 years, the incidence of breastfeeding in Beijing had dropped a dramatic 40%. This decline continued into the 1990's. In Chengdu
the exclusive breastfeeding rate for infants under six months of age in 1985 was
16.3%(37). An investigation in 1993 showed that the exclusive breastfeeding rate was only 11.3%(38). The decline in breastfeeding rate has been accompanied by an increase in bottle feeding and mixed breast and bottle feeding.
The change from universal breastfeeding to bottle feeding has adversely affected the growth of Chinese infants. Formula feeding in the city of Guangzhou, has been associated with poorer growth of Guangzhou infants at 4 months of age(22). Prentice, in a study of extended breastfeeding among rural infants in China, showed that infants who had been breastfed for less than twelve months had significantly lower mean height and weight outcomes than those who had been breastfed
for longer periods(39). These findings are contrary to those found in Western
countries. In industrialized countries, breastfed infants are usually leaner
than formula fed in- fants(40). The differences in growth infants who were
breastfed in China and in western countries may be related to economic reasons.
Infant formula is expensive and this might have caused mothers to over dilute
the formula leading to inadequate energy intake.
Diet and Disease
China's new affluence has changed the diets of the Chinese population. Between 1990 and 1995, the consumption of meat, poultry, fish, shrimp, milk and eggs have in- creased by 10% to 20%(4). Milk, eggs, bread and ham have replaced porridge, steamed bread and salted vegetables at the breakfast table. Processed foods in urban diets have increased as much as 50% in some families. A study in Shan revealed that since 1950, the energy and fat intake of adults have in- creased(42). Today, families have access to a much wider variety of foods than ever before.
These dietary changes have brought new
health problems to China. China is now facing high incidences of cancer, obesity and heart disease; diseases more prevalent in affluent countries. Before 1950, the 3 leading diseases causing death were measles, tuberculosis and senility( 42). In 1985, they were malignant tumors, cerebrovascular disease and ischemic heart disease.
Popkin reported that among the urban adult population in China, obesity was on the rise(43). In his report, overweight was defined as having a Body Mass Index (BMI) of ~25. Between 1989 and 1991, the prevalence of overweight among male adults had increased by 4%. In 1989,9.8% urban adult males were found to be overweight. By 1991, the proportion had increased to 13.8%.
Obesity in children followed a similar trend (Fig. 5). From 1985 to 1995, the prevalence of overweight and obesity increased from 2.75% to 8.65% in 7 to 18 year old boys and from 3.38% to 7.18% in girls. A survey of
8 to 17 year old children (n
=
1269) conducted
in 1995 in Beijing showed that the prevalence of obesity was 13.2%. In general, the prevalence of childhood obesity is higher in urban areas than in rural areas(44).
Childhood obesity in China may in part, be attributed to China's 'One Family,
One Child' policy. Children born under this policy have been named China's
'little emperors'. In urban areas, they often have 2 working parents and 4
grandparents to dote on them. A 1992 survey indicated that over 60% total
monthly expenditures were spent on these 'little emperors' (45). Overindulging
the material comforts, including food, of these single children had lead to both over nutrition and more sedentary lifestyles.
Conclusions
Economic reform has generally, increased the growth of China's infants and
children. After 1979, secular increases in both weight and height have been
observed. In certain industrial centers, the length of the infants has caught up
to international reference standards. Overall prevalence of underweight and
stunting have declined.
However, the health benefits from economic growth have not been shared equally among the Chinese population. There remain large disparities in the standard of health delivered to different sectors of the Chinese population. Rural children and children of minority nationalities continue to suffer from malnutrition and thus lower growth as com- pared to urban children. China has taken steps to improve the health of its rural populations. By the year 2010, the government hopes to reintroduce collectively funded medical care to cover 80% of the rural population(46). While these plans would be a definite improvement
over the present situation, the Chinese government must still take steps to
equalize the situation between the Han majority and the minority nationalities.
Economic reform has also brought about dietary changes. These changes have led to increases in diseases that have dietary correlates. Obesity is on the rise. Infant and child obesity is rising. Overweight and obesity in childhood is one of the major risk factors for the development of obesity in adulthood. Go et at.
found that for 18 year olds with a BMI exceeding the 60th percentile, the odds
of being overweight at 35 were 34% for males and 37% for females(47). Dietary habits developed in childhood have the risk of being extended into adulthood. Nevertheless, it is possible for China to avoid the problems of obesity prevalent in the west through effective public health nutrition and lifestyle programs. In summary, economic reform has stimulated improvements in the growth of China's children. China is facing a double burden in terms of under nutrition and over nutrition. Through continued development and attention
to disadvantaged areas, it might be possible for China's children to enjoy a level of growth similar to children in industrialized countries. Public health education, is also needed for China to avoid the diet related diseases frequently seen in the west.
|
1.
Rosenberg M. World's largest countries. http://www.miningvo.comlmsub24.htm: General Net Inc, 1998.
2.
Population Reference Bureau. World population
data
sheet. http://www.geographyminingco.comlmsub24.htm. Population Reference Bureau, 1998.
3.
Tomlinson R. Health care in China is highly in- equitable. BMJ 1997; 315: 835.
4.
Hesketh T, Zhu WX. The one child family policy: The good, the bad, and the ugly [see comments]. BMJ 1997; 31: 1685-1687.
5.
Heinemann R. China's population reaches 1.2 billion. http://www.reedbooks.com.au/ heinemannlhot/chinapop.html. Reed Interactive World Guide, 1995.
6.
Payne D. China moves to change policy on child quotas. BMJ 1998; 316: 955.
7.
Whitney E, Rolfes S. Life cycle nutrition: Pregnancy, lactation and infancy. In:
Under- standing Nutrition. Minneapolis, West Publishing Company, 1993, pp 477-512.
8.
Gray 1. China since the death of Mao. In: Rebellions and Revolutions: China from the 1800's tot he 1980's Ed. Roberts JM. New York, Oxford University Press, 1990; pp 380- 411.
9.
Li J. The Chinese Economy Towards the 21st Century. Beijing Enterprise Management Press 1995.
10.
State Statistical Bureau People's Republic of China. China Statistical Yearbook, 1997. Beijing China Statistical Publishing House, 1997.
11.
Tanner J. Growth as a mirror of conditions in society: Secular trends and class distinctions. In: Human Growth - A Multidisciplinary Re- view. Ed. Demirjan A. London and
Philadelphia, Taylor and Francis, 1986; pp 3-34.
12.
Van Wiereingen Je. Secular growth changes. In: Eds. Falkner F, Tanner 1M. Human Growth New York, Plenum Press, 1986; pp 307-331.
13.
Shen T, Habicht JP, Chang Y. Effect of economic reforms on child growth in urban and rural areas of China [see comments]. N Engl J Med 1996; 335: 400-406.
14.
Lin WS, Chen AC, Su JZ, Xiao JW, Ye GS. Secular change in the growth and development of Han children in China. Ann Hum Bioi 1992; 19: 249-265.
15.
Zhang X, Huang Z. The second national growth and development survey of children in China, 1985; Children 0 to 7 years. Ann Human Bioi 1988; 15: 289-305.
16.
Cameron N. The growth of London school children 1904-1966: An analysis of secular trend and intra country variation. Ann Hum Bioi 1978; 9: 505-525.
17.
Ljung BO, Bergsten-Brucefors A, Lindgren G. The secular trend in physical growth in Sweden. Ann Hum Bioi 1974; 1: 245-256.
18.
Takahashi E. Growth and environmental factors in Japan. Hum Bioi 1966; 38: 112-130.
19.
Yang X, Zheng D. Growth patterns of Chinese infants in Chengdu. In: 4th
International Symposium on Maternal and Infant Nutrition. Chengdu, 1989; pp E117-E126.
20.
Liu D. Feeding patterns and nutritional status of infants in Mainland China. In: 4th International Symposium on Maternal and Infant Nutrition, Chengdu, 1989; pp EI04-EI16.
21.
Rao A, Zhang X. Study of growth indices of children in 9 cities. Acta Nutrimenta Sinica 1989; 11: 197-204.
22.
He M, Mei J, Ma J, Chen Q, Jiang Z, Anderson GH. Growth and feeding pattern of Guangdong infants. Acta Nutrimenta Sinica 1996; 18: 332- 336.
23.
Yang M, Leung SS. A comparison of the growth patterns of Chinese infants in Chengdu and Hong Kong: 0-2 years. J Paediatr Child Health 1994; 30: 336-340.
24.
Hsiao WC, Liu Y. Economic reform and health-lessons form China. N Engl J Med 1996; 335: 430-432.
25.
Shi L. Health care in China: A rural-urban comparison after the socioeconomic reforms. Bull WHO 1993; 71: 723-736.
26.
Yuan Y. An important step in the modernization of medical and health work. Jian Kang Bao (Health Gazette) August 7,1990.
27.
Study Group on National Income Survey CNBoS. Income difference between urban and rural residents. Econ Res 1994; 12: 34-45.
28.
Chang Y, Xian ZD, He W, Chang SY, Ma HJ, Chen CM. Child malnutrition in China-Present status and changing trend. Biomed Environ Sci 1996; 9: 164-180.
29.
Hesketh T, Zhu WX. Maternal and child health in China. BMJ 1997; 314: 1898-1900.
30.
Yeung DL. Nutrition of infants and young children in China. Nutr Res 1988; 8: 105-117.
31.
Chang Y, Zhai F, Li W, Ge K; Jin 0, de Onis M. Nutritional status of preschool children in poor rural areas of China. Bull WHO 1994; 72: 105-112.
32.
Children's malnutrition and economic growth.
Beijing Review 1998; 41: 23.
33.
Lin WS, Shao LX. The status of physical growth in Chinese children. ColI Antropol 1997; 21: 101-108.
34.
Mackerras C. China's Minority Cultures: Identities and Integration Since 1912. New York, Longman St. Martin's Press 1994.
35. Qian J. The pattern of under 5 mortality in the racial minorities of Yunan province and analysis of influential factors. In: 8th International Symposium on Maternal and Infant Nutrition Kunming, 1993; pp EI2-EI6.
36.
National Coordination Working Group in Breast-feeding Surveillance. A National Breastfeeding Survey. Chung Hua I Hsueh Tsa Chih 1987;67: 433-437. .
37.
Chengdu Coordination Working Group of Breast-Feeding Survey. 0-6 months infant feeding practices in Chengdu. 1 Sichuan Med 1985; 6: 259-262.
38.
Guldan GS;Zhang M, Zeng G, Hong 1, Yang Y. Breastfeeding practices in Chengdu, Sichuan, China. 1 Hum Lact 1995; 11: 11-15.
39.
Prentice A. Extended breast-feeding and growth in rural China. Nutr Rev 1994; 52: 144- 146.
40.
Dewey KG, Heinig Ml, Nommsen LA, Peerson JM, Lonnerdal B.
Breastfed infants are leaner than formulated infants at 1 year of age:
the DARLING study. Am 1 Clin Nutr 1993; 57:
. 140-145.
41.
Changes on Chinese dining tables. Beijing Review 1998; 39: 38.
42.
Zhao F, Guo 1, Chen H. Studies on the relationship between changes in dietary patterns and health status. Asia Pacific 1 Clin Nutr 1995; 4: 294-297.
43.
Popkin BM, Paeratakul S, Ge K, Zhai F. Body weight patterns among the Chinese: Results from the 1989 and 1991 China Health and Nutrition Surveys. Am 1 Public Health 1995; 85: 690-694.
44.
Ye G, Feng N. The status and preventative strategy of childhood obesity in China. In: 11th International Symposium on Maternal and Infant Nutrition, Beijing, 1996; pp E131-E135.
45. Li C. China: The Consumer Revolution. New York, 10hn Wiley and Sons 1998.
46.
Tomlinson R. China to expand rural healthcare system. BMI 1998; 317: 431.
47.
Guo SS, Roche AF, Chumlea WC, Gardner ID, Siervogel RM. The predictive value of childhood body mass index values for overweight at age 35 years. Am 1 Clin Nutr 1994; 59: 810- 819.
|