|
|
|
Indian Pediatr 2016;53:
S7-S13 |
 |
The Estimated Health and Economic Benefits of
Three Decades of Polio Elimination Efforts in India
|
|
Arindam Nandi,
Devra M Barter, *Shankar
Prinja and #T
Jacob John
From The Center for Disease Dynamics, Economics and
Policy, Washington, USA; *School of Public Health, Chandigarh, India;
and #Retired Professor of Clinical Virology, Christian
Medical College, Vellore, TN, India.
Correspondence to: Dr Arindam Nandi, The Center for
Disease Dynamics, Economics and Policy, Washington, USA.
Email: [email protected]
Received: December 28, 2015;
Initial review: February 08, 2016;
Accepted: May 27, 2016.
|
Objective: In March 2014, India,
the country with historically the highest burden of polio, was declared
polio free, with no reported cases since January 2011. We estimate the
health and economic benefits of polio elimination in India with the oral
polio vaccine (OPV) during 1982-2012.
Methods: Based on a pre-vaccine
incidence rate, we estimate the counterfactual burden of polio in the
hypothetical absence of the national polio elimination program in India.
We attribute differences in outcomes between the actual (adjusted for
under-reporting) and hypothetical counterfactual scenarios in our model
to the national polio program. We measure health benefits as averted
polio incidence, deaths, and disability adjusted life years (DALYs). We
consider two methods to measure economic benefits: the value of
statistical life approach, and equating one DALY to the Gross National
Income (GNI) per capita.
Results: We estimate that the
National Program against Polio averted 3.94 million (95% confidence
interval [CI]: 3.89–3.99 million) paralytic polio cases, 393,918 polio
deaths (95% CI: 388,897– 398,939), and 1.48 billion DALYs (95% CI:
1.46–1.50 billion). We also estimate that the program contributed to a
$1.71 trillion (INR 76.91 trillion) gain (95% CI: $1.69–$1.73 trillion
[INR 75.93–77.89 trillion]) in economic productivity between 1982 and
2012 in our base case analysis. Using the GNI and DALY method, the
economic gain from the program is estimated to be $1.11 trillion (INR
50.13 trillion) (95% CI: $1.10–$1.13 trillion [INR 49.50–50.76
trillion]) over the same period.
Conclusion: India accrued large
health and economic benefits from investing in polio elimination
efforts. Other programs to control/eliminate more vaccine-preventable
diseases are likely to contribute to large health and economic benefits
in India.
Keywords: Deaths averted, Disability-adjusted
life years, Economic benefits, Polio elimination, value of statistical
life.
|
|
Since the launch
of the Global Polio Eradication Initiative (GPEI) in 1988, the annual
number of polio cases worldwide has decreased 99.99% from an estimated
350,000 cases in more than 125 countries to 74 cases in 2015 in two
remaining endemic countries, Pakistan and Afghanistan [1,2]. Until 2009,
India reported the majority of global polio cases, but India was
officially declared polio free in 2014 [3].
The marked decrease in polio incidence in India was
due to the Indian government’s commitment to polio eradication, with
close to $2 billion (INR 92 billion) apportioned to the polio
eradication initiative [4]. During 1978-1992, India used the oral polio
vaccine (OPV) through the Expanded Programme of Immunization (EPI, later
called Universal Immunization Programme). In 1997, the National Polio
Surveillance Project (NPSP) was launched in collaboration with the World
Health Organization (WHO), aiming to detect all cases and to vaccinate
99% of children in India, even in the remotest areas [5,6]. Together
with large-scale supplemental immunization activities called the Pulse
Polio Programme (PPP), the NPSP has administered an estimated 12.1
billion doses of the OPV, and 172 million children were vaccinated each
National Immunization Day under PPP [7,8].
Several prior studies have provided important
economic rationale for polio eradication efforts [9-15], but some of
them evaluated only prevented treatment costs and did not include
productivity losses, and others assumed that vaccination would cease by
2005 or 2010. Some studies assessed the benefits of the GPEI as a whole
or evaluated the benefits only for certain countries. No study to date
has robustly estimated the economic benefits of polio elimination in
India, a country with historically the highest burden of the disease.
Quantifying the health and economic benefits of polio elimination in
India will enable better understanding of the benefits of polio
elimination in the two remaining endemic countries, and it will allow
for researchers and policy makers to recognize the potential benefits of
eliminating other vaccine-preventable diseases in India and other low-
and middle-income countries through large-scale immunization programs.
Methods
Disease Burden
As OPV was introduced in the EPI in India in a
staggered manner during 1978-1982 [6], we used 1982 as the starting year
for our analysis, continuing through 2012, the first full year without
any documented polio case.
In order to estimate the benefits of polio
elimination in India, we computed the differences in terms of annual
incident cases of paralytic polio, polio-related deaths, and
disability-adjusted life years (DALYs) [16-18] under two scenarios:
under the National Polio Program, and under a counterfactual scenario,
i.e. in the hypothetical absence of the National Polio Program
during 1982-2012. The differences between the two scenarios were then
attributed to the benefits of the polio elimination program. To estimate
the disease burden, we used disease parameters from Joseph, et al.
(2003) [19] and John (2003) [20], as presented in Table I.
TABLE I Model Input Parameters
|
Parameter type |
Value |
Source |
|
Disease parameters |
|
Annual incidence rate of paralytic polio |
15.0 per 100,000 people |
Joseph et al. (2003) [19] |
|
Case fatality rate |
0.10 |
Khan and Ehreth (2003)[14] |
|
Years lived with disability |
Life expectancy at birth – 3 years |
Assumed |
|
Disability weight |
0.369 |
World Health Organization |
|
Population parameters |
|
Estimated annual population of India |
731 million in 1982 to 1.2 billion in 2012 |
World Bank [22] |
|
Life expectancy at birth |
55.8 years in 1982 to 66.2 years in 2012 |
World Bank [22] |
|
Economic parameters |
|
Gross Domestic Product (GDP) per capita (2005 US$) |
$305.9 in 1982 to $1,123.2 in 2012 |
World Bank [22] |
|
Gross National Income (GNI) per capita, (2005 US$) |
$305.4 in 1982 to $1,090.0 in 2012 |
World Bank [22] |
|
The parameters in the table pertain to the base case
scenario. We also conduct a 500 simulation sensitivity analysis
by varying the incidence rate of polio from 11.25-18.75 per
100,000 people [19]. Following Khan and Ehreth [14], we assume
that all polio cases occur within the first three years of life.
|
Estimating the polio incidence under the National
Polio Program scenario during our study period was challenging because
data on the number of polio cases during the first decade of the
national program suffered from underreporting, as there was no
surveillance. During the 1970s and 1980s, the number of new cases of
paralytic polio was estimated to be between 200,000 – 400,000 per year
[6,21]. The sentinel surveillance system of the Government of India
which collected annual incidence data from only a few hospitals might
have missed as much as 90% of these cases in the early years [6]. We
assume that the NPSP program (along with the PPP), which began active
surveillance activities in 1997, took three years to reach optimal level
of surveillance sensitivity. Therefore, reported polio incidence data
during 2000-2012 are considered to be representative of the true number
of cases in our study. For the period 1982-1999, however, we adjusted
the number of reported polio cases for underestimation in the following
way:
First, we projected the number of new paralytic polio
cases in 1981 using the incidence rate of 15.0 per 100,000 people and
the total population size based on Joseph, et al. [19]. Next, we
extrapolated the time trend of reported annual incidence from John [20]
in order to estimate the change in year-to-year incidence during
1982-1999. For example, the number of reported new polio cases in 1981
was 38,090, which decreased to 26,297 (30.1% reduction) in 1982, and
then to 24,663 (another 6.2% reduction) in 1983, and so on [20].
We multiplied the annual population size in India
[22] with polio incidence to estimate 107,266 new paralytic polio cases
in 1981. Then, following the time trend mentioned above, the number of
new cases reduced to 74,055 (30.1% reduction) in 1982, then 69,454
(further 6.2% reduction) in 1983, and so on. Thus, our estimated number
of new cases of paralytic polio, and the associated mortality during
1982-1999 followed a trend similar to the reported number of cases, but
at much higher levels.
To estimate the burden of paralytic polio under the
counterfactual scenario, we assumed that annual incidence was constant
at 15.0 per 100,000 people during 1982-2012. For simplicity, we ignored
disease transmission dynamics and estimated the annual number of
paralytic polio cases by multiplying the estimated annual population
size (obtained from the World Bank [22]) with the constant rate of
incidence.
After calculating the number of incident cases for
each of the two scenarios, we calculated annual DALYs following the WHO
guidelines [16–18] as below:
daly = yll + yld
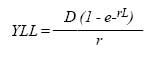
Where YLL denotes years of life lost and YLD denotes
years of life lived with disability due to paralytic polio. YLL is
calculated as below:
Where D is the number of polio deaths. L
is the life expectancy at birth, and r is the discount rate
(5%). D is calculated as:
D = CFR *P
Where CFR is the case fatality rate of polio
(proportion of paralytic cases that are fatal—assumed to be 10% [14])
and P is the number of new paralytic polio cases.
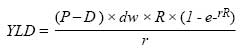
YLD is calculated as:
where dw is the disability weight of polio,
equal to 0.369 [11], R denotes the duration of disability, equal
to life expectancy at birth minus three years since most polio cases
occur during early childhood [14,22] and r denotes the discount
rate, equal to 5%.
Economic Burden
In order to calculate the economic costs of polio, we
used the value of statistical life (VSL) measure. VSL is based on the
concept of human capital, assuming that the value of a year of life can
be measured in terms of annual economic productivity [23,24]. Following
Stenberg and colleagues [25], we assumed that the value of one
statistical life-year (VSLY) was 1.5 times the per capita gross domestic
product (GDP) of India in our base case model. We obtained annual per
capita GDP data for 1982-2012 from the World Bank [22] and calculated
the VSLY for year t as:
VSLY t
= 1.5 × PCGDPt
where PCGDP t
is the per capita GDP for the t-th year. For
simplicity, we considered a fixed VSLY over the life course of an
individual, which is the estimated economic value of one DALY. The total
estimated annual economic cost of polio is the sum of all VSLYs lost in
one year.
We also used an alternative method for estimating the
economic benefits of the polio program. Under this approach, each DALY
adverted was valued at the gross national income (GNI) per capita in
India [22] in a given year [24,25]. The costs saved due to polio
elimination are first calculated in terms of constant 2005 US dollars.
All estimates in this study are then reported in 2011 US dollars after
adjusting for inflation and also converted to 2011 INR (assuming US$
1=INR 45).
The difference in the aggregate number of incident
polio cases, DALYs lost and deaths due to polio during years 1982-2012
between the counterfactual and actual burden scenarios is the total
health gain from the National Polio Program in India. Similarly, the
difference in the aggregate VSLYs lost to polio between the two
scenarios is the total economic gain from the program. We report the
total health and economic gains from the base case model with a
pre-vaccine paralytic polio incidence rate of 15.0 per 100,000 people as
our main result. We also conducted sensitivity analyses by running the
model with 500 randomly selected incidence rates in the range
11.25–18.75 (i.e. 75%–125% of the initial value) per 100,000 people
[19]. The health and economic gains by the National Polio Program
estimated from these additional simulations were then used to construct
95% confidence intervals for the base case results.
Results
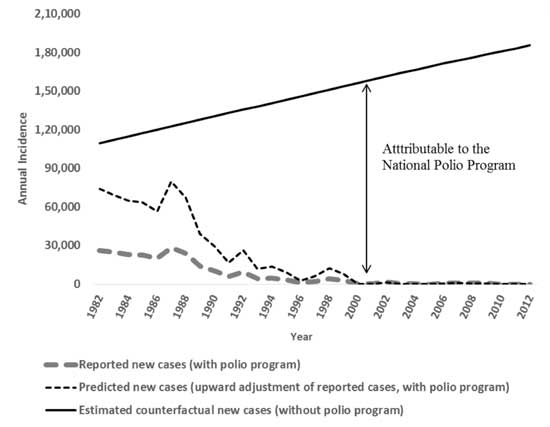
Fig. 1 presents the trends in annual
incidence of polio in India. The estimated number of cases (with an
upward adjustment of reported cases during 1982-1999) shows a similar
declining trend over time, with large outbreaks of polio in certain
years such as 1987 and 1992. In comparison, the counterfactual number of
new cases, which is based on a constant pre-vaccine incidence rate and
annual estimated population, shows a steady upward trend over time. The
gap between the counterfactual series and the estimated series can be
attributed to the National Polio Program as the aggregate averted
incident cases of polio.
 |
|
Fig. 1 Reported, adjusted, and
counterfactual incident cases of paralytic polio in India,
1982-2012.
|
Table II presents the results of our
analysis. Our estimates are from an ex-post perspective, i.e. no
discounting other than in the calculation of DALYs is used. In our base
case model which considers a pre-vaccine incidence rate of 15.0 per
100,000 people [19], we estimate that the National Polio Program averted
3.94 million (95% confidence interval [CI]: 3.89–3.99 million) paralytic
polio cases, 393,918 polio deaths (95% CI: 388,897-398,939), and 1.48
billion DALYs (95% CI: 1.46-1.50 billion) between 1982 and 2012. Using
the VSL approach, total gains in economic productivity from the program
are estimated to be $1.71 trillion (INR 76.91 trillion) (95% CI:
$1.69-$1.73 trillion [INR 75.93-77.89 trillion]).
TABLE II Estimated Health and Economic Benefits of Polio Eradication in India, 1982-2012
Scenario
|
Estimated benefits |
95% Confidence Interval |
|
Base case model (pre-vaccine incidence of 15.0 per 100,000 people) |
|
Incident paralytic cases averted (million) |
3.94 |
3.89–3.99 |
|
Deaths averted |
393,918 |
388,897–398,939 |
|
DALYs averted (billion) |
1.48 |
1.46–1.50 |
|
Economic gain (VSL method) 2011 US$, trillion |
1.71 |
1.69–1.73 |
|
2011 INR, trillion |
76.91 |
|
|
Economic gain (DALY/GNI per capita method) |
|
2011 US$, trillion |
1.11 |
1.10–1.13 |
|
2011 INR, trillion |
50.13 |
49.50–50.76 |
|
Sensitivity analysis (pre-vaccine incidence of 11.25 per 100,000 people) |
|
Incident paralytic cases averted (million) |
2.95 |
|
|
Deaths averted |
295,302 |
|
|
DALYs averted (billion) |
1.11 |
|
|
Economic gain (VSL method) 2011 US$, trillion |
1.28 |
|
|
2011 INR, trillion |
57.65 |
|
|
Economic gain (DALY/GNI per capita method)2011 US$, billion |
835.14 |
|
|
2011 INR, trillion |
37.58 |
|
|
Sensitivity analysis (pre-vaccine incidence of 18.75 per 100,000 people) |
|
Incident paralytic cases averted (million) |
4.93 |
|
|
Deaths averted |
492,534 |
|
|
DALYs averted (billion) |
1.85 |
|
|
Economic gain (VSL method) |
|
|
|
2011 US$, trillion |
2.14 |
|
|
2011 INR, trillion |
96.17 |
|
|
Economic gain (DALY/GNI per capita method) |
|
2011 US$, trillion |
1.39 |
|
|
2011 INR, trillion |
62.69 |
|
|
Note: The 95% uncertainty ranges are obtained from a 500 simulation sensitivity analysis varying the incidence rate of polio in the interval 11.25-18.75 per 100,000 people [19]. All economic estimates are in 2011 constant US dollars (US$1 = INR 45). |
If we consider the lower and upper bound value of the
sensitivity interval of the pre-vaccine incidence rate (11.25 and 18.75
per 100,000 people, respectively), the total health gain from polio
control would be 2.95-–4.93 million incident paralytic polio cases
averted, 295,302-492,534 averted deaths and 1.11-1.85 billion DALYs
averted. The economic gain using the VSL approach would be $1.28-$2.14
trillion (INR 57.65-96.17 trillion).
If we consider the same pre-vaccine incidence of
paralytic polio as in the base case model (15.0 per 100,000 people) but
consider the economic value of one DALY to be equal to the GNI per
capita in a given year [26,27], the total economic gain from the polio
program would be $1.11 trillion (INR 50.13 trillion) (95% CI:
$1.10-$1.13 trillion [INR 49.50–50.76 trillion]). With this alternative
valuation of DALYs, pre-vaccine incidence rates of 11.25 and 18.75 per
100,000 would result in economic gains of $835.14 billion and $1.39
trillion (INR 37.58 and 62.69 trillion), respectively. The estimated
health gains of the program would remain unaffected under this
alternative approach.
Discussion
Overall, our findings indicate that India accrued
large health and economic benefits from investing in polio elimination
efforts. We estimate that India averted 3.94 million paralytic cases of
polio, 393,918 related deaths, 1.48 billion DALYs, and gained $1.71
trillion (INR 76.91 trillion) in economic productivity between 1982 and
2012 in our base case analysis. In Indian vernacular, one billion is
equal to 100 crores and one trillion is equal to one lakh crores. Thus,
the National Polio Program contributed much to the economic growth of
India, a fact not appreciated by many.
Previous studies have estimated the benefits of polio
eradication in various countries under different time horizons and under
different polio eradication initiatives. Duintjer-Tebbens and colleagues
[15], for instance, estimated the incremental net benefits of the GPEI
was $40-$50 billion from 1988 to 2035, which was estimated to prevent
eight million paralytic polio cases. Khan and Ehreth [14] estimated the
total medical care cost savings from global polio vaccination campaigns
was $128 billion (in 2000 USD), which prevented four million paralytic
polio cases, 855,000 deaths, and 40 million DALYs from 1970 to 2050.
Bart and colleagues [23] estimated a much lower savings from global
polio eradication. They estimated that a global eradication initiative
would result in savings of $13.6 billion (in 1993 USD) from 1986 to
2040. Thompson and Duintjer-Tebbens [24] estimated the net benefits of
the polio elimination program in the United States was $180 billion (net
present value in 1955) due to prevented treatment costs alone, including
1.1 million prevented cases of paralytic polio and over 160,000
prevented deaths from 1955 to 2005.
In order to complete eradication of all polio, due to
wild and vaccine-derived polioviruses, the GPEI recommends that
countries begin introducing at least one dose of inactivated polio
vaccine (IPV) into routine immunization by the end of 2015, phasing out
the use of OPV in a staggered manner (by serotype) until only IPV is in
use without any OPV [28]. Theoretically vaccination will no longer be
needed in the future [28]. Phasing out OPV is necessary since it can
cause vaccine-associated paralytic polio (VAPP) and evolve into
circulating vaccine-derived polio virus (cVDPV), meaning the virus can
survive in the community and emerge as wild-like, IPV is required to
mitigate the risks of immunodeficiency-related vaccine-derived polio
virus (iVDPV) spreading in the community and of cVDPVs causing polio
outbreaks. All interventions against vaccine-related polio are together
called the "endgame strategy" of polio eradication. India’s endgame
strategy started in 2015 by roll out of routine IPV vaccination.
Some researchers postulate that IPV vaccination may
be necessary even after the declaration of eradication of polio due to
wild and vaccine-derived viruses [29,30]. Since there is such a need for
continued IPV vaccination for the foreseeable future, the economic
rationale for current polio eradication efforts is less certain [29]. As
IPV is costly for poorer countries, the decision to eventually switch to
IPV in these countries may not be economically justified, even though it
is essential for eradication. Duintjer Tebbens and colleagues [32] argue
that continued OPV use indicates that either there will be high costs
forever, or a large number of cases forever, which gives credence to
long-term health and economic benefits of switching from OPV to IPV.
Barrett, et al.[33] argue that wealthier countries should
subsidize the cost of IPV for poorer countries for several years until
the risks from cVDPV has dropped or disappeared. After this, poorer
countries would be able to stop vaccination altogether.
There are several limitations to our analysis. First,
we may underestimate the benefits of polio elimination for a few
reasons. Our analysis starts with 1982, but routine polio immunization
was adopted in India beginning in 1978 in a staggered manner. Thus, we
may underestimate the benefits of polio elimination by not including
1978-1981 in our calculation. Also, long-term benefits beyond 2012 are
not included in our analysis. Another reason for underestimation may be
the incidence rate of 15 per 100,000 people that we used in the
analysis. There are reports of higher incidence rates, but we used the
very conservative data [21].
Second, we assumed a constant polio incidence rate
under the counterfactual scenario and did not take into account polio
transmission dynamics. Due to lack of data, possible changes in the
incidence over time could not be incorporated in our analysis. However,
we used a wide sensitivity range to evaluate other incidence scenarios.
Third, there is no data on the lifetime cost of polio per patient in
India, including treatment costs and productivity losses. Therefore, we
refrained from calculating averted treatment costs in our analysis. More
robust cost estimates may yield estimated economic benefits different
from–likely higher–than those evaluated using the VSL method.
Fourth, due to a lack of data on the programmatic
costs of polio elimination in India, we were unable to reliably estimate
the cost-effectiveness or benefit-cost ratios of the program. A recent
study by Prinja, et al. [34] estimated the cost of routine
immunization per child in three states of India to be $1.80, and the
cost of supplementary immunization for polio (Pulse Polio) to be $28.80
per child. There are two other older studies which estimated the cost of
polio immunization in India [35,36]. However, none of them provide
long-term cost data during 1982-2012 required for our analysis. Even
considering the approximately $2 billion apportioned to the polio
elimination program by the Indian government and donor agencies [3],
these reported costs pale in comparison to the huge economic gains
estimated in our analysis.
Fifth, our results may be somewhat underestimated
since we included life expectancy at birth to calculate DALYs and to
subsequently compute economic benefits; however, using life expectancy
at age three would have been more robust since life expectancy at age
three is likely longer than at birth because life expectancy at birth
incorporates infant mortality.
Finally, while we assume a counterfactual scenario of
no elimination efforts (including no polio immunization), other
comparisons are also possible. For example, the supplementary
immunization (Pulse Polio) could be compared against a counterfactual
scenario of polio immunization as part of a routine universal
immunization program. This would be helpful in comparing the incremental
costs and benefits of the different components of polio elimination
efforts in India.
Contributors: AN, DB: collected the data and
conducted the analysis. All authors interpreted the findings and wrote
the manuscript.
Funding: None; Competing interest: None
stated.
|
What is Already Known?
• Health interventions could not only help
avert morbidity and mortality, but they could also substantially
increase economic productivity over the productive lifetime of
individuals.
What This Study Adds?
• We find that the national polio elimination
efforts during 1982-2012 in India have brought tremendous health
and economic gains.
|
References
1. World Health Organization. Poliomyelitis Fact
Sheet 2014. Available from:
http://www.who.int/mediacentre/factsheets/fs114/en/. Accessed
February 13, 2015.
2. Global Polio Eradication Initiative. Polio this
week 2015. Available from:
http://www.polioeradication.org/Dataandmonitoring/Poliothisweek.aspx.
Accessed November 25, 2015.
3. Global Polio Eradication Initiative. WHO
South-East Asia Region Declared Polio-Free 2014. Available from:
http://www.polioeradication.org/tabid/488/iid/362/default.aspx.
Accessed March 27, 2016.
4. World Health Organization. India records one year
without polio cases 2012. .Available from:
http://www.who.int/mediacentre/news/releases/2012/polio_20120113/en/.
Accessed March 27, 2016.
5. National Health Mission. Background Routine
Immunization Programme 2013. Available from: http://nrhm.gov.in/nrhm-components/rmnch-a/child-health-immunization.html.
Accessed March 27, 2016.
6. John TJ, Vashishtha VM. Eradicating poliomyelitis:
India’s journey from hyperendemic to polio-free status. Indian J Med
Res. 2013;137:881-94.
7. Global Polio Eradication Initiative. India - Polio
Fact Sheet 2012. Available from:
http://www.polioeradication.org/Portals/0/Document/InfectedCountries/India/PolioIndiaFactSheet.pdf.
Accessed March 27, 2016.
8. Ministry of Health and Family Welfare. Pulse Polio
Programme - Governnment of India 2014. Available from:
http://nrhm.gov.in/nrhm-components/rmnch-a/child-health-immunization/pulse-polio-programme.html.
Accessed February 13, 2015.
9. Aylward RB, Acharya A, England S, Agocs M, Linkins
J. Global health goals: lessons from the worldwide effort to eradicate
poliomyelitis. Lancet. 2003;362:909-14.
10. Thompson KM, Tebbens RJD. Eradication versus
control for poliomyelitis: an economic analysis. Lancet.
2007;369:1363-71.
11. Bart KJ, Foulds J, Patriarca P. Global
eradication of poliomyelitis: Benefit-cost nalysis. Bull World Health
Organ. 1996;74:35-45.
12. Aylward R, Acharya A, England S, Agocs M, Linkins
J. Polio eradication. In: Smith R, Beaglehole R, Woodward D,
Drager N, editors. Glob. public goods Heal. Heal. Econ. public Heal.
Perspect., Oxford University Press: 2003, p. 33-53.
13. Musgrove P. Is polio eradication in the Americas
economically justified? Bull Pan Am Health Organ. 1988;22:1-16.
14. Khan MM, Ehreth J. Costs and benefits of polio
eradication: A long-run global perspective. Vaccine. 2003;21:702-5.
15. Duintjer Tebbens RJ, Pallansch MA, Cochi SL,
Wassilak SGF, Linkins J, Sutter RW, et al. Economic analysis of
the global polio eradication initiative. Vaccine. 2010;29: 334-43.
16. WHO. Making Choices in Health: WHO Guide To
Cost-Effectiveness Analysis. Geneva: World Health Organization; 2003.
17. Murray CJL, Acharya AK. Understanding DALYs. J
Health Econ. 1997;16:703–30.
18. Murray CJ, Lopez AD. Global Burden of Disease.
Massachusets: Harvard University Press; 1996.
19. Joseph B, Ravikumar R, John M, Natarajan K,
Steinhoff MC, John TJ. Comparison of techniques for the estimation of
the prevalence of poliomyelitis in developing countries. Bull World
Health Organ. 1983;61:833-7.
20. John TJ. Understanding the scientific basis of
preventing polio by immunization . Pioneering Contributions from India.
Proc Indian Natl Sci Acad. 2003;B69:393-422.
21. John TJ. Poliomyelitis in India: prospects and
problems of control. Rev Infect Dis. 1984;6:S438-41.
22. World Bank Data. World Bank, Washington DC 2015.
Available from: http://databank.worldbank.org/Data/. Accessed January 1,
2016.
23. Laxminarayan R, Jamison DT, Krupnick AJ, Norheim
OF. Valuing vaccines using value of statistical life measures. Vaccine
2014;32:5065-70.
24. Laxminarayan R, Klein EY, Darley SR, Adeyi O.
Global investments in TB control: economic benefits. Health Aff.
2009;28:w730-42.
25. Stenberg K, Axelson H, Sheehan P, Anderson I,
Gülmezoglu AM, Temmerman M, et al. Advancing social and economic
development by investing in women’s and children’s health: A new global
investment framework. Lancet. 2014;383:1333-54.
26. WHO guide for standardization of economic
evaluations of immunization programmes. Initiative for Vaccine Research,
Department of Immunization, Vaccine, and Biologicals. Geneva: World
Health Organization, 2008.
27. Macroeconomics and Health: Investing in Health
for Economic Development. Report of the Commission on Macroeconomics and
Health, Geneva: World Healh Organization; 2001.
28. Thompson KM, Tebbens RJD. Retrospective
cost-effectiveness analyses for polio vaccination in the United States.
Risk Anal. 2006;26:1423-40.
29. World Health Organization. About the Polio
Endgame Strategic Plan 2015. Available from:
http://www.who.int/immunization/diseases/poliomyelitis/endgame_objective2/about/en/.
Accessed January 1, 2016.
30. Barrett S. Stop! The polio vaccination cessation
game. World Bank Econ Rev. 2011;24:361-85.
31. Miller M, Barrett S, Henderson DA. Control and
Eradication. In: Jamison DT, Breman JG, Measham AR, Alleyne G,
Claeson M, Evans DB, et al., editors. Dis. Control Priorities
Dev. Countries, Second Ed. Washington D.C.: World Bank; 2006. P.
1163-76.
32. Duintjer Tebbens RJ, Pallansch MA, Cochi SL,
Wassilak SGF, Thompson KM. An economic analysis of poliovirus risk
management policy options for 2013-2052. BMC Infect Dis. 2015;15:389.
33. Barrett S. Eradication versus control: the
economics of global infectious disease policies. Bull World Health
Organ. 2004;82:683-8.
34. Prinja S, Jeet G, Verma R, Kumar D, Bahuguna P,
Kaur M, et al. Economic analysis of delivering primary health
care services through community health workers in 3 North Indian states.
PLoS One 2014;9:e91781.
35. John T. Cost and benefit of immunization in
India. Indian Pediatr. 1981;18:513-6.
36. Yadav K, Rai SK, Vidushi A, Pandav CS.
Intensified pulse polio immunization: Time spent and cost incurred at a
primary healthcare centre. Natl Med J India. 2009;22:13-7.
37. World Health Organization. Polio Incident Cases
2016. Available from: http://apps.who.int/immunization_ monitoring/globalsummary/timeseries/tsincidencepolio.
html. Accessed March 27, 2016.
|
|
|
 |
|