|
|
|
Indian Pediatr 2019;56: 773-788 |
 |
Screen Time in Under-five Children
|
|
Nimran Kaur 1,
Madhu Gupta1,
Prahbhjot Malhi2
and Sandeep Grover3
From Departments of 1Community
Medicine and School of Public Health, 2Pediatrics and
3Psychiatry; Postgraduate Institute of Medical
Education and Research, Chandigarh, India.
Correspondence to: Dr Madhu Gupta, Professor,
Department of Community Medicine and School of Public Health,
Postgraduate Institute of Medical Education and Research (PGIMER),
Chandigarh, India.
Email: [email protected]
|
|
Context: Screen-viewing in
childhood is primarily a mean of entertainment, during the unstructured
time. We aimed to review the burden of the problem, delineate the
associated factors and correlates, evaluate the impact of screen-time on
the overall health of under-five children, and the interventions to
reduce screen-time. Evidence acquisition: Published
articles from January 2009 to June 2018 were searched through PubMed,
Clinical Key, Scopus, Embase, and Google Scholar using key Medical
Subject Heading words. Results: The burden of screen-time varied
from 21% to 98% in the middle-income, and 10% to 93.7% in the
high-income countries. The social ecological model was used to
illustrate associated factors and correlates including child, caregiver,
micro and macro digital-media environment related factors. The
interventions included increase in the physical activity, reduction in
the body mass index, improving sleep and dietary behaviors etc. The
effectiveness of these interventions ranged from 0.3 minutes (standard
error 13.3) to -47.16 minutes (standard error 2.01). Conclusion:
Clinicians should obtain history of screen-time in children, and advise
limiting the screen exposure according to the child’s age. There is a
need to generate evidence on burden and effectiveness of interventions
among children in the Indian settings, owing to the limited data.
Keywords: Digital-media, Obesity, Screen
exposure, Sedentary behaviors, Smartphone, Television.
|
|
S
creen-time or digital-screen exposure is the
duration of time spent by the individual in using electronic/digital
media like television (TV), smartphone, tablet or computer [1]. As per
American Academy of Pediatrics (AAP) guidelines [2], children below the
age of two years should not have any screen exposure, and screen time of
³1 hour per
day is considered excessive among children aged 2-5 years. Also, for the
proper growth and development of children, the use of digital-media
should be restricted while eating meals, or one hour before sleep.
Excessive screen time is predominantly associated
with sedentary behaviors in children and adolescents [3]. Excessive
screen time is considered as one of the major role players in causing
non-communicable diseases (NCDs) [4] and health risks [5] later in life.
A longitudinal study reported that there was a rapid increase in TV-time
by one year of age, and children who had screen time <1 hour per day at
14 months of age, started watching screens for >2 hours per day when
they are aged 30 months [1]. A Japenese study reported that 29.4% of
children of age 18 months, 24.5% of age 30 months, and 21% at both ages
watched TV for 4 hours or more per day [6]. Children below the age of
two years who watched TV for any duration per day, and children aged >2
years who watched TV for >2 hours per day were more likely to show a
delay in motor skill development [7]. Further, screen time has been
associated with impairments in language development [7,8], and
behavioral [6], psychosocial, academic and physical wellbeing [9].
There is limited published data on the duration of
screen time, its associated factors and intervention studies on reducing
it in the low- and middle-income countries (LMIC). The purpose of this
review is to document the burden of screen time, its associated factors
and correlates, outline the health impact, and summarize the
interventions developed to reduce screen time among under-five children.
Search strategy: A literature review of published
articles from January 2009 to June 2018 was performed through searches
in PubMed, Clinical Key, Scopus, Embase, and Google Scholar. Medical
Subject Headings (MeSH) words used were ‘preschooler’, ‘infant’, ‘kid’,
and ‘toddler’ for child-related terms; and ‘screen-time’,
‘screen-viewing’, electronic media related- ‘electronic media’,
‘digital-media’, ‘TV’, ‘smartphone’, ‘mobile phone’ for screen-time
related terms. When relevant articles were identified, cross-references
were searched for related studies.
Inclusion criteria for a searched article included (i)
peer-reviewed article published in English language in the scientific
journals; (ii) cross-sectional studies on prevalence of
digital-media use, adherence to screen time guidelines, correlates of
digital-media use among under-five children; (iii) cohort or case
control studies assessing association between at least one digital-media
gadget and behavioral outcome or demographic correlate among under-five
children; (iv) interventional studies in a school-, clinic-,
hospital-, family-, home-, or community-based setting to reduce screen
time as one of the outcome; and (v) studies measuring (proportion
or mean) the use of atleast one type of digital-media gadget (like TV,
computer or videogames etc) by children. The articles reporting
digital-media exposure of caretakers or parents or diseased children or
older children were not included in the analysis.
Potentially relevant articles were screened by their
titles, and abstracts. When the abstract was not available or had
incomplete findings, the entire article was retrieved. Articles
describing study protocols, reports, dissertations, models and
conference abstracts were excluded. Data extraction form was used
to obtain the study information, study design, country, age of
participants; exposure i.e., screen-based characteristics (e.g.,
duration, frequency, pattern, and measurement and/or description of
intervention); outcome/health indicators (e.g., measurement
type); results (e.g., odds ratio, difference in means); and
covariates included in the analyses (e.g., eating behaviors,
emotional outcomes, sleep outcomes, psychological outcomes, nutrition,
parental perceptions, parental behaviors, parenting skills, home
environment, physical activity of the children). The search was done by
two authors, and it was cross checked by the third author for correctly
excluding the studies. Any discrepancies were resolved by the fourth
author.
 |
|
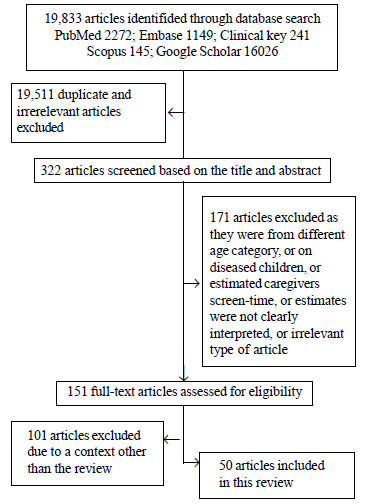
Fig. 1 Flow diagram depicting
the inclusion and exclusion criteria for selecting the articles
at each stage.
|
We identified 19,833 articles, 19511 were either
duplicates or irrelevant, among these 322 articles were screened based
on their title and abstract (Fig. 1). Of the 322 studies,
171 articles were excluded based upon the exclusion criteria, and 151
full text articles were assessed. Of these 101 articles were excluded
due to a context other than the review. Finally, 50 studies were
reviewed including 14 cross-sectional studies [4,7,8,10-20], on
prevalence, associated factors, correlates and consequences of excessive
digital-media exposure (Table I) [1,6,9,21-28]; 11
overlapping studies and two systematic reviews [29,30] on the associated
factors, correlates and consequences of excessive digital-media exposure
[1,6,9,21-28]; 16 intervention studies [31-46], three systematic reviews
[3,5,47] and four digital-media guidelines [2,48-50] among under-five
children. Among the 16 interventions studies, two were pilot-RCTs
[31,32], four cluster-RCTs [39-42], and ten RCTs [33-38,43-46] (Table
II). All studies relied on the information given by the parents.
TABLE I Summary of Prevalence Studies, Associated Factors, Correlates of Screen Time Among Children Aged 0-5 years.
|
Place (no.of studies) |
Author (Year)[Ref ] |
Age in years (sample size) |
Study design |
Study tool |
Prevalence of ST
|
Associated factors andcorrelates of ST |
|
High-income countries (n=16) |
|
Australia (n=3) |
Hinkley, et al. (2012) [18] |
3-5 (1004) |
Baseline data of a cohort study known as HealthyActive Preschool
and primary years was used.
|
Survey tool was used to record parents report on DM use (TV/
video/ DVDviewing/ electronic games/ computer use) by the child. |
•Average ST/ day112.5 min (95% CI = 107.8–117.2). •Majority
(99.4%) watched TV; 31.1% computer/ other electronic games;
28.8% used computer/ internet other than games
|
•Positive relationship with age
•No relationship with gender
|
|
|
|
|
|
|
|
|
|
Downing, et al. (2017) [19] |
3-5 (100) |
Baseline data of a cohort study known as HealthyActive Preschool
and primary years was used.
|
Survey tool was used torecord parents report onDM use of (TV/
video/DVD / electronicgames / computer) by the child. |
•Mean (SD) sedentary timeof children 301.1 (34.1)min/day, and ST
was 108.5 (69.6) min/day.
•Children spent 108.5(69.6) min/day in ST. |
•Parental concerns about child’s sedentary behavior were
associated with girls’ ST.
•Inverse relationship: sleep duration to girls’ sedentary time
and boys’ ST; Parental self-efficacy; Maternal ethnicity to
child preferences to sedentary behaviours’ and girls’ ST
•No relationship with gender, child preferences for
sedentary behavior.
|
|
|
|
|
|
|
|
Brown, et al.(2010) [21] |
4-5 (4983)
|
Data from two waves ofthe Longitudinal Study ofAustralian
Children (LSAC).
|
Data were obtained in face-to-face interviews, questionnaires
and diaries of the child’s TV viewing as reported the
parent. |
|
•Positive relationship with child’s ST to mothers who
worked part-time.
|
|
|
|
|
|
|
Canada (n=3) |
Carson, et al.(2012) [10] |
0-5 (746 )
|
Cross-sectional on participants recruited from the Healthy
LivingHabits in Preschool Children project.
|
Data obtained from the parents with the help of questionnaires
|
•Most participants (93.7%) watched TV and 37.9%
playedvideo/computer games. |
•Positive relationship with child’s age, parental attitudes,
parental barriers, parental descriptive norms,parental ST,TV in
the bedroom.
•Inverse relationship with parental education, parental income,
parental self-efficacy. |
|
|
|
|
|
Pagani, et al. (2010) [9] |
2-5(1314) |
Longitudnal study data from the Quebec Longi-tudinal Study
of Child Development was taken for recruiting the participant. |
Parent reported TV exposure of children on weekdays and
weekends. |
•11% children at 29 monthshad ST >2 h/ day. •23.4% of the
children at 53 months had
|
•Positive relationship with victimi-zation by classmates,
BMI, age. •Inverse relationship with class-ST >2 h/day. room
engagement, math achievement, pa on weekends, other
activities that require physical effort. |
|
|
|
|
|
Carson, et al. (2010) [11] |
4-5 (1633) |
Cross-sectional study data was gathered from the Healthy
LivingHabits in Preschool Children project (2005-2007). |
Data were obtained from theparents with the help
ofquestionnaires.
|
•42% (40% for girls and 45% for boys) of participants engaged in
>2 h/day of ST
•78% (68% for girls, and 80% for boys)of children engaged in>1
h/day of ST.
|
•Positive relationship with girlsfrom low socio-economic
statusneighbourhoods.
•Children from low socio-economic status neighbourhoods used
morevideo games whereas those fromhigh socio-economic status
neighbourhoods used morecomputers. |
|
|
|
|
|
|
|
|
|
Europe (n=1) |
Kourlaba, et al.(2018) [4] |
1-5 (2374) |
‘Growth, Exercise and Nutrition Epidemiological Study in
pre-schoolers’ (GENESIS study).
|
Parents reported weekday and weekend TV/ videoviewing by
the child on being asked specific questions froma survey tool. |
•Average ST 1.32 h/ day,where 26% of childrenspent
≥2 h/day. 32% of children aged •
3-5 y watched TV >2 h/ day, which was higher, than in children
aged 1-2 y. |
•Significant relationship with age, parental TV viewing ,
the region of residence, maternal level of
education.
|
|
|
|
|
|
|
UK (n=2) |
Barber, et al. (2017) [1] |
0-3 (1558) |
Born in Bradford (BiB) was a longitudinal multi-ethnic birth
cohort study(2007-10)
|
Questions were validated from the Southampton Women’s Survey
Question- naire which is validated for adults |
75% of children aged 1 yexceeded guidelines of zeroST.
|
•Positive relationship with TV switched on at home,
mother’s perceptions on ST of children, children of first time
mothers, maternal stress, mother not born in the UK. |
|
|
|
|
|
Jago, et al. (2012) |
3-10 (2965) |
Cross-sectional |
Parents reported weekdayand weekend TV/ video viewing by
the child on being asked specific questions fromsurvey
tool.
|
|
•Positive relation with parental ST, access to DM
• Maternal ST had stronger relationrelated to child’s st when
compared with that of father’s. |
|
|
|
|
|
USA (n=5) |
Christakis, et al. (2009) [12]
|
0-5 (168) |
Cross-sectional |
Research staff went to the enrolled child-care programsto fill
up the survey tool withthe help of the staff at childcare
programs.
|
Mean ST/ day for children in day care was 3.4 h in home-based
programs, ascompared with 1.2 h incenter-based programs. |
The children attending home-basedchild-care programs have more
propensity to watch TV on an average day than those in
center- based programs. folds (P<0.001).
|
|
|
|
|
|
Asplund, et al. (2015) [13] |
0-5 (314) |
Cross-sectional |
A self-administered surveyquestionnaire parents on DM use (TV/
video games/ com-puter/ cell-phones and other DM devices) by
children.
|
•53% children met AAPguidelines on ST viewing,
•56% met AAP guidelinesfor no TV in the child’s bedroom
•Only 29% met both guidelines.
•Children were more likelyto meet the guidelines if they had <2
TVs in theirhomes, dinner without TV, or restricted parental ST. |
•Positive relationship with age,parental ST and beliefs
regarding ST,
•Negative relationship with no TVduring dinner,
healthy parentalbeliefs, access to TV at home.
•No relationship with child’s ethnicity, child’s BMI
category,parent’s age, parent’s ethnicity, TV in the child’s
bedroom, survey language.
|
|
|
|
|
|
|
|
|
|
|
|
|
Emond, et al.(2018) [14] |
2-5 (385) |
Cross-sectional
|
An online survey was given toparent where they reported upon DM
use of their children
|
•Children watched mean(SD) 31.0 (23.8) h/week of DM
•46% used DM gadgets within 1 h of bedtime •41% used DM
gadgets in their bedrooms. |
•Positive association with greater household DM use within
1 h of bedtime (P<0.01) in a dose-dependent manner.
|
|
|
|
|
|
|
|
Tandon, et al.(2011) [22] |
2-5 (10700) |
Early Childhood Longitudinal Study-Birth Cohort |
Parents reported the DM use (TV/ DVD/ video watching time) of
thechildren.
|
•66% of children exceeded>2h/day guidelines of ST.
•70% of children in Head Start exceeded >2 h/day ST.
•The average ST for children was 3.5 h/day
|
•Children in home-based care had the maximum ST (5.5
h/day), followed by parental care only (4.4 h/day), head start
(4.2 h/day) and child-care centers (3.2 h/day).
•No relationship with household income, child’s race/ethnicity,
child’s gender, primary language and mother’s education,
employment status, marital status, primary language. |
|
|
|
|
|
|
|
Fulton, et al.(2009) [15] |
2-5 (2861) |
Cross- sectional The 1999-2006 data of NationalHealth and
Nutrition Examination Survey was used to select parents. |
Computerized interviews were administered to parent/ guardian
reported the DM(TV/ computer) used bychildren.
|
•71% of children (2-5 y)viewed TV for £2h/day.
•45% of children reported no computer use on the previous day.
|
•No relationship with overweight/ obesity
•Positive relationship with Mexican-American ethnicity
•Negative relationship with non-hispanic black ethnicity
|
|
|
|
|
|
|
Japan (n=1) |
Cheng, et al.(2010) [6] |
0-3 (479) |
Cohort study dataanalyzed from JapanChildren’s study.
|
Parent reported DM usage (TV) of the children
|
•29% (aged 18 mos) watched TV ³4 h/day,24.5% children (aged 30mos),
and 21% at both ages. |
•Positive association with TV exposure at young age
with hyperactivity–inattention, children of low income
groups
•Negative relationship with prosocial behavior in older
children
|
|
Korea (n=2)
|
Byeon, et al. (2015) [8] |
2 (1778) |
National cross- sectional survey |
Parent questionnaires throughcomputer assisted personal
interview were used to gatherdata on DM usage by their children. |
•The average TV viewingtime of children was 1.21 h/day.
• About 44% children had ST between 1-2 h/day. |
•Positive relationship with languagedelay
|
|
|
|
|
|
Chang, et al. (2018) [23]
|
2-5 (400) |
A part of the Internet-Cohort for Understanding of internet
addiction Risk factors/ Rescue in Early livelihood
(I-CURE) study.
|
Survey tool was used to gather information fromthe parent/
reported the DM use (TV viewing) oftheir children. |
•On weekdays, 48% ofchildren watched TV for >1 h/day.
•On weekends, 63.1% watched TV for >1 h/day,
•23.4% of children usedtheir smartphones for >1 h/day.
|
•About 65% of children were exposed to TV before 2
years.
•Before 1 year of age, 12.2% ofchildren were using smartphones
for the first time.
•31% of the children were using smartphones before 2 years.
|
|
|
|
|
|
|
|
|
Middle-income countries (n=5) |
|
China (n=2) |
Lin, et al.(2014) [7] |
0-3 (150) |
Cross-sectional |
Survey tool was used togather information fromcaregivers about
DM (TV,smartphone, iPad, and computer) Of their children. |
•Children <2 y watched TV>0 h/ day, and children (≥2years)
who watched >2 h/day were more likely toshow a delay in motor
skilldevelopment. •Children (0-2 y) watched an average of 67.4
min/day of TV.
|
•Positive relationship with delayed cognitive
development, language development, motor-
development, type of care taker
•Negative relationship with Maternal education
|
|
|
|
|
|
|
|
|
|
Wu, et al. (2016) [17] |
3-6(202) |
Exploratory quantitativestudy |
A validated questionnaire (Chinese) was developed to gather
demographics of the children, parents, and home environment and
pattern of parent-child and child’s DM use by the parents.
|
|
• Positive relationship with antisocial behaviour
cartoons, cognitive development, functional development.
•Significant relatioship with child’sage, child’s
gender, parent’s age, number of children in
the family, parental employment status, family income,
location of the computer. |
|
|
|
|
|
|
|
|
India (n=1) |
Verma, et al.(2018) [24] |
6 mo -2 yrs (100) |
Prospective |
The children were observed atan interval of two years till they
attain two years of age –Survey tool was used
|
|
• Negative relation with achieving cognitive milestones
•No relationship with achieving physical milestones.
|
|
|
|
|
Malaysia (n=1) |
Lee, et al.(2016) [16] |
4-6 (835)
|
A part of the South East Asian Nutrition Surveys (SEANUTS) |
Questionnaire were adminis-tered to the parents/ caregiversthat
gathered information on DM used by children. |
•27% of children (25.7%urban, 32.7% rural) had daily ST of
>2 h/day.
•Only 24.1% boys from rural areas had ST of <1 h/day in
comparison, 46.2% girls. |
• Few (27%) children exceeded dailyST recommendations.
• In rural areas, lesser boys (24.1%) in comparison to the girls
(46.2%)had ST of <1 h. •No relationship with the area of
residence, ethnic group, household income, and maternal
education. ethnic groups, household income, maternal education
•Boys had significantly higher ST.
|
|
Thailand (n=1) |
Ruangdaraganon,et al. (2009) [25]
|
0-2 (260) |
A part of the Prospective Cohort Study of ThaiChildren (PCTC),
that followed up children from birth to 2 years of age.
|
Parent were interviewed face- to-face and on the telephone
togather information on reported DM (TV viewing) inchildren.
|
•Children aged 6 mo (98%),1 y (95.3%) and 2 y (96.7%) watched
TV.
•About 22% of children (1 y) spent ³2 h/day on TV,and 38.4% of
2-year-old children watched TV ³2 h/day. •The mean (SD) ST
was 1.23 (1.42) h/d (1 year old) and 1.69 (1.56)
h/day (2 year old). |
•Positive relationship with age; parents believed that TV
viewing was beneficial to child’s evelopment.
•No relationship with delayed language development, Number
of household TV, TV in child’s bedroom |
|
ST: screen time; TV: television; DM: digital media; PA:
physical activity. |
TABLE II Summary of Intervention Studies on Screen Time in Children Aged 0-5 years
|
Place (No. ofstudies) |
Author(Year)[Ref] |
Age in years |
Study design
|
Sample size |
Intervention group package |
Control group package |
Endpoints |
Mean difference in ST in intervention versus control arm
(95% CI) |
|
Australia (n=1) |
Hinkley, et al.(2015) [32] |
2-3 |
Pilot-RCT
|
22 |
Group sessions, family-based activities, problem-solving, and
challenges dis-cussed in six sessions. Social cognitiveand
Family Systems theories were used. |
Families just received usual health services. |
ST
|
-31.2 minutes/day (SE=20.3, Interval: -70.99, 8.59) |
|
Canada (n=2) |
Birken, et al.(2012)[46] |
2-4 |
RCT |
351 |
Counseling parents, parties, child involvement and TV turn-off
time but no follow-up was done. The Social cognitive theory was
used. |
Parents receivedstandard counseling from trained personnel
on media use. They were given media guidelines published by the
Canadian Pediatric Society |
Mean total weekday andweekend ST. |
-7 minutes/day (SE=15.56, Interval: -37.50, 23.50).
|
|
Haines, et al. (2013) [44] |
2-5
|
RCT |
121 |
Motivational coaching at home and byphone, educational
materials, TV control device, incentives, and text messages.
Follow-up was done. Social-ecologicalmodel.
|
Families were mailed educational materials focused on
child development.
|
Sleep duration, TV viewing and BMI. |
-32.4 minutes/day (SE =20.98, Interval: -73.48, 8.68)
|
|
|
|
|
|
Europe (n=4) |
Yilmaz, et al. (2015) [38] |
2-6 |
RCT |
412 |
Family intervention, counseling calls and educational material
given to parents. No follow-up was done. The Social cognitive
theory was used.
|
Families just receivedusual health services. |
Mean ST violentbehaviors, languagedevelopment, tobacco
smoking,BMI in children and sedentary behavior. |
-47.2 minutes/day (SE =2.01, Interval: -51.10,
-43.22)
|
|
Puder, et al. (2011) [40] |
3-5 |
RCT |
652 |
Multi-dimensional culturally tailored lifestyle intervention,
and adapted for the built environment of the preschool class.
|
The children did not receive any new informative material. They
continued their regular school curriculum. |
Aerobic-fitness,BMI, motor agility,balance, percentagebody fat,
waist circumference, PA, eating habits, ST, sleep,
psycho-logical health, and cognitive abilities.
|
-13.4 minutes/day (SE 5.94, Interval: -25.04, -1.76)
|
|
|
|
|
|
|
|
|
Grieken, et al. (2015) [34] |
5 |
Cluster 637RCT |
Lifestyle counseling, questionnaires,
|
All parents attended behavior change, and home environment
modifications with follow-up. ASE model,precaution process
model, elaboration likelihood model, and the stages of
changemodel. |
Duration of outsidewell-child visits. Theyreceived general
information about nutrition and physical activity.
|
-1.6 minutes/day (SE =6.63, play, or TVviewing. |
Interval: -14.55,11.43)
|
|
|
|
|
|
|
Latomme, et al.(2017) [35] |
4-6 |
Cluster 2434 RCT |
Health education for parents, and children, |
Kindergartens received and classroom environment. Follow-upwas
done. |
Computer/ video- regular schooling curriculum. The
interventionmaterial after completion of the intervention. |
Intervention group: Lessergames use on week-day and weekend. |
accentuation in computer/ video-games uses on weekday
in (+5.48 minutes/day) whereas control group (+8.89
minutes/day). Intervention group on weekend, (+9.46 minutes/
day) whereas, control(+15.43 minutes/day)
|
|
|
|
|
|
New Zealand |
Skouteris, et al. (2015) [45] |
2-4
|
RCT |
104 |
Parents and children attended weeklyworkshops on nutrition, PA
and behaviors, including guided active play, and healthysnack
time. Follow-up was done. |
The parents did not receive any health information. They were
given the intervention package after the completion of the study
duration. |
Nutrition, PA, and behaviors, alongwith ST.
|
-10.3 minutes/day (SE=8.2, Interval: -26.37, 5.77)
|
|
USA (n=8) |
Fitzgibbon, et al.(2011) [42] |
2-5 |
RCT |
618 |
The intervention delivered by classroomteachers. Diet plan, and
health educationfor teachers and parents. Social
cognitivetheory, and self-determination theory. No follow-up was
done.
|
Parents received information upon generalhealth concepts.
|
PA, nutrition and total ST.
|
-27.8 minutes/day (SE =13.92, Interval: -55.8, -0.52)
|
|
|
|
|
|
Fitzgibbon, et al. (2013) [43]Foster, et al. |
2-5 |
RCT |
157 |
School-based and family-based components used. Social cognitive
Theory, Health Belief Model and Self-determination theory.
Follow-up was done. Community meetings, parent health
|
Parents received information upon general health
concepts.Parent-child dyads
|
BMI and ST.ST, BMI, |
15.6 minutes/day (SE 25.71, Interval: -34.79, 65.99) The
intervention group showed
|
|
|
|
|
|
(2015) [41] |
2-5 |
RCT |
|
education, and consultations along withfollow-up. |
attended community meetings. They got the EatPlayGrowTM
curriculum to teach healthy habits. |
child’s growth, nutrition, andquality of life.
|
decreasing ST from a mean of 3.3 hours/day
(Interval: 2.3, 4.2) at 6 months to 2.1 hours/day
(Interval: 1.5, 2.7) at 12-month follow-up.
|
|
|
|
|
|
Taveras, et al. (2011) [33] |
3-5 |
Cluster 475RCT |
Family counselling, health education, |
Children received usualmotivational interviewing, and small
incentives. Chronic care model. No follow-up was done. |
Total TV/video pediatric care according to the current
standards of care. |
-21.6 minutes/day (SE 8.41,viewing, TV in thebedroom, BMI,
food frequency, food consumption, anthropometrics and PA. |
Interval: -38.8, -5.12)
|
|
|
|
|
|
|
|
Zimmerman,et al. (2011) [31] |
3-53-5 |
PilotRCT
|
|
Families written materials and four monthly newsletters, phone
or email, parents encouraged their children, and the research
staff encouraged the parents. Social cognitive theory and
behavior change model was used. No follow-up was done. |
The parents received cues of promotion of their child’s safety
in several areas. These were not specific to DM. |
A significant reduction in commercial content viewing
(29 minutes/day [-4.6-63], and positively changed out-come
expectations.
|
-37.1 minutes/day (SE 16.9, Interval: -68.64, -5.56)
|
|
|
|
|
|
|
|
|
Mendoza, et al. (2016) [36] |
3-5 |
ClusterRCT |
160 |
Curriculum for students in the classroom,and staff training on
the day program usingthe Social Cognitive Theory. |
Parents received information upon generalhealth concepts. |
TV viewing and sedentary time. |
-25.3 minutes/day (Interval - 45.2, -5.4)
|
|
|
|
Knowlden, et al. (2015) [39] |
4-6 |
RCT |
57 |
Group-by-time interaction was detectedfor child fruit and
vegetable consumptionusing Social cognitive theory. Telephone
counselling and online surveys were conducted. |
The parents received a knowledge-based program. It incorporated
edu-cational sessions for parents on child development.
Telephone counselling and online surveys were conducted. |
Child PA, sugar-free beverage consum-ption, and ST. |
-0.3 minutes/day (SE=13.3, Interval: -26.37, 25.77)
|
|
|
|
|
|
|
|
|
Epstein, et al. (2008) [37] |
4-7 |
RCT |
70 |
Weekly time budgets for media use, and alternatives to sedentary
behavior, monthly newsletter, TV allowance, parental skills, and
rewards for children. No follow-up was done. |
Children received freeaccess to TV, computersand money for
partici- pating in the trial. The parents received general
parenting tips. |
Mean TV viewing,and computer games weekdayand
weekend.
|
In the control group, the mean (SD) number of hours
of ST decreased by 5.2 (11.1) hours/ week whereas, in
intervention group declined by 17.5 (7.0) hours/week;
remained about the same at 24 months. |
|
|
|
|
|
ST: screen-time; TV: television; RCT: randomized control trial; PA: physical activity; BMI: body mass index.
Burden of Problem
The results of 14 cross-sectional studies for
estimating the prevalence are summarized in Table I.
Prevalence of excess screen time varies from 10% to 93.7% across the
high-income countries, and 21% to 98% in the middle-income countries.
Four out of 14 cross-sectional studies considered screen time more than
2 hours per day as excessive [4,17,19,20], six used screen time more
than >1 hour per day as excessive [6,8,11,14,16,24], whereas three
studies reported average screen time [7,12,14,18]. Overall, the screen
time ranged from 0.1-5 hours per day among under-fives. Younger children
(0-2 years) from the middle-income countries [26] and older ones (0-5
years) from the high-income countries [14] had screen time of >1 hour
per day. The maximum duration of screen time was reported among 3-5
years old children in home-based care [16,23]. Four studies [4,15,20,24]
reported a higher prevalence of screen time of >1 hour per day during
weekends (25% to 63%), as compared to weekdays (10% to 48%). All the
studies measured screen time while watching TV, which was perferred over
other digital-media devices [11,12,14,15,17,19-21,24]. Three studies
also reported the average screen time from using smartphone [17,20,24]
and five studies on computer usage [11,12,14,15,19,21] separately or
along with the TV. However, they have not documented the screen time of
these gadgets separately, and have provided the aggregated time.
The differences in the prevalence rate of excessive
screen time among under-fives can also be attributed to the associated
factors like, digital-media environment [14,17,18,23], parental
behaviors [1,4,12–14,17] and government regulations [2,48–50]. The
preference of TV over other digital-media devices is evident among
under-fives [11,12,14,15,17,19–21,24]. A systematic review reported that
computers are preferred by older children [5]. All the studies have
reported screen time through watching TV; in addition, a pevious [19]
and some recent studies have measured screen time on using computers,
smartphone, iPad, or hand-held games [7,11,12,17,24]. However, the
screen time from watching TV far exceeds than that from new-age gadgets.
Earlier the device is introduced, there is an increased propensity to
exaggerated use with an increase in age [8,24,26].
Factors Associated with Increased Screen Time
Twenty-eight studies including 14 cross-sectional
studies, 11 overlapping studies, 3 systematic reviews [1,3,4,6–30] and
one guideline [2] were reviewed to document the factors associated with
screen time. A systematic review identified 36 correlates of children
(0-8 years) specifically with mobile screen exposure [29]. Another
review identified 33 correlates in children under the age of three years
[30]. Both these systematic reviews have used bio-ecological model to
explain various correlates at five levels: (i) child biological
and demograpic factors; (ii) family biologic and demographic
factors; (iii) family structure; (iv) behavioral factors;
and (v) socio-cultural/environmantal factors. These reviews
reported the associations with screen time to be either positive,
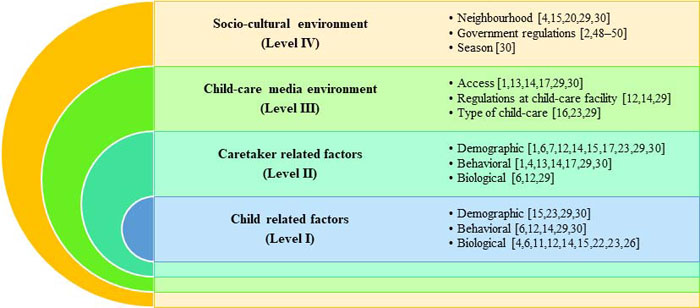
negative or none. We have used the social ecological model
[10,19] to explain all the 40 factors (23 from 28 studies and 17
additional factors from systematic reviews) to be associated with
digital-media exposure among children at four levels. As per this model,
there is an interplay (bidirectional) of the factors affecting the
behaviors at four levels including intrapersonal level (child-related
factors), interpersonal level (caregiver-related factors), immediate
environmental level (child care environment) and macro-environment level
(socio-cultural environment) [12,14,30]. We have clubbed the child and
family level behavioral factors with child and family factors,
respectively (Fig. 2).
 |
|
Fig. 2 The interactions of associated
factors and correlates of screen-time among under-five children
using the Social-Ecological model.
|
Intrapersonal: Child-related Factors
At intrapersonal level, the factors associated with
digital-media exposure include child’s demographic, behavioral and
biological factors. As the child grows older, his screen time
accentuates [4,6,11,14,26]. Hyperactivity-inattention [6], daily sleep
duration, and sedentary preferences [12] were found to be positively
associated with a child’s digital-media exposure. Boys were more
hyperactive [6] and watching more screens [14] in comparison to girls.
However, three studies did not report any gender-based differences in
screen time [11,12,23]. Another study concluded that the child’s
demographic factors [23] have no associations with child’s digital media
exposure.
Interpersonal: Caregiver-related Factors
These factors play a role during interactions between
the parent/caregiver and the child. Paternal age [12], time spent on
work by mothers [22], maternal stress [1,30], parental screen time
[1,4,13,14,17,29,30], mother’s place of delivery [1,15], and shorter
breastfeeding [30] were positively related to child’s screen time.
Children of first-time mothers had increased in screen time [1].
Parental income [14], parent’s occupation [29], socioeconomic status of
the family [6,15], maternal ethnicity [12], maternal body mass index
[30], decreased level of education [7,14] and physical activity [29] of
the parents’/caregivers were negatively associated with average
digital-media exposure of the child. Parents’ perceptions [1,17],
attitudes, beliefs towards the importance of digital-media exposure and
the amount of time they spent with the child [29] played a pivotal role
in a child’s digital-media exposure. Mother’s relational and personal
well-being, parent’s sex, country of birth [29], and cognitive
stimulation at home [30] were also associated with child’s screen time.
However, there were no associations reported with parental demographic
characteristics [23], ethnicity of the family [17,23], two-parent
household, number of children at home, or non-parental child-care [30].
Immediate Environment
Digital media micro-environment
The digital-media micro-environment is the home
environment within which the family lives i.e., the micro
digital-ecosystem of the house. The access to digital-media gadgets
[13,14,17,29,30], screen time rules at home [12,14], TV switched-on in
the background at home [1,14,17], home-based care [16,23], parenting
skills [14], computers placed outside the child’s bedroom and TV on
during dinner [29], infant crying duration and heavy TV use [30] are
positively related to digital-media exposure in children. Parental
self-efficacy [12], and type of care [29] were negatively associated
with screen time of the child. The TV time/content restrictions had no
association with the child’s screen time [30].
Digital media macro-environment
The socio-cultural, geographical and environment
factors are the macro-environmental factors that affect the
digital-media usage of the family. These represent the macro
digital-ecosystem of the community surrounding the house. Interactions
at the macro-digital ecosystem cannot be controlled and may vary from
region-to-region. The place of residence [4,15,20,29,30], season
(winter) [30] and the government services that are available in that
area [2] affect the digital media exposure of the children. A study
reported that boys of rural areas had higher screen time than in the
urban areas [20]. Another study reported that it was higher among girls
belonging to lower socioeconomic status as compared to those of higher
status [15].
Consequences of Increased ST
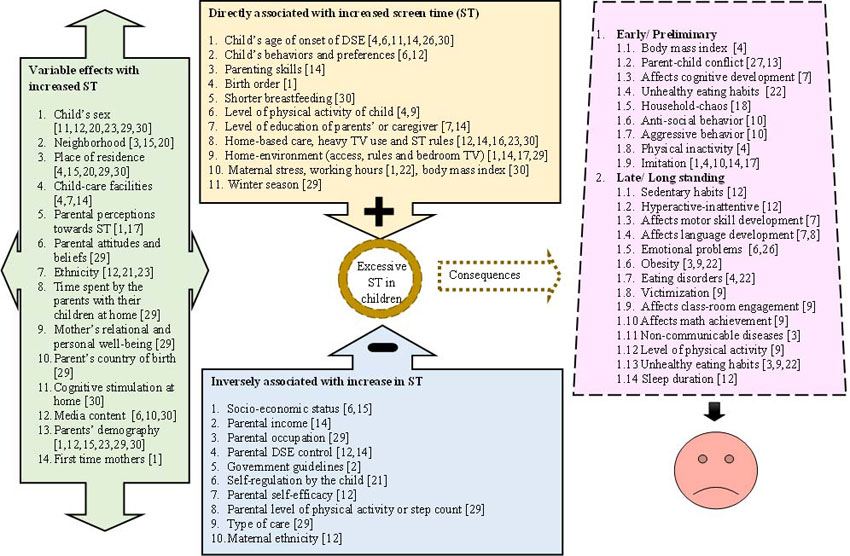
The consequences of augmented screen time may be
early/preliminary and late/long-standing [1,4,6-12,14-26,28] as shown in
Fig. 3. Early consequences are considered as those
that are reported during under-five development period among infants,
toddlers and preschoolers; and late are those that are reported after
this period.
 |
|
Fig. 3 Associations and consequences
of excessive screen time in under-five children.
|
The watching of indiscriminate media content [9],
especially if unsupervised [2], might hamper a child’s behavioral
outcomes. Moreover, restricting children in one position for >1 hour has
additional negative health outcomes [2]. Sedentary behaviors related to
screen time among children might be induced by the parents [1,12,18] as
they are the role models for the children [1,4,12], or due to the
parents’ perceptions about the importance of screen time [12,14,26],
physical environment-induced (access, presence of bedroom TV, number of
gadgets at home etc.) [1,4,12,14,15,17,20]. However, it is reported that
not all digital media is bad as a child’s level of physical activity
[47], skill development [28], gain in knowledge [21] early learning,
cognitive and functional development [10] improved with specific
contingent videos. American Academy of Pediatrics 2016 guidelines [2]
reinforce that one-to-one interaction may, in turn, lead to improved
parent-child engagement, and quality of social interaction for healthy
development.
Early Consequences
The child’s frequency of TV watching was found to be
significantly associated with delayed motor skills, cognitive [7] and
language [7,8] development. The content of TV has a detrimental effect
on cognitive development [7]. A Japanese study observed that children
aged 30 months, had increased chances of being hyperactive/inattentive
due to excessive TV-viewing [6]. Augmented digital media usage leads to
reduced sleep, which in turn leads to increased TV exposure that seems
to have a wider impact on the sleep quality [12]. Greater household
chaos leading to excessive screen time is also related to disrupted
nighttime sleep [18]. An Indian study reported a delay in achieving
cognitive milestones of children (below 2 years) with respect to digital
media exposure [25]. There are less parent-child interactions [27] and
increased chances of conflicts [13] when the parents’ attention is
absorbed. Children try to mimic their parental screen time behaviors
[1,4,14,17] and/or the programs they watch on screens [10]. Child’s
aggressive [6,10] and antisocial behaviors [10] are related to augmented
screen time. Due to a lack of positive role models, and indiscriminate
watching of media content, children might have behavioral problems [10].
Late Consequences
Long-standing consequences of digital media use
predict worsened behavioral outcomes in the children when they grow
older [26]. Development path of the children exposed to excessive
digital-media may lead to unhealthy adolescence [9]. In the school, they
are less likely to get engaged, and may be prone to victimization [9].
Children with accentuated screen time have a predominantly higher
prevalence of overweight [22], obesity [19] and NCDs [3].
Intervention Strategies
The setting for delivering the interventions was
mainly at family [31,32,35-37,39,43,44], and/or home level
[31,38,40,43-45], with a few at school [34,35,41,42,46], or clinic-
[39,43], or community-level [33]. Most of the interventions were based
on behavior change theories such as; social cognitive theory
[31,32,34,35,38,42,44], social determination theory [34,35] family
systems theory [32], social ecological model [36], health belief model
[35], chronic care model [39], attitude social influence self-efficacy
model, precaution process model, elaboration likelihood model, the
stages of change model [40] or none [33,37,41,43,46]. The intervention
packages specifically focused on increasing the information related to
digital-media, by holding counseling sessions or using educational
material. Educational materials were mostly shared with parents
[31-33,36-41,43,45], followed by teachers [34,35,42,46] children [37,46]
and community members [33]. Seven studies had focused primarily on
screen time reduction [31,32,38,39,41-43], and six studies
[33,35-37,40,41] additionally included a follow-up with the participants
post-intervention to assess the adherence to the intervention. Some
studies had interventions to increase the physical activity
[34,37,40,45,46] and reduce the sedentary time [42], body mass index
[33,35,36,44,46], sedentary behavior [42,44], violent behaviors, tobacco
smoking, [44], and modify the eating behaviors of children
[33,34,37,45,46]. The reduction in screen time among under-five children
varied from 0.3 (SE=13.3) minutes to 47.16 (SE=2.01) minutes in the
high-income countries. The most effective intervention strategy was
theory-based and delivered at the family level [44]. The child’s
knowledge regarding engagement in screen-based activities
[31,34-36,42,43,45,46], home-based rules regarding TV turnoff time [38],
and the alternatives used by parents for reducing digital-media use had
a significant effect on reducing the screen time. The comparator group
in most of the studies received the usual health care services except in
two studies, where session on media use were held and national
guidelines on media use among children were shared. [33,45] .
Intervention studies to reduce screen time has been
reported from high-income countries only [31-46]. (Web Table
II). There is no published intervention studies from LMICs. The
intervention strategy of utilizing a child’s knowledge to engage in
sedentary behavior [31,34-36,42,43,45,46] was found to be effective in
reducing the excessive ST. Also, primary caretaker’s role to mediate
[31,33,36-41,43,44] the digital media exposure among children was
central in regulating the screen time.
Conclusions
The results of this review have highlighted that
there is a high prevalence of excessive screen time among under-five
children in the high - and middle-income countries. There are several
health impacts of excessive screen time including emotional, sleep,
behavioral issues impairing the growth and cognitive development of
under-five children. Most of the high-income countries have made
guidelines for limiting the excessive digital-media usage for all age
groups including Canada [48], Australia [50], and Itlay [49] while,
several LMICs have no such guidelines. The findings of this review might
be useful for the policymakers in formulating such guidelines in these
countries.
Based upon the results of this review, we recommend
that pediatricians should explore the history of screen time from the
parents of all under-five children visiting them in the clinics and
about the digital-media home environment, and advise to not to use
digital gadgets for children less than 2 years and limit it to one hour
for children age 2-5 years. The policy-makers and associations like
Indian Academy of Pediatrics should formulate guidelines on permissible
limits of screen time among children. As, there is a paucity of data on
the prevalence of screen time among under-fives from LMICs, such studies
should be planned to understand the cultural context of screen time use
in these settings. Also, culturally appropriate interventions to reduce
the same in the LMICs should be designed. Such studies are of utmost
importance considering the worsening mental [5-7,10] and physical health
of children [4,5,9], and to prevent NCDs.
Acknowledgement: Dr. Kamal Kishore,
Lecturer, Department of Biostatistics, PGIMER for providing technical
inputs in the methods of this review.
Contributors: MG: contributed to the methods and
discussion section; NK, MG: jointly conceived the idea; NK, MG, SG, PM:
assessed the studies for inclusion in the review; NK, MG: extracted the
data; SG, PM: contributed in describing the related text of the studies;
NK: wrote the first draft of the manuscript. All the authors provided
technical inputs to improve the intellectual content of the manuscript
and approved the final version of manuscript.
Funding: None; Competing interest: None
stated.
References
1. Barber SE, Kelly B, Collings PJ, Nagy L, Bywater
T, Wright J. Prevalence, trajectories, and determinants of television
viewing time in an ethnically diverse sample of young children from the
UK. Int J Behav Nutr Phys Act. 2017;14:88-99.
2. Reid Chassiakos Y, Radesky J, Christakis D, Moreno
MA, Cross C. Children and adolescents and digital media. Pediatrics.
2016;138:e20162593-e.
3. Pearson N, Biddle SJH. Sedentary behavior and
dietary intake in children, adolescents, and adults. Am J Prev Med.
2011;41:178-88.
4. Kourlaba G, Kondaki K, Liarigkovinos T, Manios Y.
Factors associated with television viewing time in toddlers and
preschoolers in Greece: The GENESIS study. J Public Health.
2009;31:222-30
5. Davey S, Davey A. Assessment of smartphone
addiction in Indian adolescents: A mixed method study by
systematic-review and meta-analysis approach. Int J Prev Med.
2014;5:1500-11.
6. Cheng S, Maeda T, Yoichi S, Yamagata Z, Tomiwa
K; Japan Children’s Study Group. Early television exposure and
children’s behavioral and social outcomes at age 30 months. J Epidemiol.
2010;20:S482-9.
7. Lin LY, Cherng RJ, Chen YJ, Chen YJ, Yang HM.
Effects of television exposure on developmental skills among young
children. Infant Behav Dev 2015;38:20-6.
8. Byeon H, Hong S. Relationship between television
viewing and language delay in toddlers: evidence from a Korea national
cross-sectional survey. PLoS One. 2015;10:e0120663.
9. Pagani LS, Fitzpatrick C, Barnett TA, Dubow E.
Prospective associations between early childhood television exposure and
academic, psychosocial, and physical well-being by middle childhood.
Arch Pediatr Adolesc Med. 2010;164:425-31.
10. Carson V, Janssen I. Associations between factors
within the home setting and screen time among children aged 0-5 years: a
cross-sectional study. BMC Public Health. 2012;12:539.
11. Carson V, Spence JC, Cutumisu N, Cargill L.
Association between neighborhood socioeconomic status and screen time
among pre-school children: a cross-sectional study. BMC Public Health.
2010;10:367.
12. Christakis DA, Garrison MM. Preschool-aged
children’s television viewing in child care settings. Pediatrics.
2009;124:1627-32.
13. Asplund KM, Kair LR, Arain YH, Cervantes M,
Oreskovic NM, Zuckerman KE. Early childhood screen time and parental
attitudes toward child television viewing in a low-income latino
population attending the special supplemental nutrition program for
women, infants, and children. Child Obes. 2015;11:590-9.
14. Emond JA, Tantum LK, Gilbert-Diamond D, Kim SJ,
Lansigan RK, Neelon SB. Household chaos and screen media use among
preschool-aged children: A cross-sectional study. BMC Public Health.
2018;18:1210.
15. Fulton JE, Wang X, Yore MM, Carlson SA, Galuska
DA, Caspersen CJ. Television viewing, computer use, and BMI among U.S.
children and adolescents. J Phys Act Health. 2009;6:S28-35.
16. Lee ST, Wong JE, Ong WW, Ismail MN, Deurenberg P,
Poh BK. Physical Activity Pattern of Malaysian Preschoolers:
Environment, Barriers, and Motivators for Active Play. Asia Pacific J
Public Health. 2016;28:21S–34S.
17. Wu CST, Fowler C, Lam WYY, Wong HT, Wong CHM,
Loke AY. Parenting approaches and digital technology use of preschool
age children in a Chinese community. Italian J Pediatr. 2014;40:44.
18. Hinkley T, Salmon J, Okely AD, Crawford D,
Hesketh K. Preschoolers’ physical activity, screen time, and compliance
with recommendations. Med Sci Sport Exerc. 2012;44:458-65.
19. Downing KL, Hinkley T, Salmon J, Hnatiuk JA,
Hesketh KD. Do the correlates of screen time and sedentary time differ
in preschool children? BMC Public Health. 2017;17:285.
20. Jago R, Stamatakis E, Gama A, Carvalhal IM,
Nogueira H, Rosado V, et al. Parent and child screen-viewing time
and home media environment. Am J Prev Med. 2012;43:150-8.
21. Brown JE, Broom DH, Nicholson JM, Bittman M. Do
working mothers raise couch potato kids? Maternal employment and
children’s lifestyle behaviours and weight in early childhood. Soc Sci
Med. 2010;70:1816-24.
22. Tandon PS, Zhou C, Lozano P, Christakis DA.
Preschoolers’ total daily screen time at home and by type of child care.
J Pediatr. 2011;158:297-300.
23. Chang HY, Park E-J, Yoo H-J, Lee JW, Shin Y.
Electronic media exposure and use among toddlers. Psychiatry Investig.
2018;15:568-73.
24. Verma S, Suman N, Verma P. Effect of electronic
gadgets on cognitive milestones of children below 2 years of age.
International Archives of Integrated Medicine. 2018;5: 52-4.
25. Ruangdaraganon N, Chuthapisith J, Mo-suwan L,
Kriweradechachai S, Udomsubpayakul U, Choprapawon C. Television viewing
in Thai infants and toddlers: Impacts to language development and
parental perceptions. BMC Pediatr. 2009;9:34.
26. Kirkorian HL, Pempek TA, Murphy LA, Schmidt ME,
Anderson DR. The impact of background television on parent-child
interaction. Child Dev. 2009;80:1350-9.
27. Russo-Johnson C, Troseth G, Duncan C, Mesghina A.
All tapped out: Touchscreen interactivity and young children’s word
learning. Front Psychol. 2017;8:578.
28. Kirkorian HL, Choi K, Pempek TA. Toddlers’ word
learning from contingent and noncontingent video on touch screens. Child
Dev. 2016;87:405-13.
29. Paudel S, Jancey J, Subedi N, Leavy J. Correlates
of mobile screen media use among children aged 0-8: a systematic
review. BMJ Open. 2017;7:e014585.
30. Duch H, Fisher EM, Ensari I, Harrington A. Screen
time use in children under 3 years old: A systematic review of
correlates. Int J Behav Nutr Phys Act. 2013;10:102.
31. Zimmerman FJ, Ortiz SE, Christakis DA, Elkun D.
The value of social-cognitive theory to reducing preschool TV viewing: A
pilot randomized trial. Prev Med (Baltim). 2012;54:212-8.
32. Hinkley T, Cliff DP, Okely AD. Reducing
electronic media use in 2–3 year-old children: feasibility and efficacy
of the Family@play pilot randomised controlled trial. BMC Public Health.
2015;15:779.
33. Taveras EM. Randomized Controlled Trial to
Improve Primary Care to Prevent and Manage Childhood Obesity. Arch
Pediatr Adolesc Med. 2011;165:714-22.
34. van Grieken A, Renders CM, Veldhuis L, Looman CW,
Hirasing RA, Raat H. Promotion of a healthy lifestyle among 5-year-old
overweight children: health behavior outcomes of the ‘Be active, eat
right’ study. BMC Public Health. 2014;14:59.
35. Latomme J, Cardon G, De Bourdeaudhuij I, Iotova
V, Koletzko B, Socha P, et al. Effect and process evaluation of a
kindergarten-based, family-involved intervention with a randomized
cluster design on sedentary behaviour in 4- to 6- year old European
preschool children: The ToyBox-study. PLoS One. 2017;12:e0172730.
36. Mendoza JA, Baranowski T, Jaramillo S, Fesinmeyer
MD, Haaland W, Thompson D, et al. Fit 5 kids TV reduction program
for latino preschoolers. Am J Prev Med. 2016;50:584-92.
37. Epstein LH, Roemmich JN, Robinson JL, Paluch RA,
Winiewicz DD, Fuerch JH, et al. A randomized trial of the effects
of reducing television viewing and computer use on body mass index in
young children. Arch Pediatr Adolesc Med. 2008;162:239-45.
38. Yilmaz G, Demirli Caylan N, Karacan CD. An
intervention to preschool children for reducing screen time: A
randomized controlled trial. Child Care Health Dev. 2015;41:443-9.
39. Knowlden AP, Sharma M, Cottrell RR, Wilson BRA,
Johnson ML. Impact evaluation of enabling mothers to prevent pediatric
obesity through web-based education and reciprocal determinism (EMPOWER)
randomized control trial. Health Educ Behav. 2015;42:171-84.
40. Puder JJ, Marques-Vidal P, Schindler C, Zahner L,
Niederer I, Burgi F, et al. Effect of multidimensional lifestyle
intervention on fitness and adiposity in predominantly migrant preschool
children (Ballabeina): Cluster randomised controlled trial. BMJ.
2011;343:d6195.
41. Foster BA, Aquino C, Gil M, Flores G, Hale D. A
randomized clinical trial of the effects of parent mentors on early
childhood obesity: Study design and baseline data. Contemp Clin Trials.
2015;45:164-9.
42. Fitzgibbon ML, Stolley MR, Schiffer LA,
Braunschweig CL, Gomez SL, Van Horn L, et al. Hip-Hop to Health
Jr. Obesity Prevention Effectiveness Trial: Post intervention results.
Obesity (Silver Spring). 2011;19:994-1003.
43. Fitzgibbon ML, Stolley MR, Schiffer L, Kong A,
Braunschweig CL, Gomez-Perez SL, et al. Family-based hip-hop to
health: Outcome results. Obesity (Silver Spring). 2013;21:274-83.
44. Haines J, McDonald J, O’Brien A, Sherry B,
Bottino CJ, Schmidt ME, et al. Healthy habits, happy homes:
randomized trial to improve household routines for obesity prevention
among preschool-aged children. JAMA Pediatr. 2013;167:1072-9.
45. Skouteris H, Hill B, McCabe M, Swinburn B, Busija
L. A parent-based intervention to promote healthy eating and active
behaviours in pre-school children: Evaluation of the MEND 2-4 randomized
controlled trial. Pediatr Obes. 2015;11:4-10.
46. Birken CS, Maguire J, Mekky M, Manlhiot C, Beck
CE, DeGroot J, et al. Office-based randomized controlled trial to
reduce screen time in preschool children. Pediatrics. 2012;130:1110-5.
47. Peng W, Crouse JC, Lin J-H. Using active video
games for physical activity promotion: A systematic review of the
current state of research. Health Educ Behav. 2013;40: 171-92.
48. Tremblay MS, LeBlanc AG, Carson V, Choquette L,
Connor Gorber S, Dillman C, et al. Canadian Sedentary Behaviour
Guidelines for the Early Years (aged 0-4 years). Appl Physiol Nutr Metab.
2012;37:370-80.
49. Bozzola E, Spina G, Ruggiero M, Memo L,
Agostiniani R, Bozzola M, et al. Media devices in pre-school
children: The recommendations of the Italian Pediatric Society. Ital J
Pediatr. 2018;44:69.
50. Department of Health and Aging. Get up and Grow:
Healthy Eating and Physical Activity for Early Childhood. Canberra, ACT:
Australian Government; 2010. Available from:http://www.health.gov.au/internet/main/publish
ing.nsf/Content/health-pubhlth-strateg-phys-act-guide lines#npa05.
Accessed March 20, 2019.
|
|
|
 |
|
