|
|
|
Indian Pediatr 2016;53: 781 -785 |
 |
Prediction Equations for Spirometry for
Children from Northern India
|
|
Sunil K Chhabra, *Rajeev
Kumar and Vikas Mittal
From Department of Pulmonary Medicine, Vallabhbhai
Patel Chest Institute, and *Department of Biostatistics and Medical
Informatics, University College of Medical Sciences; Delhi, India.
Correspondence to: Prof SK Chhabra, Department of
Pulmonary Medicine, Vallabhbhai Patel Chest Institute, University of
Delhi, Delhi 110 007, India.
Email: [email protected]
Received: December 15, 2015;
Initial review: March 30, 2016;
Accepted: July 09, 2016.
|
Objective: To develop prediction
equations for spirometry for children from northern India using current
international guidelines for standardization.
Design: Re-analysis of
cross-sectional data from a single school.
Participants: 670 normal children
(age 6-17 y; 365 boys) of northern Indian parentage.
Methods: After screening for
normal health, we carried out spirometry with recommended quality
assurance according to current guidelines. We developed linear and
nonlinear prediction equations using multiple regression analysis. We
selected the final models on the basis of the highest coefficient of
multiple determination (R2) and statistical validity.
Main outcome measures: Spirometry
parameters: FVC, FEV1, PEFR, FEF50, FEF75 and FEF25-75.
Results: The equations for the
main parameters were as follows: Boys, Ln FVC =
-1.687+0.016*height +0.022*age; Ln FEV1 = -1.748+0.015*height+0.031*age.
Girls, Ln FVC = -9.989 +(2.018*Ln(height)) + (0.324*Ln(age)); Ln FEV1 =
-10.055 +(1.990*Ln(height))+(0.358*Ln(age)). Nonlinear regression
yielded substantially greater R2 values compared to linear models except
for FEF50 for girls. Height and age were found to be the significant
explanatory variables for all parameters on multiple regression with
weight making no significant contribution.
Conclusions: We developed
prediction equations for spirometry for children from northern India.
Nonlinear equations were superior to linear equations.
Keywords: Forced expiratory flow rates, Forced
expiratory volume, Forced vital capacity, Regression analysis, Pulmonary
function tests, Spirometry.
|
|
S
pirometry is the most frequently performed
pulmonary function test for management of diseases affecting the lungs
[1]. Unlike most other laboratory parameters that have fixed normal
values for all children in population, there are none for spirometry.
Normal expected values in a given child are calculated from age and
physical measurements using prediction equations developed in studies on
normal healthy subjects. The values of parameters measured in a patient
are compared with these expected normal values (labelled as predicted)
and, if found less than the lower limits of normal, are considered as
abnormal or reduced. Correct interpretation mandates that data of Indian
children be compared with prediction equations developed in healthy
Indian population [1]. Though several equations have been developed from
time-to-time for children in different regions of India [2-9], most of
these are now outdated and have limited utility due to technological
advances in equipment and revisions in methodology. No equations have
been developed in India following the last revision of the American
Thoracic Society-European Respiratory Society (ATS-ERS) spirometry
guidelines [10].
Recently, we presented linear regression equations
for spirometry for children of northern Indian origin [11].
However, the increase in lung function with age is
non-linear due to the pubertal spurt in height [12,13], and non-linear
prediction equations may, therefore, be physiologically more
appropriate. The currently recommended equations for Caucasian children
in the United States (US) and Europe are non-linear [14,15]. Therefore,
in this study, we reanalyzed our data to examine if nonlinear models
offered an advantage and compared our predictions with those by
Caucasian and previously published Indian equations.
Methods
The study was approved by the Institutional Ethics
Committee. The methodology has been described in detail in our earlier
communication [11]. The study was carried out in normal healthy children
between the ages 6 to 17 years in a school selected randomly from a list
of schools in Delhi. For multiple linear regression, the recommended
minimum sample size was 74, considering three independent variables
(age, height and weight) Further, anticipating that technically
acceptable spirometry may not be obtained in all, we kept a target of 15
to 20 boys and girls for each age. A written informed consent was
obtained from parents.
In view of substantial differences in lung function
among adults in different regions of India documented by us and other
authors previously [17,18], we restricted the inclusion to children with
both parentage of northern Indian plains. Normal health was defined
using the criteria proposed by the ATS [19] and confirmed by examination
by one of the authors. We excluded children with any chronic chest or
other systemic disease recent or current respiratory infection or other
acute illness, body mass index <85th percentile for children of the same
age and sex, any active smoking or environmental tobacco smoke exposure
at home, or inability to perform technically acceptable spirometry.
After recording age, height and weight, we performed
spirometry using a calibrated heated Pneumotach spirometer (Micro 5000,
Medisoft, Belgium) with recommended quality assurance according to
current guidelines on methodology [10]. We included only those children
who provided at least three acceptable and two repeatable efforts. We
measured the following parameters for developing prediction equations:
highest values of forced vital capacity (FVC), forced expiratory volume
in the 1 second (FEV1) and peak expiratory flow rate (PEFR); expiratory
flow rates obtained from the best curve, i.e. the one with the
highest sum of FVC and FEV1: forced expiratory flow rate at 50% and 75%
exhalation of vital capacity (FEF50 and FEF75) and mean forced
expiratory flow rates over the middle 50% of the vital capacity
(FEF25-75).
Statistical analysis: Statistical analysis was
carried out using SPSS 20.0 (SPSS Inc. Chicago, USA) and Graph Pad Prism
4.01 (Graph Pad Inc. USA) software. Data of male and female participants
were analyzed separately. Univariate regression was carried out to
identify significant predictors among height, age and weight for the
spirometry variables followed by multiple regression analysis. Both
linear and nonlinear models were examined. The independent variables
were entered into the prediction model in sequence if the R 2
improved substantially by more than 1%. Log or other transformations of
dependent and/or independent variables were carried out to obtain the
best model. Final models were selected on the basis of the highest
predictive capability (highest coefficient of multiple determination, R2)
and compliance with the requirements of valid regression analysis
i.e. independence of predictors, homoscedasticity, and normal
distribution of residuals.
Results
Acceptable flow-volume curves were obtained in 365
boys and 305 girls. The demographic characteristics of the study
population were described in detail in our earlier communication [11].
The mean (SD) ages and the anthropometric data in boys and girls,
respectively were: age (y), 11.74 (3.23) and 11.53 (3.37) (P>0.05);
height (m) 1.45 (0.14) and
1.49 (0.18) (P<0.01);
weight (Kg) 40.97 (13.82) and
44.56 (18.42)
(P<0.01).
TABLE I Prediction Equations for Spirometry Parameters in Boys and Girls
|
Parameter |
Equation |
SEE |
R2 (current equations) |
R2 (linear equations)12 |
|
Boys |
|
|
|
|
|
Ln FVC |
-1.687+0.016*ht+0.022*age |
0.111 |
0.92 |
0.87 |
|
Ln FEV1 |
-1.748+0.015*ht+0.031*age |
0.115 |
0.91 |
0.86 |
|
Ln PEFR |
-0.319+0.009*ht+0.051*age |
0.131 |
0.87 |
0.79 |
|
Ln FEF50 |
-7.641+1.594*Ln(ht)+0.322*Ln(age) |
0.230 |
0.63 |
0.62 |
|
Ln FEF75 |
-2.008+0.011*ht+0.049*age |
0.327 |
0.56 |
0.49 |
|
Ln FEF25-75 |
-0.951+0.011*ht+0.035*age |
0.181 |
0.74 |
0.69 |
|
Girls |
|
|
|
|
|
Ln FVC |
-9.989+(2.018*Ln(ht))+(0.324*Ln(age)) |
0.117 |
0.87 |
0.84 |
|
or |
|
|
|
|
-7.669+1.411*Ln(ht)+0.305*ln(age)+ 0.205*Ln(wt) |
0.117 |
0.88 |
|
|
Ln FEV1 |
-10.055+(1.990*Ln(ht))+ (0.358*Ln(age)) |
0.115 |
0.87 |
0.85 |
|
Ln PEFR |
-6.341+(1.362*Ln(ht))+(0.469*Ln(age)) |
0.142 |
0.79 |
0.73 |
|
FEF50 |
-2.258+(0.027*ht)+(0.125*age) |
0.691 |
0.55 |
0.55 |
|
Ln FEF75 |
-9.139+(1.676*Ln(ht))+(0.468*Ln(age)) |
0.323 |
0.48 |
0.43 |
|
Ln FEF25-75 |
-7.89+(1.641*Ln(ht))+(0.317*Ln(age)) |
0.176 |
0.68 |
0.60 |
|
FVC: Forced vital capacity, FEV1: Forced expiratory volume
in the 1 second, PEFR: Peak expiratory flow rate, FEF50 and
FEF75: Forced expiratory flow rates at 50% and 75% exhalation of
vital capacity, FEF25-75: Mean forced expiratory flow
rates over the middle 50% of the vital capacity; Ln: natural
logarithm; Units of measurements: FVC (L), FEV1 (L), PEFR (L/s),
FEF50 (L/s), FEF75 (L/s) and FEF25-75 (L/s); Age in completed
years, height in cm and weight in Kg |
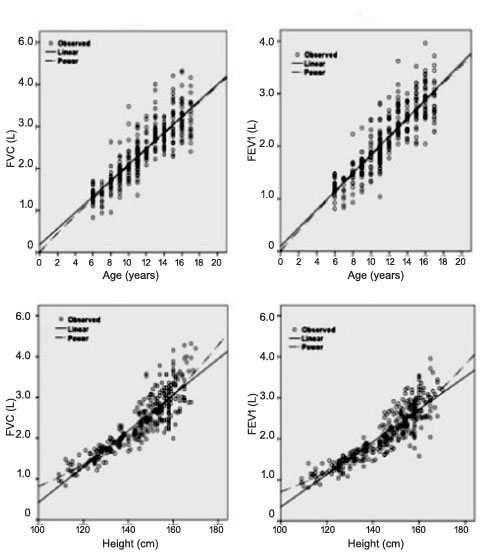
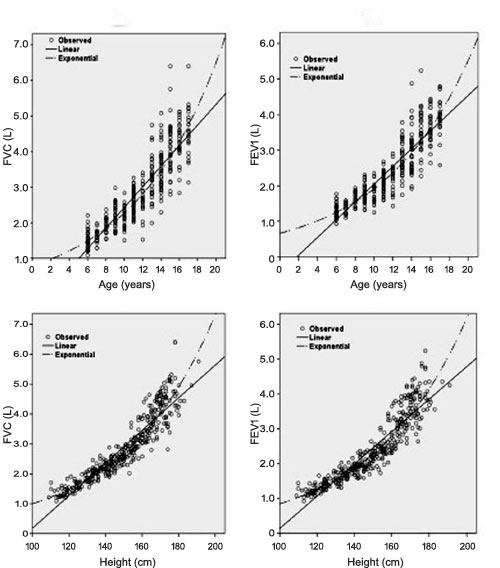
The results of linear and nonlinear regression of FVC
and FEV1 against age, height
and weight are shown in Web Table 1 and plots against age
and height with best-fitting regression lines in girls and boys are
shown in Fig. 1 and 2, respectively. Nonlinear
lines fitted the observed data better than linear. The final regression
equations for all parameters on multivariate analysis are presented in
Table I. Height and age were the significant predictors
for all parameters. Addition of weight did not result in significant
improvement in R2 for any
parameter except for FVC in girls where it
increased from 0.87 to 0.88. Both equations for FVC, with
and without the weight variable are shown. However, the predicted values
with the two equations were not significantly different. Nonlinear
regression yielded uniformly substantially greater R2
values compared to linear models except for FEF50 for girls where linear
equation was retained. The linear models for all other parameters were
also rejected because of non-normal distribution of residuals. No
statistically valid equation was developed for FEV1/FVC
ratio due to lack of significant relationship with any independent
variable.
 |
|
Fig. 1 Linear and nonlinear regression of FVC against
(a) age and (c) height, and of FEV 1
against (b) age and (d) height in girls.
|
 |
|
Fig. 2 Linear and nonlinear regression
of FVC against (a) age and (c) height, and of FEV 1
against (b) age and (d) height in boys.
|
Discussion
The present article presents prediction equations for
spirometry parameters for children of northern Indian origin between the
ages of 6 to 17 years. On multivariate regression analysis, height and
age were found to be the main determinants for all parameters in both
genders with weight not making any significant contribution to the
predictions. The presented equations are nonlinear, and we considered
these as superior to the linear equations published by us earlier [12],
with greater explained variance. In addition, the residuals were
normally distributed with nonlinear equations but not with linear
equations.
Most studies from India and other countries have
reported linear prediction equations for sake of simplicity and ease of
manual calculations [2-4,6-9,20,21]. However, the increase in FVC and
FEV1 through childhood is
nonlinear with the adolescent growth spurt causing an accelerated
increase [13,14]. This relationship was confirmed in our study.
Therefore, linear models may not be physiologically appropriate. Gupta,
et al. [5] reported that exponential models were not only
statistically valid but also fared better than the linear models in
Indian children. The equations currently recommended for Caucasian
children in the US [14] and Europe [15], and for Singaporean children
[22] are also nonlinear. We recommend the application of nonlinear
equations to interpret spirometry data in children because these are
physiologically appropriate, statistically valid and have a higher
explained variance compared to linear equations. Though nonlinear
equations are more difficult to compute manually, modern lung function
equipments are computerized and therefore this is not a limitation.
The present study has important clinical information
for pulmonologists and general pediatricians intending to carry out
spirometry in clinical practice and research. As interpretation of
measured spirometry data requires a comparison with expected or
predicted values in normal population, selection of the correct
prediction equations is a critical step [1]. The software of
computerized spirometers that are generally used in India usually do not
provide any Indian equations because the available ones [2-9,21] have
become outdated by current technological and methodological advances.
Therefore, equations for other populations, usually Caucasian, have to
be used as a substitute. Use of equations developed in other populations
is however not advisable for interpreting data of Indians as it is
likely to lead to substantial errors and thus adversely affect
management decisions [1,23].
This occurs because the Caucasian and Indian predictions
of normal values differ substantially. Interpretation algorithms for
spirometry are based on FVC and FEV1
[1,20] and the predictions for these by our equations are about 10% less
compared to the predictions by the US Caucasian equations [14].
Clinically significant errors in interpretation on using Caucasian
instead of Indian equations has been shown in adults [23]. The present
study thus addresses a long-felt unmet need in spirometry testing in
Indian children in clinical and research studies by providing prediction
equations that are appropriate for the local population. These equations
can now be incorporated in spirometry software.
The limitation of this study was that we restricted
our inclusion to northern Indian children. The equations developed by us
may or may not be applicable to other regions of India due to the
possibility of differences considering the diversity of India. It would
be desirable to update prediction equations for other regions as well in
a multicentric study using similar measurement protocols. Alternatively,
external validation studies of the equations developed by us would be
required in other regions before these may be applied more widely.
Moreover, a random selection from the whole population would be ideal
but is difficult for logistic and operational reasons and thus usually
not used for such studies. The current guidelines on spirometry have
found the convenient sampling strategy acceptable if the selection
criteria and the distribution of anthropometric characteristics remain
adequate [10].
In conclusion, we have presented prediction equations
for spirometry parameters for children of northern Indian origin using
the current standardized methodology. These equations address a
long-felt need and should be helpful in appropriate evaluation of
spirometry data in clinical and research studies.
Contributors: SKC: guarantor; conception,
design, drafting of the manuscript, critical revision of the manuscript
for intellectual content, analysis and interpretation of data’ final
approval of the manuscript, accountable for all aspects; RK: analysis
and interpretation of data, drafting of the manuscript, final approval
of the manuscript, accountable for all aspects; VM: Acquisition of data,
drafting of the manuscript, final approval of the manuscript,
accountable for all aspects.
Funding: Indian Council of Medical
Research; Competing interest: None stated
|
What is Already Known?
• Due to well-known differences in lung
function among populations, it is desirable to apply equations
developed in local population using standardized methodology for
proper Interpretation of spirometry data
What this Study Adds?
• The study presents new prediction equations
for spirometry parameters for children of northern Indian origin
using the current standardized methodology addressing a
long-felt unmet need and would be helpful in appropriate
evaluation of data in clinical and research studies.
|
References
1. Chhabra SK. Interpretation of spirometry:
Selection of predicted values and defining abnormality. Indian J Chest
Dis Allied Sci. 2014;57:91-105.
2. Jain SK, Ramiah TJ. Prediction of ventilatory
norms in healthy boys 7-14 years age. Indian J Med Res. 1967;55:69-79.
3. Vohra RS, Shah SC, Shah GS. Pulmonary functions in
normal children. Indian Pediatr. 1984;21:785-90.
4. Malik SK, Jindal SK. Pulmonary function tests in
healthy children. Indian Pediatr. 1985;22:677-81.
5. Gupta CK, Mishra G, Mehta SC, Prasad J. On the
contribution of height to predict lung volumes, capacities and diffusion
in healthy schoolchildren of 10-17 years. Indian J Chest Dis Allied Sci.
1993;35:167-77.
6. Chowgule RV, Shetye VM, Parmar JR. Lung function
tests in normal Indian children. Indian Pediatr. 1995;32:185-91.
7. Raj Kapoor, Mahajan KK, Mahajan A. Ventilatory
lung function tests in school children of 6-13 years. Indian J Chest Dis
Allied Sci. 1997;39:97-105.
8. Vijayan VK, Reetha AM, Kuppurao KV, Venkatesan P,
Thilakavathy S. Pulmonary function in normal south Indian children aged
7 to 19 years. Indian J Chest Dis Allied Sci. 2000;42:147-56.
9. Raju PS, Prasad KV, Ramana YV, Ahmed SK, Murthy
KJ. Study on lung function tests and prediction equations in Indian male
children. Indian Pediatr. 2003; 40:705-11.
10. Miller MR, Hankinson J, Brusasco V, Burgos F,
Casaburi R, Coates A, et al. Standardisation of spirometry. Eur
Respir J. 2005;26:319-38.
11. Chhabra SK, Vijayan VK, Rahman M, Mittal V, Singh
PD. Regression equations for spirometry in children aged 6 to 17 years
in Delhi region. Indian J Chest Dis Allied Sci. 2012;54:59-63.
12. Dickman ML, Schmidt CD, Gardner RM. Spirometric
standards for normal children and adolescents (ages 5 years through 18
years). Am Rev Respir Dis. 1971;104:680-7.
13. Sherill DL, Camilli A, Lebowitz MD. On the
temporal relationship between lung function and somatic growth. Am Rev
Respir Dis. 1989;140:638-44.
14. Hankinson JL, Odencrantz JR, Fedan KB.
Spirometric reference values from a sample of the general U.S.
population. Am J Respir Crit Care Med. 1999; 159:179-87.
15. Quanjer PH, Stocks J, Polgar G, Wise M, Karlberg
J, Borsboom G. Compilation of reference values for lung function
measurements in children. Eur Respir J Suppl. 1989;4:184S-261S.
16. Green SB. How many subjects does it take to do a
regression analysis? Multivariate Behavioral Research. 1991;26:499 510.
17. Chhabra SK. Regional variations in vital capacity
in adult males in India: comparison of regression equations from four
regions and impact on interpretation of spirometric data. Indian J Chest
Dis Allied Sci. 2009;51:7-13.
18. Aggarwal AN, Gupta D, Jindal SK. Comparison of
Indian reference equations for spirometry interpretation. Respirology.
2007;12:763-8.
19. American Thoracic Society. Lung function testing:
selection of reference values and interpretative strategies. Official
statement of the American Thoracic Society. Am Rev Respir Dis.
1991;144:202-18.
20. Pellegrino R, Viegi G, Brusasco V, Crapo RO,
Burgos F, Casaburi R, et al. Interpretative strategies for lung
function tests. Eur Respir J. 2005;26:948-68.
21. Chatterjee S, Mandal A. Pulmonary function
studies in healthy school boys of West Bengal. Jpn J Physiol.
1991;41:797-808.
22. Connett GJ, Quak SH, Wpm ML, Teo J, Lee BW. Lung
function reference values in Singaporean children aged 6-18 years.
Thorax. 1994;49:901-5.
23. Aggarwal AN, Gupta D, Behera D, Jindal SK.
Applicability of commonly used Caucasian prediction equations for
spirometry interpretation in India. Indian J Med Res. 2005;122:153-64.
24. Van Ganse WL, Billet L, Ferris B. Medical
criteria for the selection of normal subjects. In: Arcangeli P,
Cotes JE, Cournand A, Denolin H, Maria GD, Sadoul P, et al.,
editors. Introduction to the definition of normal values for respiratory
function in man. Alghero, Italy: Panminerva Medica; 1969. P.15-27.
|
|
|
 |
|
