|
|
|
Indian Pediatr 2013;50:
859-866 |
 |
Percentage Body Fat in Apparently Healthy
School Children From Northern India
|
|
R Khadgawat, *RK Marwaha
, N Tandon, †N Mehan, AD
Upadhyay, *A Sastry and
*K Bhadra
From the All India Institute of Medical Sciences, New Delhi;
*Institute of Nuclear Medicine and Allied
Sciences, Delhi; †SUR Medical College,
Delhi.
*Both, RK and RKM should be considered as joint first authors for
this study
Correspondence to: Maj Gen RK Marwaha, Gautam Apartments,
Gautam Nagar, New Delhi 110 049.
Email: marwaha_ramank@hotmail.com
Received: June 14, 2012;
Initial review: July 16, 2012;
Accepted:
January 28, 2013.
PII: S097475591200504
|
Context: Increased prevalence of obesity in childhood and
adolescence, defined by the use of body mass index (BMI), has drawn
attention towards direct measurement of body fat
Objective: To develop age-and sex-specific
reference distribution of body fat in apparently healthy North-Indian
children in the age group of 7-17 years and to assess agreement between
obesity (defined by BMI) and excess body fat
Design: Study subjects for this cross sectional
study included1640 apparently healthy school children (825 boys; 815
girls) aged 7-17 years. Total body fat was measured by dual energy
X-rays absorptiometry (DXA). The excess body fat by DXA was defined by
two methods, prevalence matching and with the use of 85th and 95th
centile cutoffs.
Results: The mean ± SD, 3rd, 10th, 25th, 50th,
75th, 90th and 97th centile values of percentage body fat (PBF) are
presented. PBF was highly correlated with BMI in both boys and girls
(all boys: r=0.76, P<0.0001; all girls r=0.81, P<0.0001).
There was no significant difference noted in PBF between boys and girls
at the age of 7-8 years. From 9 years onwards, girls had significantly
higher PBF than boys. Moderate degree of agreement was observed between
BMI and PBF by DXA by both methods.
Conclusions: Smoothened reference distribution of
PBF for North-Indian children and adolescents in Delhi are provided.
Indian children accumulate more body fat during peri-pubertal years in
comparison with US children.
Keywords: Percentage body fat, Obesity, Adolescents, Reference
values, India, Assessment values.
|
|
Childhood overweight and obesity have increased
dramatically since 1990. A recently published analysis of 450 nationally
representative cross-sectional surveys from 144 countries showed that 43
million children (35 million in developing countries) are estimated to
be overweight and obese, while 92 million are at risk of overweight [1].
Body mass index (BMI) is widely used to assess
overweight and obesity, and standard cutoff values are now widely
accepted for adults as well as children [2]. A major shortcoming of BMI
is that it provides excess weight relative to height, not excess body
fat, so it cannot differentiate between a muscular body and fatty body.
The interpretation of BMI among children and adolescents has additional
problems [3]. Skinfold thickness and bioelectric impedance, give
variable results and thus are a less preferred approach. Recently, dual
energy X-rays absorptiometry (DXA) has gained wider acceptability
as a research tool for evaluation of body composition as it provides
precise body composition analysis with a low radiation dose [4,5], is
reproducible, and able to detect small changes in body composition in
both, adults and children [6]. It is increasingly being used as a
criterion or reference for comparison with other body composition
measurement techniques [7-10] and is highly correlated with bioelectric
impedance analysis (BIA), skinfold thickness, and underwater weighing
[11-14].
It is now well established that adult Asian subjects
have higher levels of body fat than European subjects with comparable
BMI values which has led to a revision of WHO recommendations for
appropriate BMI cut-off levels in Asian populations [15]. Similar
differences in total body fat have also been seen in Asian children and
adolescents residing in western countries [16,17]. One of the major
limitations of these studies is very small sample size of Asian-Indian
subjects. However, absence of population based reference data makes it
difficult to define cutoffs for excess body fat especially in
Asian-Indian children and adolescents.
There have been few earlier studies aimed at defining
reference intervals of percentage body fat in Asian-Indian children and
adolescents. However, these studies had limitations of either a small
sample size or use of skin fold thickness for calculation of percentage
body fat [18,19] and none of them used DXA. We, therefore, undertook
this study to develop-age and sex-specific reference distribution of
body fat in apparently healthy children in the age group of 7-17 years
in Northern India and to assess agreement between obesity (defined by
BMI) and excess body fat (assessed by DXA).
Methods
This cross sectional study was part of health survey
of Delhi school children. Details have been published previously [20].
Brief history and tailored clinical examination related to anthropometry
was carried out in 1640 children (825 boys; 815 girls) aged 7-17 years.
Subjects suffering from any systemic disease (including diabetes and
hypothyroidism) or on any chronic treatment for more than one month were
not recruited for DXA. All subjects were transported to the study center
for body fat assessment by DXA. Body weight was measured to the nearest
0.1 kg using digital weighing machine (EQUINOX Digital weighing machine,
Model EB6171) and height was measured with wall mounted stadiometer
(Model WS045, Narang Medical Limited, Delhi)). BMI was calculated by
weight (in Kg) divided by square of height (in meter). Overweight and
obesity were defined by using cutoff provided by International Obesity
Task Force (IOTF, 2). The study protocol was approved by the
institutional ethics committee of Institute of Nuclear Medicine and
Allied Sciences (INMAS). Administrative approval was taken from school
authorities, written informed consent from parents / guardians, while
verbal assent was taken from the children who participated in the study.
Since the number of subjects in 5-year and 18-year age group was small
(12 and 16, respectively), they were not included in the final analysis.
Dual energy X-rays absorptiometry: Whole body DXA
scans were performed using GE Lunar Prodigy scanner (software version
2.20; General Electric Medical Systems, Madison, WI, USA). Measurements
were taken with the subject supine on the scanning table, beginning at
the top of the head and moving in a rectilinear pattern down the body to
the feet. The coefficient of variation of the scanner (on the basis of
two consecutive scans of 15 adult subjects) was 0.44% for total fat
mass. Similarly, whole body phantom was also scanned daily before
subject evaluation and remained stable during study period. However, in
view of additional radiation exposure, the reproducibility of these
scans was not assessed among children.
There are no generally acceptable percentage cutoffs
for body fat to define overweight and obesity in children. Even among
adults, World Health Organization concluded that "there is no agreement
about cutoff points for the percentage of body fat to constitute
obesity" [14, 21]. In absence of any universal acceptance, we adopted
two approaches for defining excess body fat. In the first approach
(‘Prevalence matching’ approach or Method A, 22), we formed three
categories of body fatness (normal, moderate and elevated body fat)
which correspond to the three BMI categories (normal, overweight and
obese as defined by IOTF cutoffs). Within each age and sex group,
percentage body fat cutoffs were chosen in a way that the number of
children with elevated, moderate and normal body fat would equal the
number of children who had BMI in the obese, overweight and normal BMI
categories. If there is perfect correlation between BMI and percentage
body fat, it would result in perfect matching of three body fat
categories with the three BMI categories.
The second approach (Method B), was based on use of
85th and 95 th centile
cut-offs for defining excess body fat as suggested [14]. We used these
two cutoffs from our data set to define excess body fat. Subjects with
percentage body fat <85th
centile were considered as having normal body fat, those with percentage
body fat between 85-95th
centile as having moderate body fat and individuals with body fat >95th
centile were considered as having elevated body fat.
We then looked for agreement between body fat
categories (normal, moderate and elevated body fat, generated by both
methods) and BMI categories (normal BMI, overweight BMI and obese BMI).
We also compared percentage body fat data from our study with available
similar (age and sex matched) two data sets from US population.
Statistical analysis: Analysis was performed
using STATA 9.0 (College Station Road, TX, USA). Descriptive statistics
were calculated as mean and standard deviations. An age specific
distribution of percentage body fat was calculated separately for boys
and girls. A p value of <0.05 was considered as statistically
significant. Student t test for independent samples was used to compare
difference in means between boys and girls. Age related reference
centile curves were generated using LMS Program version 1.28 [23].
Fleiss’ kappa was used for assessing the reliability of agreement.
Results
Out of 1640 children (825 boys), 299 children were
found to have BMI either in overweight (226, 13.8%; Boys – 15.8%; Girls
– 11.8%) or obese category (73, 4.5%; Boys – 5.8%, Girls – 3.1%, based
on IOTF cutoffs, Table I). The mean ± SD, 3 rd,
10th, 25th,
50th, 75th,
85th and 95th
centile values of percentage body fat for boys and girls are provided in
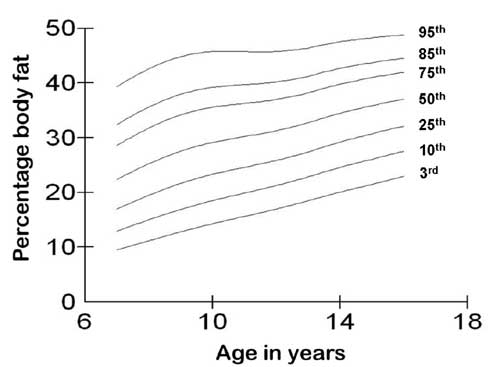
Table II. Reference centile curves for boys and girls are
shown in Figs. 1 and 2, respectively.
TABLE I Distribution of Study Population According to BMI* (IOTF# criteria)
|
Normal BMI |
Overweight |
Obese |
Total |
|
Boys |
647 (78.4%) |
130 (15.8%) |
48 (5.8%) |
825 |
|
Girls |
694 (85.2%) |
96 (11.8%) |
25 (3.1%) |
815 |
|
Total |
1341 (81.8%) |
226 (13.8%) |
73 (4.5%) |
1640 |
|
*BMI = Body mass index; # IOTF = International Obesity Task
Force. |
TABLE II 3rd, 10th, 25th, 50th, 75th, 85th and 95th Centile Values of Percentage Body Fat for Boys and Girls
|
Age |
n |
Mean±SD |
3rd |
10ththth |
25th |
50th |
75th |
85th |
95th |
|
Boys |
|
7 |
45 |
19.3±9.2 |
8.9 |
11.2 |
14.1 |
18.4 |
24.1 |
28.0 |
35.9 |
|
8 |
18 |
22.68±9.8 |
9.3 |
12.1 |
15.6 |
20.7 |
27.3 |
31.7 |
40.5 |
|
9 |
31 |
22.29±9.8 |
9.5 |
12.6 |
16.7 |
22.5 |
29.9 |
34.6 |
44.0 |
|
10 |
55 |
25.5±10.4 |
9.4 |
13.0 |
17.5 |
23.9 |
31.9 |
37.0 |
46.8 |
|
11 |
98 |
27.7±10.6 |
9.0 |
12.8 |
17.6 |
24.4 |
32.7 |
38.0 |
48.0 |
|
12 |
116 |
25.7±11.4 |
8.2 |
12.0 |
16.7 |
23.4 |
31.7 |
36.8 |
46.7 |
|
13 |
103 |
22.4±10.9 |
7.3 |
10.8 |
15.4 |
21.7 |
29.6 |
34.6 |
44.1 |
|
14 |
140 |
21.7±10.1 |
6.7 |
10.1 |
14.4 |
20.5 |
28.2 |
33.1 |
42.5 |
|
15 |
79 |
22.0±12.0 |
6.5 |
9.8 |
14.1 |
20.3 |
28.2 |
33.1 |
42.8 |
|
16 |
95 |
23.3±10.7 |
6.5 |
9.8 |
14.2 |
20.6 |
28.7 |
33.9 |
44.1 |
|
17 |
45 |
22.49±11.06.5 |
9.8 |
14.3 |
20.8 |
29.3 |
34.6 |
45.2 |
|
|
Girls |
|
7 |
24 |
22.42±8.9 |
9.5 |
12.9 |
17.0 |
22.4 |
28.7 |
32.4 |
39.3 |
|
8 |
10 |
25.33±10.011.2 |
15.0 |
19.5 |
25.2 |
31.8 |
35.6 |
42.6 |
|
|
9 |
30 |
29.2±9.1 |
12.8 |
16.9 |
21.7 |
27.6 |
34.2 |
38.0 |
44.8 |
|
10 |
32 |
30.8±10.8 |
14.3 |
18.5 |
23.3 |
29.2 |
35.6 |
39.3 |
45.8 |
|
11 |
71 |
30.55±8.5 |
15.6 |
19.9 |
24.6 |
30.3 |
36.3 |
39.8 |
45.8 |
|
12 |
90 |
31.32±8.2 |
17.0 |
21.3 |
25.9 |
31.3 |
37.0 |
40.2 |
45.8 |
|
13 |
128 |
32.61±7.2 |
18.5 |
22.8 |
27.4 |
32.7 |
38.2 |
41.2 |
46.4 |
|
14 |
107 |
35.43±8.1 |
20.1 |
24.6 |
29.2 |
34.5 |
39.8 |
42.7 |
47.6 |
|
15 |
149 |
35.2±8.0 |
21.5 |
26.1 |
30.7 |
35.9 |
41.0 |
43.7 |
48.3 |
|
16 |
121 |
37.66±6.6 |
23.0 |
27.6 |
32.1 |
37.1 |
42.0 |
44.5 |
48.8 |
|
17 |
53 |
37.15±7.5 |
24.3 |
28.8 |
33.3 |
38.0 |
42.6 |
45.0 |
49.0 |
 |
|
Fig. 1 3rd, 10th, 25th, 50th, 75th,
85th, and 95th centile curves for percentage body fat for boys.
|
 |
|
Fig. 2 3rd, 10th, 25th, 50th, 75th,
85th, and 95th centile curves for percentage body fat for girls.
|
Percentage body fat was highly correlated with BMI in
both, boys and girls (all boys r = 0.76, P <0.0001; all
girls r = 0.81 P<0.0001). In boys, the correlation was
poor in overweight (r = 0.20, P<0.01) and obese (r
= 0.28, P <0.04) while girls showed good correlation in normal (r
= 0.78, P<0.0001) and overweight (r = 0.53, P
<0.0001) but no significant correlation in obese (r = 0.18, P
0.37) subjects.
The mean percentage body fat in boys was 23.5%,
varying between 19.3% to 27.7 %. There was a tendency to increase in
percentage body fat from 7 years to reach maximum percentage body fat by
the age of 11 years of age. Thereafter, there was a trend to decrease in
body fat, followed by a plateau commencing at the age of 14 years.
The mean percentage body fat in girls was 33.6%,
varying between 22.4% to 37.6%. In contrast to the slopes of curves in
boys, girls showed progressive increase in percentage body fat from 7th
year onwards to reach peak at 17th
year, a rise of 70% from the age of 7 years.
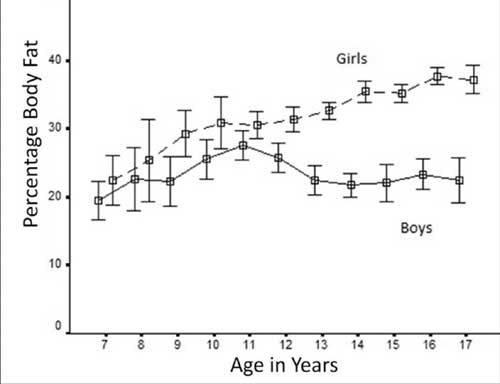
There was no significant difference noted in
percentage body fat between boys and girls at the age of 7-8 years (P
0.20 and 0.49 respectively). From 9 years onwards, there was a
difference in percentage body fat between boys and girls, which become
heightened after the age of 12 years (P<0.0001 for 12 year
onwards). Figure 3 shows changes in percentage body fat in both
sexes with progression of age.
 |
|
Fig. 3 Progression of percentage body
fat with age in boys and girls.
|
Agreement between percentage body fat and BMI
There was similar agreement between BMI categories
and percentage body fat categories (moderate agreement) as assessed by
both methods, though kappa was better with method A (Web Table
I and II). Using method A, 6.3% boys with normal BMI had moderate
percentage body fat in all except one, who fell in excess percentage
body fat category. Boys who were overweight (by BMI), showed more
variation with 41% of these subjects having normal or excess body fat
while 32% subjects in the obese group (by BMI) had either normal (13%)
or moderate body fat (87%). Similar results were also observed using
method B.
Similarly, using method A, 5.8% girls had moderate or
excess body fat despite having BMI within normal range. Approximately
49% of girls with BMI in overweight category had either normal (91%) or
excess body fat (9%) while 19.2% of obese girls (by BMI) had moderate
body fat. Similar results were also observed using method B.
Comparison of percentage body fat with NHANES data
(Web Table III)
We compared percentage body fat of selected age
categories from our study with age and sex match data of percentage body
fat from US National Health and Nutrition Examination Survey (NHANES,
24). In the lower age group (8 years), both boys and girls from NHANES
data have higher body fat than Indian children although the difference
lessened as percentile increased and became almost equal at 95 th
centile. At the age of 10 years, Indian boys and girls had lower body
fat than subjects in NHANES but this difference decreased as the
centiles increased, becoming almost equal at 85th
centile. However, at 95th
centile, Indian boys and girls had higher body fat that their counter
parts. At 13 years of age, Indian boys had lower body fat at lower
centiles (10th and 25th)
but equal or higher body fat at higher centiles. In contrast, Indian
girls at 13 years had equal body fat at 10th
centile but had higher body fat at all other centiles. In the age group
of 17 years, boys had lesser body fat at lower centiles which became
equal at 50th centile and
later, achieved higher body fat at higher centiles whereas girls at 17
years of age had higher body fat at all centiles when compared with
NHANES data set.
Comparison of percentage body fat with New York
pediatric Rosetta study
We also compared our 85 th
and 95th centiles of
percentage body fat with age and sex matched data with New York
pediatric Rossetta study [25]. Comparison of 95th
centile of percentage body fat showed that boys had almost similar
percentage body fat at 7 yrs of age but after that, Indian boys
accumulated more fat than US boys and had higher percentage body fat in
all other age groups. In contrast, Indian girls had higher percentage
body fat in all age groups except 12-13 years. Similar pattern was also
seen for 85th centile in all
boys and girls except Indian boys at 8-9 yrs of age and Indian girls at
12-13 yrs, who had lower percentage body fat than their counterparts.
Discussion
In the present study, we analyzed percentage body fat
in 1640 North-Indian school children aged 7-17 years from Delhi and
found high levels of percentage body fat in apparently healthy children
and adolescents. The very purpose of present study was to assess the
agreement between BMI and PBF and establish reference intervals for PBF
for North-Indian children.
The increased prevalence of childhood obesity,
dysmetabolic state and type 2 diabetes and their long-term
cardiovascular risk makes measurement of body fat relevant to pediatric
clinical practice and demands establishment of simple and reliable
clinical methods for its assessment [26]. BMI is widely used to assess
overweight and obesity, and standard cutoff values are now widely
accepted for adults as well as children [26]. Apart from its inability
to differentiate between fat and muscle mass, BMI does not account for
ethnicity. It has been suggested that because of excessive overall
adiposity at a lower body weight as compared to white, BMI may not be an
accurate indicator of adiposity in Asian Indians [27]. These limitations
have led to search of alternative method of estimation of total body
fat. Skinfold thickness at multiple sites has also been used for
estimation of total body fat in both, adults and children. Although,
this is an easy and inexpensive method, discrepancies in measurements
are likely if the observer is not trained and in severely obese
subjects. This method, which predominantly estimates peripheral fat, may
not be the best measure of adiposity in Indian children, who have a
tendency to store fat centrally [19]. BIA, a simple, convenient and
inexpensive method for assessing adiposity, has gained popularity in
last few years. As bioelectrical resistance is based on an estimation of
total body water, a further concern in children relates to uncertainty
of the hydration level of fat-free mass in children at different stages
of maturation [28]. DXA has gained wider acceptability for body
composition studies because of its many advantages. It has been well
validated for body composition assessment in children as well as infants
[29, 30]. Studies have also examined the accuracy of the technique
through use of carcass analysis in animal models [31].
Despite the widespread use of BMI as a screening tool
for overweight and obesity in children, there is evidence that it is not
a consistent predictor of percentage body fat across all ethnicities
[32]. This may result in an incorrect identification of subjects at risk
of adverse negative health outcomes related to excess adiposity. Recent
studies have found that even at the same BMI, adults from Asia [33-36]
have more body fat (as determined by DXA or four-compartment models)
than do white Caucasians. Similar pattern has also been reported in
children [37]. The propensity for South Asians to accumulate higher
levels of body fat despite their relatively small body size has been
demonstrated in adolescents [32, 38] and adults [33] and is a concern
for the future health status of this ethnic group.
The magnitude of the association between childhood
levels of BMI and body fatness (as determined by DXA, densitometry and
other methods) have varied substantially across studies, and relatively
modest (r~0.5) associations have been reported [22]. In present study,
30.7% of boys, who had BMI in overweight category, had normal percentage
body fat while 10.8% of boys from same BMI category had elevated
percentage body fat. Similar figures for girls were 41.6% and 5.3%
respectively. This suggests that children with BMI in overweight
category are more likely to have normal body fat than elevated body fat
in cases of misclassification. The proportion of children with BMI in
obese category having normal body fat was very less (2.1% in boys and 0%
in girls). The correlation between percentage body fat and BMI was good,
but girls showed better correlation than boys (boys - r 0.76; girls - r
0.81). This correlation was best seen in subjects with normal BMI,
worsened in those who were overweight (by BMI) and almost absent in
obese individuals. A similar correlation between percentage body fat by
DXA and BMI has also been reported previously [22, 26].
All classification cutoffs used for defining excess
body fat are arbitrary and there is little agreement on the
classification of excess body fat among adults or children [22].
Different studies have used different cutoffs to define excess body fat.
Many studies have used prevalence matching method (method A) which seems
to be more logical but depends upon the presumption of 100% agreement
(exact agreement) between BMI and body fat. The other method uses
cut-offs based on 85 th and
95th centile (method B) for
defining moderate and elevated body fat. Both of these methods use
cutoffs that correspond to a critical position in a reference population
but are not based on increased cardiovascular risk associated with
excess body fat. In our study, we used both the above methods, and
demonstrated high degree of agreement with BMI, with kappa being better
with the prevalence matching method (0.62 vs 0.56). This is in agreement
with previous published study from US, involving multiethnic population
[22].
The shape of the percentage body fat curves is
similar to expected changes in human body composition with growth [39,
40]. In normal growth and development, males gain more muscle and lean
tissue at puberty, while girls gain more fat. Boys showed highest
percentage body fat around 10-11 years while highest percentage body fat
in girls was seen at 17 years. There were notable differences in the
shape of the body fat centile curves for boys and girls. Percentage body
fat in boys increased from age 7, peaked at age 10-11, and leveled off
at age 14, possibly influenced by pubertal changes resulting from more
muscular development than fat accumulation. The height of the peak was
more pronounced for the higher centiles than lower centiles which showed
less change from baseline. In contrast, the body fat centiles for girls
increased more steadily from 7-17 years, with maximum rise seen in
subjects in lower centiles, while higher centiles showed minimal
changes. These results are in agreement with previous publications on
percentage body fat curves in children and adolescents, although the
techniques used for estimation were different [39, 41]
Comparing our data with NHANES showed that at lower
centiles, Indian boys had lower percentage body fat whereas in higher
centiles, percentage body fat was almost equal or higher. Indian girls
also showed similar pattern but higher percentage body fat at higher
centiles than NHANES data set. Indian children show consistently higher
rise in percentage body fat accumulation with age as compared to US
counterparts (visual impression of comparing two data sets). As puberty
is the major physiological change occurring during this age period,
indirectly, we can say that Indian children accumulate body fat during
pubertal development. However, this comparison has limitations of only
being age and sex matched, and not BMI or pubertal stage matched.
Similar observations were also made when compared with New York
pediatric Rosetta study. One of the limitations of this comparison is
different time period for data collection (pediatric Rosetta study
1995-2000).
The measurement of body fat by direct method is
better than assessing "fatness" with indirect methods, like BMI.
However, lack of clear cutoffs for defining excess body fat makes their
use limited in both research and clinical practice. The available
cutoffs are not based on clinical and metabolic correlates of excess
body fat. Hence, there is need to develop such cutoffs which relate
excess body fat with metabolic and cardiovascular risk.
The strengths of our study are the large sample size,
single ethnicity and use of DXA, a validated measure of percentage body
fat in children. Although DXA is considered as the best available method
but 4-compartment model is presently considered as the gold standard for
estimation of body fat. The relationship between percentage body fat
from DXA and percentage body fat from a 4C model has been shown to vary
according to percentage body fat with DXA underestimating percentage
body fat in those with lower body fat and overestimating it in those
with higher body fat [42]. Williams, et al reported that the bias
of percentage body fat measurements obtained from DXA varies according
to gender, size and percentage body fat [43]. They proposed that the
distribution of fat may influence the accuracy of DXA, which is of
particular relevance to the Indian population as there is evidence that
fat in this population is more centrally distributed than in white
Caucasians [44]. Additionally, DXA shows bias across the range of
fatness, whereby it under-predicted fat mass in leaner subjects and
over-predicted fat mass in heavier subjects [6]. Another limitation is
the small number of study subjects in 7-9 years age category, especially
8 years. However, percentage body fat of subjects in 8 years age
category did not differ significantly from that of 7 or 9 years age
category (P = 0.43) and showed the same pattern of change in
terms of PBF.
In conclusion, we compared BMI based obesity
classifications to percentage body fat classifications determined by DXA
in 1,640 North-Indian children and adolescents. BMI misclassified 13-14%
of boys and 11-14.5% of girls into an incorrect adiposity category. We
suggest that 85 th centile of
percentage body fat cutoff may be used to define moderate body fat while
95th centile to define
excess body fat in North-Indian children and adolescents. Comparison
with percentage body fat data from two US studies showed that Indian
children accumulate more body fat during peri-pubertal years.
Our study is the first large-scale study,
establishing the percentage body fat distribution in apparently healthy
North Indians across all age groups in childhood and adolescence.
We suggest that these data may be used for
interpretation of an individual’s result for decision making, for
epidemiological studies and for probable use by health policy makers.
These curves may be used to assess children’s adiposity in both clinical
and survey settings for investigating risk factors and disease outcomes.
There is an urgent need for large-scale studies which
could correlate body fat in children (using percent body fat curves as
shown in present study) and future risk factors for obesity-related ill
health.
Acknowledgements: Ms Rekha Ramot and Ms Nazmeen
for help in preparation of this manuscript.
Contributors: RKM: conceived of the
project idea and designed the research, led the development of the
manuscript and has primary responsibility for the final content; RK:
designed the research plan, analyzed the data and manuscript preparation
and final draft of manuscript; NT: designed the research plan,
manuscript preparation; NM, AS, AN and KB: data collection and AS:
analyzed the data and performed the statistical analysis. All
authors read and approved the final manuscript.
Funding: None; Competing interests: None
stated.
References
1. de Onis M, Blössner M & Borghi E. Global
prevalence and trends of overweight and obesity among preschool
children. Am J Clin Nutr. 2010:92;1257-64.
2. Cole TJ, Bellizzi MC, Flegal KM, Dietz WH.
Establishing a standard definition for child overweight and obesity
worldwide: international survey. BMJ. 2000:320;1240-3.
3. Freedman DS, Wang J, Maynard LM, Thornton JC, Mei
Z, Pierson Jr RN, et al. Realtion of BMI to fat and fat free mass
among children and adolescents. Int J Obesity 2005: 29;1-8.
4. Field AE, Laird N, Steinberg E, Fallon E,
Semega-Janneh M, Yanovski JA. Which metric of relative weight best
captures body fatness in children? Obes Res. 2003:11;1345-52.
5. Mazess RB, Barden HS, Bisek JP, Hanson J.
Dual-energy X-ray absorptiometry for total-body and regional
bone-mineral and soft-tissue composition. Am J Clin Nutr.
1990:51;1106-12.
6. Fields DA, Goran MI. Body composition techniques
and the four-compartment model in children J Appl Physiol.
2000:89;613-20.
7. Cameron N, Griffiths PL, Wright MM, Blencowe C,
Davis NC, Pettifor JM, et al. Regression equations to estimate
percentage body fat in African prepubertal children aged 9 y. Am J Clin
Nutr. 2004:80;70-5.
8. Eisenmann JC, Heelan KA, Welk GJ. Assessing body
composition among 3 to 8-year-old children: anthro-pometry, BIA, and
DXA. Obes Res. 2004:12;1633-40.
9. Elberg J, McDuffie JR, Sebring NG, Salaita C, Keil
M, Robotham D, et al. Comparison of methods to assess change in
children’s body composition. Am J Clin Nutr. 2004:80;64-9.
10. Frisard MI, Greenway FL, Delany JP. Comparison of
methods to assess body composition changes during a period of weight
loss. Obes Res. 2005:13;845-54.
11. Going SB, Massett MP, Hall MC, Bare LA, Root PA,
Williams DP, et al. Detection of small changes in body
composition by dual-energy X-ray absorptiometry. Am J Clin Nutr.
1993:57;845-50.
12. Johansson AG, Forslund A, Sjödin A, Mallmin H,
Hambraeus L, Ljunghall S. Determination of body composition a comparison
of dual-energy X-ray absorptiometry and hydrodensitometry. Am J
Clin Nutr. 1993:57;323-6.
13. Boot AM, Bouquet J, de Ridder MA, Krenning EP, de
Muinck Keizer-Schrama SM. Determinants of body composition measured by
dual-energy X-ray absorptiometry in Dutch children and
adolescents. Am J Clin Nutr. 1997:66;232-8.
14. Freedman DS, Sherry B. The validity of BMI as an
indicator of body fatness and risk among children. Pediatrics.
2009:124;S23-S34.
15. WHO Expert Consultation. Appropriate body-mass
index for Asian populations and its implications for policy and
intervention strategies. Lancet. 2004:363;157-63 .
16. Shaw NJ, Crabtree NJ, Kibirige MS, Fordham JN.
Ethnic and gender differences in body fat in British schoolchildren as
measured by DXA. Arch Dis Child. 2007:92;872-5.
17. Freedman DS, Wang J, Thornton JC, Mei Z, Pierson
RN Jr, Dietz WH, et al. Racial/ethnic differences in body fatness
among children and adolescents. Obesity (Silver Spring).
2008:16;1105-11.
18. Chatterjee S, Chatterjee P, Bandyopadhyay A.
Skinfold thickness, body fat percentage and body mass index in obese and
non-obese Indian boys. Asia Pac J Clin Nutr. 2006:15;231-5.
19. Kehoe SH, Krishnaveni GV, Lubree HG, Wills AK,
Guntupalli AM, Veena SR, et al. Prediction of body-fat percentage
from skinfold and bio-impedance measurements in Indian school children.
Eur J Clin Nutr. 2011:65;1263-70.
20. Marwaha RK, Khadgawat R, Tandon N, Kanwar R,
Narang A, Sastry A, et al. Reference intervals of serum calcium,
ionized calcium, phosphate and alkaline phosphatase in healthy Indian
school children and adolescents. Clin Biochem. 2010:43;1216-9.
21. World Health Organization, Expert Committee on
Physical Status. Physical Status: The Use and Interpretation of
Anthropometry. Geneva, Switzerland: World Health Organization; 1995:420.
WHO technical report 854.
22. Freedman DS, Wang J, Thornton JC, Mei Z, Sopher
AB, Pierson RN Jr, et al. Classification of body fatness by body
mass index-for-age categories among children. Arch Pediatr Adolesc Med.
2009:63;805-11.
23. Cole TJ. The LMS method for constructing
normalized growth standards. Eur J Clin Nutr . 1990:44;45-60.
24. Ogden CL, Li Y, Freedman DS, Borrud LG, Flegal
KM. Smoothed percentage body fat percentiles for U.S. children and
adolescents, 1999-2004. Natl Health Stat Report. 2011;43:1-7.
25. Mei Z, Grummer-Strawn LM, Wang J, Thornton JC,
Freedman DS, Pierson RN Jr, Dietz WH, Horlick M. Do skinfold
measurements provide additional information to body mass index in the
assessment of body fatness among children and adolescents? Pediatrics.
2007;9:e1306-13.
26. Steinberger J, Jacobs DR, Raatz S, Moran A, Hong
CP, Sinaiko AR. Comparison of body fatness measurements by BMI and
skinfolds vs dual energy X-ray absorptiometry and their relation to
cardiovascular risk factors in adolescents. Int J Obes (Lond). 2005:29;
1346-52.
27. Goel K, Gupta N, Misra A, Poddar P, Pandey RM,
Vikram NK, et al. Predictive equations for body fat and abdominal
fat with DXA and MRI as reference in Asian Indians. Obesity (Silver
Spring). 2008:16;451-6.
28. Goran MI, Driscoll P, Johnson R, Nagy TR, Hunter
G. Cross-calibration of body-composition techniques against dual-energy
X-ray absorptiometry in young children. Am J Clin Nutr. 1996:63;299-305.
29. Ellis KJ, Shypailo RJ, Pratt IA, Pond WG.
Accuracy of dual-energy x-ray absorptiometry for body-composition
measurements in children. Am J Clin Nutr. 1994:60; 660-5.
30. Brunton IA, Bayley HS, Atkinson SA. Validation
and application of dual-energy x-ray absorptiometry to measure bone mass
and body composition in small infants. Am J Clin Nutr. 1993:58;839-45.
31. Pintauro 5, Nagy TR, Duthie C, Goran MI.
Cross-calibration of fat and lean measurements by dual-energy X-ray
absorptiometry to pig carcass analysis in the pediatric body weight
range. Am J Clin Nutr. 1995:63;293-8.
32. Duncan JS, Duncan EK, Schofield G. Accuracy of
body mass index (BMI) thresholds for predicting excess body fat in girls
from five ethnicities Asia Pac J Clin Nutr. 2009:18;404-11.
33. Deurenberg-Yap M, Schmidt G, van Staveren WA,
Deurenberg P. The paradox of low body mass index and high body fat
percentage among Chinese, Malays and Indians in Singapore. Int J Obes
Relat Metab Disord 2000:24;1011-7.
34. Gallagher D, Heymsfield SB, Heo M, Jebb SA,
Murgatroyd PR, Sakamoto Y. healthy percentage body fat ranges: an
approach for developing guidelines based on body mass index. Am J Clin
Nutr. 2000:72;694-701.
35. Gurrici S, Hartriyanti Y, Hautvast JG, Deurenberg
P. Relationship between body fat and body mass index: differences
between Indonesians and Dutch Caucasians. Eur J Clin Nutr.
1998:52;779-83.
36. Chung S, Song MY, Shin HD Kim DY, He Q, Heshka S,
Wang J, et al. Korean and Caucasian overweight premenopausal
women have different relationship of body mass index to percent body fat
with age. J Appl Physiol. 2005:99;103-7.
37. Deurenberg P, Deurenberg-Yap M, Foo LF, Schmidt
G, Wang J. Differences in body composition between Singapore Chinese,
Beijing Chinese and Dutch children. Eur J Clin Nutr. 2003:57;405-9.
38. Mehta S, Mahajan D, Steinbeck KS, Bermingham MA.
Relationship between measures of fatness, lipids and ethnicity in a
cohort of adolescent boys. Ann Nutr Metab. 2002:46;192-9.
39. Ogden CL, Li Y, Freedman DS, Borrud LG, Flegal
KM. Smoothed percentage body fat percentiles for U.S. children and
adolescents, 1999-2004. Natl Health Stat Report. 2011:43;1-7.
40. Forbes GB. Body composition in adolescence. In:
Falkner F and Tanner JM (eds). Human Growth: 2: Postnatal Growth.
Bailliere Tindall: London, 1978. p. 239-72.
41. McCarthy HD, Cole TJ, Fry T, Jebb SA, Prentice
AM. Body fat reference curves for children. Internat J Obesity.
2006:30;598-602.
42. Sopher AB, Thornton JC,Wang J, Pierson Jr RN,
Heymsfield SB, et al. Measurement of percentage of body fat in
411 children and adolescents: a comparison of dual-energy X-ray
absorptiopmetry with a four-compartment model. Pediatrics.
2004:113;1285-90.
43. Williams JE, Wells JC, Wilson CM, Haroun D, Lucas
A, Fewtrell MS. Evaluation of Lunar Prodigy dual-energy X-ray
absorptiometry for assessing body composition in healthy persons and
patients by comparison with the criterion 4-component model. Am J Clin
Nutr. 2006:83;1047-54.
44. Krishnaveni GV, Hill JC, Veena SR, Leary SD,
Saperia J, Chachyamma KJ, et al. Truncal adiposity is present at
birth and in early childhood in South Indian children. Indian Pediatr.
2005;42:527-38.
|
|
|
 |
|
