|
|
|
Indian Pediatr 2013;50:
853-857 |
 |
Pune Low Birth Weight Study – Birth to
Adulthood – Cognitive Development
|
|
Sudha Chaudhari, Madhumati Otiv, Bharati Khairnar, Anand Pandit,
Mahendra Hoge and Mehmood Sayyad
From Department of Pediatrics, KEM Hospital, Pune, Maharashtra,
India.
Correspondence to: Dr Sudha Chaudhari, Consultant, Division of
Neonatology, Department of Pediatrics, KEM Hospital Research Centre,
Pune 411 011, Maharashtra, India.
Email: [email protected]
Received: November 05, 2012;
Initial review: November 29, 2012;
Accepted: March 12, 2013.
PII:
S097475591200950
|
Objective: To assess the cognitive development of non-handicapped
low birth weight (LBW) infants at 18 years.
Design: Prospective cohort study.
Setting: Infants born between 1987 - 1989 with
birth weight less than 2000g and discharged from a neonatal special care
unit were followed up till the age of 18 years.
Methods: The intelligence quotient (IQ) was
determined by Raven’s progressive matrices. Assessment of adjustment and
aptitude was done.
Results: The cohort of 161 LBW infants was
divided into three groups according to their gestation - preterm SGA (n=61),
full term SGA (n=30) and preterm AGA (n=70). 71 full term
AGA infants served as controls. The IQ of the study group (Percentile
39.3) was significantly lower than that of controls (Percentile 54.9) (P=0.002).
Preterm SGA subjects had the lowest IQ (Percentile 35.5), though just
within normal limits. Males from the study group had significantly lower
IQ than male controls (P=0.03). The IQ of PTSGA subjects of
college educated mothers (P=0.004) and belonging to higher
socio-economic class (P=0.04) was significantly higher. On the
differential aptitude test, PTSGA subjects were poor in speed and
mechanical reasoning. The 18 year IQ could be best predicted by IQ at 6
and 12 years.
Conclusion: Preterm SGA children have the lowest
IQ at 18 years, males have lower IQ. Maternal education and
socio-economic status have great impact on cognitive development. Good
prediction of the 18 year IQ can be done by the 6 and 12 year IQ.
Keywords: Adulthood, Intelligence quotient, Low birth weight.
|
|
Advances in neonatal care have resulted in
survival of lower and lower birth weight babies. Hence all the recent
follow up studies have concentrated on very low birth weight (VLBW) or
extremely low birth weight (ELBW) infants [1,2]. Very little attention
has been paid to the outcome of moderately low birth weight (LBW)
infants. Though a small percentage of these children develop cerebral
palsy or mental retardation, long term follow up studies have shown mild
problems in cognition, adjustment and behavior [3] in early adolescence.
These problems continue into adulthood. Adverse socio-demographic
factors affect the outcome and appear to have far greater impact on
cognition, than biological factors [1].
In a recent paper on growth of LBW infants at 18
years, we have described this cohort, which was born in the late
eighties [4]. We have previously reported [5,6] on cognitive development
of these infants at school entry (6 years) and at early adolescence (12
years). This communication describes the intelligence of these
"apparently normal" LBW infants at 18 years, their educational
achievement, and social integration. We have tried to find out the
impact of socio-demographic and environmental factors on their
intelligence quotient. We have also tried to find out if prediction of
the final IQ could be done at an earlier age.
Methods
The cohort consisted of infants weighing less than
2000g discharged from a Neonatal Special Care Unit during a 18 month
period between October 1987 to April 1989. They were followed up
prospectively till the age of 18 years. The LBW infants were classified
into appropriate for gestational age (AGA) and small for gestational age
(SGA) using standard criteria [7]. Full term neonates with birth weight
of >2500g with no antenatal, natal and postnatal risk factors
born during the same period were enrolled as controls.
All neonatal risk factors were recorded. A detailed
socio-demographic background of each child was obtained by the social
worker by making a home visit. Children with major neurologic sequelae
like cerebral palsy and mental retardation were omitted from this study
at the end of the three year follow-up, as they could not do the
complicated tests of cognition. So the cohort now consisted of
"apparently" normal children.
Assessment of Cognition was done by Raven’s
Progressive Matrices [8]. It is a performance test of intelligence. It
evaluates the subject’s ability to apprehend relationships, geometric
figures and designs and to perceive the structure of the design in order
to select the appropriate part. It is a test of innate educational
ability with a small contribution of spatial perception factor. The
result is expressed in percentiles and 25 th
to 75th percentile is
considered as normal.
Assessment of Adjustment was done by Adjustment
Inventory [9]. This test taps five areas of adjustment: (i)
home/family adjustment; (ii) social adjustment; (iii)
personal and emotional adjustment; (iv) educational adjustment;
and (v) health adjustment.
Assessment of Aptitude was done by
Differential Aptitude Test [10]. The Indian adaptation of the original
American Version was used. It is a timed test and tests (i)
numerical ability; (ii) abstract reasoning (iii) space
relations (iv) mechanical reasoning; (v) clerical speed
and accuracy; and (vi) language usage and verbal reasoning.
Interest Inventory Test was standardized in
our own Child Guidance Clinic. It explores interest in medical,
engineering, fine arts, commerce and arts. Socio econo-mic status was
assessed by the Kuppuswamy Scale.
Statistical analysis: Analysis was performed
using statistical package for Social Sciences (SPSS) for windows
(Version 11.5). The linear association between the normally distributed
variables was assessed by Pearson’s correlation coefficients, otherwise
Spearman’s correlation coefficients were used. The partial correlation
analysis was also used to test the independent associations between
several variables of interest.
The LBW and control groups were first compared using
analysis of variance (ANOVA) procedure with Bonferroni’s method of
correction. The non-parametric test (Mann Whitney U test) was also used
when the variables were non-normally distributed. Chi-square or Fisher’s
exact test was used to explore differences between proportions. For
finding predictors of different variables, the multiple linear
regression technique was used. For determining the predictors of binary
outcome variables, the multiple logistic regression technique was used.
Results
We have already described the cognitive development
of 180 Low birth weight and 90 control children at 12 years [7]. This is
a continuation of the same study and no new children were added. Five
LBW children and 17 controls were lost to follow up and 14 LBW children
refused to come for the assessment. So our final sample consisted of 161
LBW and 73 normal birth weight children. The children who dropped out of
the study were similar to those who continued in the study and showed no
statistically significant difference. Thus, out of the 201 LBW infants
from the original cohort, 161 (80%) were available for the final 18 year
follow up.
The birth weight of the study group ranged from 866
to 1999 g (mean 1545.5 ± 243.9g). The mean (SD) birth weight of the
control group was 2835.3 (305.8)g. The gestation of the study group
ranged from 28-40 weeks with a mean of 34.7 ± 2.7 weeks. There were 91
males and 70 females in the study group and 43 males and 30 females in
the controls. There were 131 preterms and 30 full terms in the LBW
group. Out of the 131 preterms, 61 were small for gestational age (SGA)
and 60 were appropriate for gestational age. Out of 91 AGA infants 61
(67%) were preterm and 30 (33%) were full term. The maternal
demographics and Neonatal data are shown in Table I. There
was no significant difference in the socio-demographic data of the
subjects and controls.
TABLE I Neonatal Data and Socio-demographic Data of Parents
| |
Cases (N=161) |
Controls (N=73) |
|
Male (N=91) |
Female (N=70) |
Male (N=43) |
Female (N=30) |
|
Neonatal Data |
|
Birthweight (g)¥ |
1568.9 (223.3) |
1515.1 (267.0) |
2898.8 (337.0) |
2744.3 (230.4) |
|
Gestation age (wks) ¥ |
34.8 (2.6) |
34.9 (2.9) |
39.9 (0.54) |
39.9 (0.51) |
|
SGA |
49 (53.8) |
42 (60.0) |
0 |
0 |
|
AGA |
42 (46.2) |
28 (40.0) |
43 (100.0) |
30 (100.0) |
|
Parental Data |
|
Socio-economic status |
|
Higher
|
14 (15.7) |
16 (23.5) |
5 (12.2) |
4 (14.3) |
|
Upper middle |
23 (25.8)
|
18 (26.5) |
7 (17.1) |
8 (28.6) |
|
Lower middle |
36 (40.4) |
22 (32.4) |
16 (39.0) |
13 (46.4) |
|
Lower |
16 (18.0) |
12 (17.6) |
13 (31.7) |
3 (10.7) |
|
Educational status of Mother |
|
<10th Standard |
42 (47.2) |
23 (33.8) |
19 (46.3) |
11 (39.3) |
|
Educational status of Father |
|
<10th Standard |
25 (28.1) |
12 (17.7) |
10 (25.0) |
4 (14.3) |
|
¥Values are Mean (SD). The rest of the
values are n (%); SGA: Small for gestational age; AGA:
Appropriate for gestational age. |
 |
|
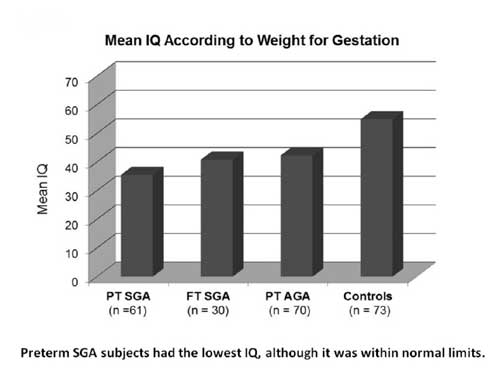
Fig.1 Mean IQ according to weight for
gestation. Preterm SGA sujects had the lowest IQ,
although it was within normal limits.
|
Assessment of Cognition: Fig. 1
shows the IQ of the three groups of LBW subjects according to weight for
gestation at birth. The IQ of the study group (39.3) was significantly
lower than the IQ of controls (P=0.002). There were 17 subjects
out of the 61 PTSGA group, who had IQ below average (28.3%), compared to
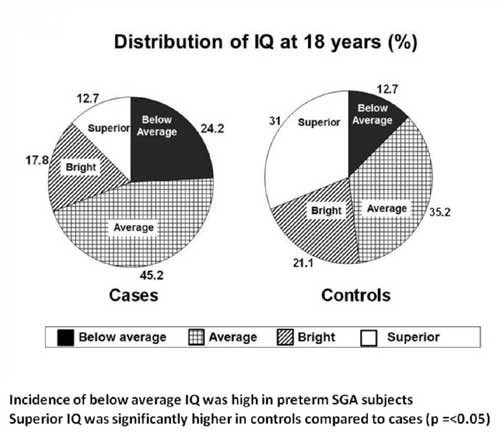
12.7% below average in controls (P=<0.05). The distribution of IQ
in the study group and controls is shown in Fig. 2.
 |
|
Fig.2 Distribution of IQ at 18 years
(%). Incidence of below average IQ was high in preterm SGA
subjects superior IQ was significantly higher in controls
compared to cases (P<0.05).
|
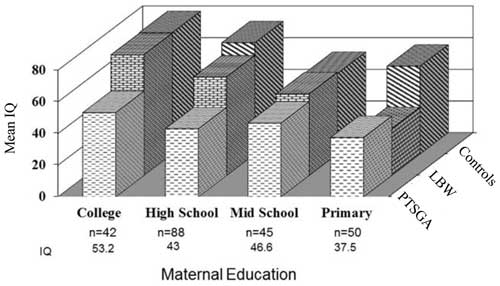
Fig. 3 shows the association between maternal
education and IQ. As seen in this figure, the PTSGA children of college
educated mothers had far better IQs compared to those with lesser
education (P=0.004). A similar impact of socio-economic class was
seen in the PTSGA subjects.
 |
|
Fig.3 Maternal education and IQ at 18
years. Preterm SGA children of college educated mothers had far
better IQs compared to those with lower education (P=0.004).
|
We could assess the IQ of 84 mothers to see if there
was any correlation between mother’s IQ and the child’s IQ, but we found
no such correlation. IQ was possible in only 35 fathers, and there was
no correlation between father’s IQ and the child’s IQ. There were only 3
single mothers in the study group.
There were 41 children who had failed at least in one
standard in school in the study group and only 4 children who had failed
in the control group (P<0.05). Failures were more common in boys
than in girls. There were 16 dropouts from the school in the study group
(5 girls, 11 boys) and mostly around 10 th
standard. There were 4 drop outs amongst controls.
A multiple linear analysis was done to find out the
determinants of IQ. The final model is shown in
Web Table I.
Birth weight and mother’s education were found to be significant
determinants of IQ. A regression analysis was done to find out the
independent determinants of educational status at 18 years. IQ and
gender independently determined the educational status. Sepsis, as a
risk factor at birth, was found to independently determine educational
status. Lower IQ was associated with lower educational status (P=0.0004).
It was seen that children with lower IQ failed more frequently compared
to children with better IQs (Odd’s ratio 14.1). School failure was more
common in boys than girls. When independent determinants of failure were
determined by a logistic regression, IQ (P=0.003) and male gender
(P=0.001) were found to be significant.
In order to see at what age we could predict the IQ
at 18 years, we did a correlation with the mental quotient (MDI) at 1
year, the IQ at 6 and 12 years. All correlated with IQ at 18 years.
However, six and twelve year IQ showed the highest correlation (P=0.001).
Assessment of Adjustment: We found no significant
difference between the subjects and controls. Similarly there was no
difference in the adjustment between boys and girls.
Assessment of Aptitude: All low birth weight
subjects were poor in speed compared to controls. Preterm SGA subjects
had significantly low scores (P=0.024) in mechanical reasoning,
as compared to controls. They also showed poor speed in their tasks (P=0.002).
Full term SGA subjects showed significantly less scores in space
relations and speed (0.011). The PTAGA were poor in speed.
Interest Inventory: Those with aptitude for space
relations opted for fine arts. Those who were poor in speed opted for
arts colleges. Those who had poor abstract thinking and mechanical
reasoning opted for commerce.
Out of 161 LBW subjects, 15% had chronic medical
problems. Six subjects had visual problems, four had hearing problems,
and two had speech problems. Two subjects were on medication for
seizures. One subject had a hearing aid and wore glasses. Two subjects
were on medication for hypertension and Two were operated for
tendoachiles contractures. Five girls had menstrual problems.
Discussion
This is the final phase of the "Pune Low Birth Weight
Study", in which infants weighing less than 2kg have been assessed at 18
years. We could follow up 80% of the original cohort of LBW infants. The
LBW cohort and NBW controls were similar in their socio-demographic
characteristics.
We had already assessed the verbal and performance IQ
separately at 12 years by Weschler’s Intelligence Scale [5]. Hence at 18
years, we used the Raven’s Progressive Matrices, which is a performance
test. The LBW children had lower IQs compared to controls. Similar
findings are reported in a meta-analysis of cognitive outcome in VLBW
infants [11]. The lowest IQ in our study was seen in the preterm SGA
children, who had a double biologic jeopardy of prematurity and
intrauterine growth restriction. Males from the study group had lower IQ
compared to male controls. Similar findings were noted by Hack, et al.
[1] in their study of VLBW children at 20 years. They also reported more
failures in school in boys than girls and this was also seen in our
study.
As the LBW children grow older, the biologic risk
factors recede in the background, and environmental factors become
important determinants of intelligence [12]. We found a significant
association between maternal education and the intelligence, even
amongst Preterm SGA subjects. Similar findings are reported in other
studies [13]. Socio-economic status also had a great impact on the
intelligence, as previously reported by Gorman, et al. [14]. The
only biologic risk factor which had some contribution to the IQ was
birth weight and this has also been reported previously [1,15].
Studies from the Western World [3] have described
single mothers as a significant risk factor for low IQ. We had only
three single mothers in our study group. A lot of stress is laid on
chronic health problems in VLBW [16] and ELBW [17] children at
adulthood. Fortunately, our LBW subjects did not have many chronic
health problems.
Many adjustment problems are described in VLBW
children [18]. However, our LBW cohort was well adjusted with
themselves, their peers and their surrounding. This may be due to the
strong family structure in India. In order to get a complete insight
into the cognitive development of LBW subjects, only IQ was not enough.
So we looked at their aptitude. We found that all LBW subjects were poor
in speed. The PTSGA infants were not only poor in speed, but also
addressed poor in mechanical reasoning. This aspect of cognition has not
been in other follow studies.
Since this was a longitudinal study, we had a mental
development quotient at 1 year, IQ at 6 and 12 years. We used these
assessments of mental development to see if prediction of the final IQ
could be done and found excellent correlation with the 6 and 12 year IQ.
This kind of prediction has not been done in any other study.
The major strength of this study was the high
participation rate over a span of 18 years. Another major strength was
the complete parental information. Since the study started in the
pre-ventilation era in India, a weakness was the small number of ELBW
babies in the cohort. This study may not be relevant today for tertiary
care units, which are saving extremely low birth weight and very
premature babies. However, there are many level II care units in India,
especially in smaller towns and this data will be very relevant for
them. Adults who were moderately premature and moderately low birth
weight are included in this study, a group that is rarely considered in
follow up studies.
Contributors: SC: conceived the study, supervised
it, wrote the manuscript and is the guarantor of the paper. MO:
Supervised data collection and analyzed data. BK: collected data. AP:
supervised the project. MH: Made home visits, ensured appointments, MGS:
.did statistical analysis.
Funding: ICMR, New Delhi; Competing interests:
None stated.
|
What is Already Known?
• Low birth weight children have a low IQ
What This
Study Adds?
• Preterm SGA children have the lowest IQ; 6
and 12 years IQ best predicts 18 year IQ.
• Maternal education and socio-economic status have a greater
impact on IQ than the biologic risk factors as the children
reach adulthood.
|
References
1. Hack M, Flannery D, Schuller M Carter L, Borowski
E, Klein N. Outcomes in young adulthood for very low birth weight
infants. N Engl J Med. 2002;346-57.
2. Saigal H, Hault A, Streiner DJ. School
difficulties at adolescence in a regional cohort of children who were
extremely low birth weight. Pediatrics. 2000;105:325-31.
3. Hack N, Klein N, Taylor GH. Long term development
outcomes of low birth weight infants. The Future Children.
1995;5:176-96.
4. Chaudhari S, Otiv M, Khairnar B, Pandit A, Hoge M,
Sayyad M. Pune low birth weight study – growth from birth to adulthood.
Indian Pediatr. 2012;49:727-32.
5. Chaudhari S, Kulkarni S, Pandit A, Deshmukh S.
Mortality and morbidity in high risk infants during a six year follow
up. Indian Pediatr. 2000;37;1314-20.
6. Chaudhari S, Otiv M, Chitale A, Pandit A, Hoge M.
Pune low birth weight study – cognitive abilities and educational
performance at twelve years. Indian Pediatr. 2004;41:121-8.
7. Singh M. Care of the Newborn. 4thedn. New Delhi:
Sagar Publications; 1979.
8. Desphande CG, Oza JM. Raven’s Progressive matrices
– Standard progressive matrices – Indian adaptation. New Delhi;
Manasayan, 2000.
9. Palsane MN. Adjustment Inventory, Pune: Anand
Agencies, 1977.
10. Nemeta GK, Seashore HG, Wesman AG. Differential
aptitude test. Psychological Corp. New York. Indian Edition by Manasayan,
New Delhi.
11. Aarnoudse-Moeris CS, Weiglas KN, van Goudoever
JB, Oosterlan J. Meta analysis of neuro behavioural outcomes in very low
birth weight children. Pediatr. 2009;124:717-28.
12. Chaudhari S, Otiv M, Chitale A, Hoge M, Pandit A,
Mote A. Biology versus environment in low birth weight children.
Indian Pediatr. 2005;42:763-70..
13. Breslau N, Paneth NS, Lucia VC. The lingering
academic deficits of low birth weight children. Pediatr.
2004;114:1035-40.
14. Gorman BK. Birth weight and cognitive development
in adolescence: causal relationship or social selection ? Social
Biology. 2003;49:13-33.
15. Conley D, Bennet NG. Is biology destiny! Birth
weight and life chances. Am Socio Rev. 2000;65:458-67.
16. Hack M, Young adult outcomes of very low birth
weight children. Semi Foet Neonat. Medicine 2000;11:127-37.
17. Saigal S, Stoskopf B, Boyle M, Paneth N, Pinelli
J, Streiner D, et al. Comparison of current health, functional
limitations, and health care use of young adults who were born with
extremely low birth weight and normal birth weight. Pediatr 2007;119:
e562-73.
18. Aylward GP. Cognitive and neuropschyologic outcomes. More than IQ
scores. Dev Disabil. Rev. 2002;8:234-40.
|
|
|
 |
|
