|
|
|
Indian Pediatr 2010;47: 761-769 |
 |
Impact of Two Regimens of Vitamin D
Supplementation on Calcium - Vitamin D - PTH Axis of Schoolgirls
of Delhi |
|
Raman K Marwaha, Nikhil Tandon*, Neha Agarwal†,
Seema Puri†, Rashmi Agarwal,
Satveer Singh and
Kalaivani Mani#
From the Department of Endocrinology and Thyroid
Research, Institute of Nuclear Medicine and Allied Sciences (INMAS),
New Delhi; *Department of Endocrinology and Metabolism, All India
Institute of Medical Sciences (AIIMS), New Delhi;
†Department of Foods and Nutrition, Institute of Home Economics,
University of Delhi, New Delhi, and #Department of
Biostatistics, All India Institute of Medical Sciences, New Delhi, India.
Correspondence to: Dr Raman K Marwaha, Department of
Endocrinology and Thyroid Research Centre,
INMAS, Delhi 110 054, India.
Email:
[email protected]
Received: January 30, 2009;
Initial review: March 6, 2009;
Accepted: October 1, 2009.
Published online: 2010 Jan 15.
PII:S097475590900056-1
|
|
Abstract
Objective: To determine the efficacy of
supplementation with oral vitamin D3 (cholecalciferol) on bone mineral
biochemical parameters of school-going girls.
Setting: Government school (government-aided) and
Private school (fee paying) in Delhi.
Design: Randomized controlled trial.
Intervention: Cholecalciferol granules (60,000 IU)
orally with water, either once in two months (two-monthly D3 group) or
once a month (one-monthly D3 group) for one year.
Participants: 290 healthy schoolgirls (6-17 y),
124 from lower socioeconomic strata (LSES) (attending government
schools) and 166 from upper socioeconomic strata (USES) (attending
private schools).
Outcome measures: Serum 25(OH)D, calcium,
phosphorus, parathyroid hormone, and alkaline phosphatase levels at 6
and 12 months after start of supplementation.
Results: At baseline, 93.7% schoolgirls
were vitamin D deficient [25(OH)D<50 nmol/L]. While significant increase
in serum calcium and decrease in alkaline phosphatase levels was noted
in both groups with both interventions, PTH response was inconsistent.
In LSES subjects, two-monthly D3 and one-monthly D3 supplementation
resulted in a significant increase in serum 25(OH)D levels by 8.3 nmol/L
and 11.0 nmol/L, respectively at 6 months (P<0.05). Similarly,
the increase in the two intervention arms in USES subjects was 10.5 nmol/L
and 16.0 nmol/L, respectively (P<0.05). In both groups, this
increase in serum 25(OH)D levels persisted at 12 months (P<0.05).
Despite supplementation with 60,000 IU of Vitamin D3 (monthly or
two-monthly), only 47% were vitamin D sufficient at the end of one year.
Conclusions: 60,000 IU of cholecalciferol,
monthly or two-monthly, resulted in a significant increase in serum
25(OH)D levels in vitamin D deficient schoolgirls.
Key words: Cholecalciferol, India, Supplementation,
Schoolgirls, Vitamin D.
|
|
A
dequate vitamin D status for
optimum bone health has received increased recognition in recent years.
Vitamin D insufficiency has been reported in healthy children, adolescents
and adults worldwide(1), which has been attributed to low vitamin D intake
and inadequate sunlight exposure(2,3). Rickets is seen in children with
severe vitamin D deficiency, but previous studies have shown that even
mild vitamin D insufficiency can have detrimental effects on bone mineral
acquisition(4,5) and bone remodeling(6,7) in adolescence. Nutrition
guidelines for optimizing bone health in children and adolescents have
focused on calcium and exercise, but have neglected vitamin D(8,9).
Furthermore, the optimal serum 25(OH)D concentrations for children and
adolescents is still a subject of debate. While most professional bodies
have recommended a daily vitamin D intake of 10mg(10), the Indian Council
of Medical Research has made no recommendation for India, with the view
that adequate sunlight exposure would provide the necessary daily vitamin
D requirement(11). However, increasing awareness of wide prevalence of
vitamin D deficiency in Asian Indian adults(12-17) and children(18-20) has
prompted a renewed discussion on the desired vitamin D intake to ensure
optimal bone health.
In the absence of results of vitamin D fortification
studies, it is not possible to evaluate the merits of food fortification
relative to the systemic use of vitamin D containing dietary
supplements(21). While several intervention trials have evaluated the role
of calcium on the bone health of growing children and adolescents(22,23),
information on the effect of vitamin D supplementation remains limited. We
planned this study with the primary objective to assess the impact of oral
vitamin D 3 (cholecalciferol)
supplementation for one year, on bone mineral biochemical parameters, in
healthy school-going girls (6-17 years) from two different socioeconomic
strata, residing in Delhi, India.
Methods
Subjects
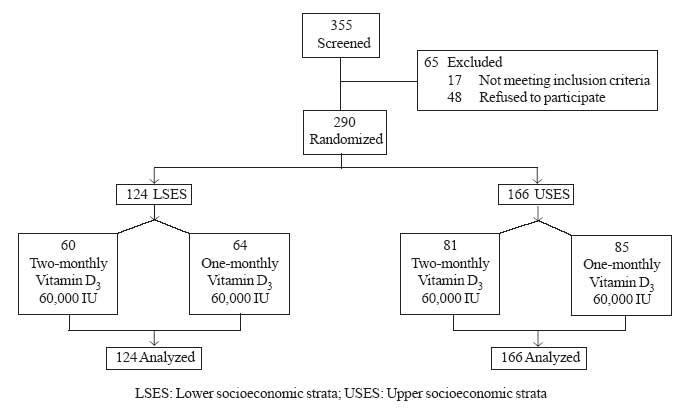
Three hundred and fifty five healthy school girls, aged
6-17 years, who responded to a request to participate, were recruited from
two schools of Delhi, which were located in geographic proximity to the
principal investigator’s institution. Socioeconomic stratification of the
subjects was based on the type of school attended. Girls studying in the
government-aided school were considered to represent the lower
socioeconomic strata (LSES, n=165), while those enrolled in the
fee-paying private school represented the upper socioeconomic strata
(USES, n=190). A convenient sample was selected because available
information in literature was limited and was based on populations
receiving food items fortified with vitamin D and with different baseline
25(OH)D levels. Children with systemic illness, endocrine disorders and
drugs affecting bone mineral health were excluded. Each class in a school
had 5 sections, and one section from each class was randomly selected. Of
the 355 girls screened, 290 girls were enrolled for the intervention after
excluding 65 girls. These 290 subjects underwent baseline assessment in
summer months (July-August, 2006).
The study protocol was approved by the institutional
ethics committee of the Institute of Nuclear Medicine and Allied Sciences
(INMAS). A prior written consent for the study was taken from the school
administration and from the parents. The details of the study design are
shown in Fig 1.
 |
|
Fig.1 Study design. |
Data collection
Anthropometric measurements and dietary information
were collected from the subjects at baseline. Standing height was recorded
to the nearest 1mm without wearing shoes and by using a wall stadiometer.
Weight was recorded to the nearest 0.1kg by using a clinical balance, with
the subject wearing light clothing. Body mass index was calculated using
the formula weight (in kg) / height (in m 2).
Every morning, the scale and stadiometer were calibrated with standard
weight and height, respectively.
Dietary information was collected using 24 hour dietary
recall and food frequency questionnaire (FFQ). The daily intake of various
food groups (cereals, pulses, fruits, vegetables, milk and milk products,
animal foods and fat) was determined using standardized recipes of the
food preparations(25). The dietary intake of nutrients was calculated as
per ICMR recommendations(11,26). Calculations for vitamin D intake were
based on US Department of Agriculture tables(27).
Blood samples were collected from subjects in the
fasting state at 0800 hours without venostasis under basal conditions for
estimation of serum calcium (Ca), phosphorus (P), alkaline phosphatase
(ALP), 25-hydroxyvitamin D [25(OH)D], and immunoreactive parathyroid
hormone (PTH) prior to initiating intervention. Serum calcium, phosphorus,
and ALP were estimated on the same day, two aliquots were stored at –20ºC
until PTH and 25(OH)D were estimated. Serum calcium (Randox Laboratory
Ltd, Crumlin, UK) and phosphorus (Clonital; Ampli Medical SPA, Milan,
Italy) were measured by colorimetric method and ALP by liquid kinetic
method (Clonital; Ampli Medical SPA, Milan, Italy). Normal laboratory
range for serum calcium was 2.02-2.60 mmol/L (8.10-10.40 mg/dL) and for
serum phosphorus in adults was 0.81-1.55 mmol/L (2.5-4.8 mg/dL), according
to the kit manufacturers. The reported upper limit of serum P in
mid-childhood is 1.87 mmol/L (5.8 mg/dL)(28).
Normal laboratory range for serum ALP at 37ºC was 100-275 IU/L in adults
and 180-1200 IU/L in children before epiphyseal closure.
Serum iPTH was measured by an immunoradiometric assay (Diasorin,
Stillwater, Min. U.S.A.; normal range13-66 pg/mL, intra and inter-assay CV
4% and 8%, respectively). Serum concentration of 25(OH)D were estimated by
radioimmunoassay (Diasorin; reference range 22.4- 93.6 nmol/L (9.0-37.6 ng/mL).
The lowest concent-ration of 25(OH)D measurable by this kit, defined as
the lowest quantity differentiated from zero at 2 SDs below the mean
counts per min of the zero standard, is 3.7 nmol/L (1.5 ng/mL).
Hypovitaminosis D was defined as serum concentration of 25(OH)D below 50
nmol/L (20 ng/mL).
Intervention
Supplementation was initiated in the winter (December,
2006) of the same year for all subjects and was carried out for a period
of one year. The subjects were randomized to two intervention groups
receiving either 60,000 IU of cholecalciferol granules (Calcirol, Cadila
Pharmaceuticals, Ahmedabad) every two months (two-monthly D 3
group; equivalent to 1000 IU/day) or every month (one-monthly D3 group;
equivalent to 2000 IU/day), for a period of one year. These doses
represent 25% and 50%, respectively of the lowest adult dose considered
likely to cause adverse effects(29).
The cholecalciferol granules were administered at the
study site, under the direct supervision of an investigator to ensure
compliance. All cholecalci-ferol sachets were from one batch of
manufacture. The cholecalciferol granules were administered orally by the
investigator followed by a drink of 100 mL of water to facilitate
swallowing. In view of our earlier studies consistently showing high
prevalence of hypovitaminosis D(20,21), and limitation of funds, it was
decided not to include a separate group receiving placebo. Estimation of
serum calcium, phosphorus, ALP, 25(OH)D and PTH were repeated at 6 and 12
months after initiating intervention. Baseline and 6 month
post-supplementation values were taken in summer months, while 12 month
post-supplementation samples were collected in winter months.
Statistical Analysis
Statistical analysis was carried out using STATA 9.0
(College Station, Texas, U.S.A.). Baseline data are presented as mean (SD)
or number (percentage) as appropriate. Effect of vitamin D 3
supplementation (once in two months and once a month) on serum Ca, P, ALP,
25(OH)D and PTH was analyzed using generalized estimating equation (GEE).
P values <0.05 were considered significant.
Results
Baseline characteristics from each socioeconomic
stratum randomized to the two intervention groups are presented in
Table I. The two groups were comparable for age. The height,
weight and BMI of USES subjects were significantly higher than LSES
subjects at all ages. USES subjects had significantly higher dietary
intake of energy, protein, fat, calcium, phosphorus and vitamin D than
LSES subjects, while they had a significantly lower intake of
carbohydrate, phytate and fiber than LSES subjects. USES had significantly
higher consumption of pulses, milk, animal foods, fruits and fat in their
daily diets as compared to LSES girls where cereals formed the major
constituent; nevertheless both the groups had daily intakes less than the
ICMR recommendations.
TABLE I


Baseline Anthropometric and Dietary Parameters of the Study Subjects [Mean(SD)]
|
|
LSES |
USES |
|
Variable |
Two-monthly |
One-monthly |
Two-monthly |
One-monthly |
|
|
D3 group (n=60) |
D3 group (n=64) |
D3 group (n=81) |
D3 group (n=85) |
|
Anthropometric |
|
Age |
12.0 (2.8) |
11.4 (3.0) |
11.6 (2.7) |
11.7 (2.8) |
|
Height (cm) |
138.2 (12.4) |
136.8 (14.3) |
146.2 (14.9) |
144.7 (13.3) |
|
Weight (kg) |
32.7 (10.1) |
31.5 (11.0) |
39.3 (12.8) |
39.9 (11.6) |
|
Height (Z score)* |
–0.9 (1.0) |
–0.6 (0.9) |
0.7 (0.9) |
0.3 (0.9) |
|
Weight (Z score)* |
–0.7 (0.7) |
–0.6 (0.7) |
0.4 (0.9) |
0.4 (0.9) |
|
BMI (kg/m2) |
16.6 (2.8) |
16.3 (3.0) |
17.8 (3.2) |
18.6 (3.3) |
|
Dietary Intake |
|
Energy (Kj) |
5324.1 (758.3) |
5426.1 (738.6) |
5758.4 (594.8) |
5817.3 (726.9) |
|
Protein (g) |
36.1 (6.6) |
36.5 (6.6) |
43.2 (6.7) |
43.9 (7.5) |
|
Carbohydrate (g) |
195.7 (32.8) |
195.7 (30.9) |
189.5 (28.2) |
193.1 (32.1) |
|
Fat (g) |
37.8 (7.9) |
39.5 (7.8) |
49.3 (5.8) |
48.8 (7.1) |
|
Dietary fiber (g) |
12.6 (7.5) |
12.8 (6.7) |
9.6 (6.7) |
9.3 (5.8) |
|
Phytate (mg) |
97.2 (57.9) |
99.6 (57.3) |
74.8 (49.4) |
86.4 (53.5) |
|
Calcium (mg) |
480.8 (191.4) |
456.3 (170.4) |
707.3 (162.9) |
670.5 (180.1) |
|
Phosphorous (mg) |
863.5 (174.5) |
850.4 (165.2) |
976.3 (141.5) |
955.4 (174.4) |
|
Vitamin D (µg) |
1.7 (1.3) |
1.5 (1.2) |
3.0 (1.3) |
2.8 (11.4) |
|
Cereals (g/d) |
190.2 (38.0) |
194.5 (41.5) |
147.1 (38.4) |
162.7 (44.9) |
|
Pulses (g/d) |
29.6 (23.1) |
34.2 (22.0) |
41.4 (25.3) |
35.3 (23.4) |
|
Vegetables (g/d) |
95.8 (54.8) |
71.1 (39.0) |
108.8 (48.9) |
110.5 (54.3) |
|
Fruits (g/d) |
20.9 (6.2) |
23.0 (6.6) |
98.4 (79.0) |
75.5 (58.3) |
|
Milk (g/d) |
234.1 (135.4) |
212.2 (108.1) |
379.4 (122.4) |
361.5 (138.6) |
|
Animal foods (g/d) |
1.7 (7.8) |
3.2 (11.4) |
9.7 (23.2) |
17.5 (29.6) |
|
Fats (g/d) |
20.9 (6.2) |
22.9 (6.6) |
23.4 (6.1) |
23.9 (6.2) |
LSES: Lower socioeconomic strata; USES: Upper socioeconomic strata; BMI: Body Mass Index;

*Height and weight Z scores were calculated based on the reference values provided by Agarwal, et al.(24).
|
The effect of vitamin D supplementation on biochemical
and hormonal parameters is depicted in Table II.
At baseline, 15.3% LSES and 0.6% USES subjects, respectively(P=0.001),
had serum calcium values below the kit normal range. While serum calcium
improved with vitamin D supplementation, there was no significant
difference in the effect of the two intervention regimens on serum calcium
within LSES and USES groups.
Elevated ALP (>1200 IU/L) was noted in 1.6% LSES
subjects and none of the USES subjects. ALP levels decreased significantly
after supplementation at 6 and 12 months with reference to baseline in
both intervention groups and in both SES subjects (Table II).
Further, no significant difference was found between the two intervention
arms in both LSES and USES.
TABLE II


Effect of Vitamin D supplementation on Serum Calcium, Phosphorous, Alkaline Phosphatase,

25(OH)D and Parathyroid Hormone
| |
Lower socioeconomic group |
|
Upper socioeconomic group |
|
|
Parameter |
Two-monthly |
One-monthly |
Mean |
(95% CI) |
P |
Two-monthly |
One-monthly |
Mean |
95% CI |
P |
|
[Mean (SE)] |
D3 group |
D3 group |
difference |
|
value |
D3 group |
D3 group |
difference |
|
value |
|
|
|
(n=60) |
(n=64) |
|
|
|
(n=81) |
(n=85) |
|
|
|
Serum calcium (mmol/L) |
|
Baseline |
2.23(0.03) |
2.25(0.02) |
-0.01 |
(-0.09, 0.06) |
0.68 |
2.30(0.01) |
2.32(0.01) |
-0.01 |
(-0.04,0.01) |
0.19 |
|
6 mo |
2.28(0.02) |
2.32(0.02)* |
-0.04 |
(-0.11, 0.01) |
0.17 |
2.50(0.01)* |
2.50(0.01)* |
-0.01 |
(-0.04, 0.03) |
0.76 |
|
12 mo |
2.52(0.01)#,$ |
2.53(0.01)#,$ |
-0.01 |
(-0.04, 0.01) |
0.37 |
2.61(0.01)#,$ |
2.63(0.01)#,$ |
-0.01 |
(-0.03, 0.01) |
0.30 |
|
Serum phosphorous (mmol/L) |
|
Baseline |
1.55(0.04) |
1.50(0.03) |
0.05 |
(-0.05, 0.1) |
0.35 |
1.37(0.02) |
1.35(0.020 |
0.02 |
(-0.04, 0.08) |
0.51 |
|
6 mo |
1.47(0.04) |
1.49(0.03)* |
-0.02 |
(-0.124, 0.086) |
0.72 |
1.43(0.02)* |
1.44(0.02)* |
-0.01 |
(-0.07, 0.05) |
0.80 |
|
12 mo |
1.56(0.03)$ |
1.59(0.03)#,$ |
0.03 |
(-0.121, 0.064) |
0.55 |
1.47(0.02)#,$ |
1.45(0.02)# |
0.03 |
(-0.04, 0.09) |
0.43 |
|
Serum alkaline phosphatase (IU/L) |
|
Baseline |
576.38(34.62) |
506.29(27.16) |
70.08 |
(-16.16, 156.3) |
0.11 |
353.82(18.10) |
371.13(17.70) |
-17.30 |
(-66.9, 32.3) |
0.49 |
|
6 mo |
375.46(21.65)* |
361.78(20.46)* |
13.67 |
(-44.72, 72.07) |
0.65 |
213.40(13.12) |
220.81(13.40) |
-7.45 |
(-44.27, 29.36) |
0.691 |
|
12 mo |
283.22(17.55)#,$ |
269.60(15.25)#,$ |
13.61 |
(-31.97, 59.19) |
0.56 |
222.70(13.60) |
204.83(11.40) |
-17.85 |
(-16.8, 52.56) |
0.313 |
|
Serum 25(OH)D(nmol/L) |
|
Baseline |
31.20(1.68) |
32.93(1.37) |
-1.72 |
(-5.98, 2.53) |
0.43 |
29.13(1.54) |
30.80(1.39) |
-1.66 |
(-5.74, 2.41) |
0.426 |
|
6 mo |
39.53(2.01)* |
43.90(1.50)* |
-4.36 |
(-9.30, 0.56) |
0.08 |
39.55(1.24)* |
46.81(1.45)* |
-7.25 |
(-11.00, -3.51) |
0.001 |
|
12 mo |
53.0(3.05)#,$ |
59.33(2.64)#,$ |
-6.34 |
(-14.27, 1.58) |
0.12 |
38.25(2.13)# |
49.94(2.01)# |
-11.69 |
(-17.44, -5.95) |
0.001 |
|
Serum parathyroid hormone (pg/mL) |
|
Baseline |
36.41(2.63) |
37.64(2.19) |
-1.23 |
(-7.95, 5.48) |
0.72 |
34.40(2.00) |
34.98(2.51) |
-0.58 |
(-6.88, 5.72) |
0.86 |
|
6 mo |
29.10(2.35)* |
30.87(1.82)* |
-1.77 |
(-7.61, 4.05) |
0.55 |
26.90(1.77)* |
28.35(1.74)* |
-1.44 |
(-6.31, 3.40) |
0.56 |
|
12 mo |
60.81(4.07)#,$ |
55.96(3.08)#,$ |
4.84 |
(-5.16, 1.48) |
0.34 |
34.66(2.54)$ |
35.01(2.58)$ |
-0.35 |
(-7.45, 6.75) |
0.92 |
LSES: Lower socioeconomic strata; USES: Upper socioeconomic strata; Two-monthly D3 group: Vitamin D (60,000 IU)

once in two months; One-monthly D3 group: Vitamin D (60,000IU) once a month;

* = P<0.05 for baseline vs. 6 month;   # = P<0.05 for baseline vs. 12 month; $ = P<0.05 for 6 months vs. 12 month.
|
In the study population, 93.7% girls (97.5% vs. 90.9%
in LSES and USES, respectively) were found to be vitamin D deficient at
baseline. In LSES group, this prevalence declined from 98% to 74% to 38%
in two-monthly D3
group and from 97% to 69% to 28% in one-monthly D3
group at 6 and 12 months post-supplementation, respectively. However, in
USES strata, the percentage of vitamin D deficient girls decreased from
94% to 84% to 80% in two-monthly D3 group and 88% to 68% to 57% in
one-monthly D3
group at 6 and 12 months of supplementation, respectively.
Mean serum PTH noted at initiation of study in LSES and
USES subjects was 37.14 (SD 18.77) pg/mL and 34.70 (SD 20.84) pg/mL,
respectively (P=0.30). A similar proportion of LSES (8.1%) and USES
(7.2%) subjects had elevated PTH values.
Discussion
Several studies from across the world, including India,
have shown a high prevalence of vitamin D deficiency in children and
adolescents(1,20,21). In India, where there is no fortification of food
with vitamin D, supplementation remains an important alternative for
improving the vitamin D status of individuals. As reviewed by Vieth(30),
there are several studies evaluating the efficacy of vitamin D
supplementation in adults. However, limited information is available
assessing the impact of vitamin D supplementation on bone mineral
parameters in children and adolescents(31-39).
As reviewed recently, most experts agree that in the
absence of adequate sun exposure, children and adults need 800-1000 IU of
vitamin D/day(1). Since data from several workers in India suggest a high
prevalence of vitamin D deficiency(12-21), we considered evaluating two
dose strengths; namely, the equivalent of 1000 units/day and 2000
units/day. Oral vitamin D 3
supplementation with a dose equivalent to 1000-2000 units/day for 1 year
was safe, and increased serum 25(OH)D concentrations significantly in both
upper and lower socio-economic strata. However, despite the supplementation,
only 47% of schoolgirls studied became vitamin D sufficient. The mode and
frequency of administration of vitamin D3, and the extent and possible chronicity of hypovitaminosis D in the study population may in part
explain this observation.
Two important observations need to be highlighted. It
is an established fact that serum 25(OH)D levels in volunteers in Delhi
are lower when measured in winter as compared with summer(17). This
anticipated decline in serum 25(OH) D levels during winter was overcome by
the vitamin D supplementation, especially in the LSES group. Secondly,
monthly supplementation (equivalent to 2000 IU D3 /day)
was superior to two-monthly supplementation (equivalent to 1000 IU
D3/day), though this effect was significant only in the USES.
The superiority of a higher dose of vitamin D was also
reported by Fuleihan, et al.(34) and Maalouf, et al.(36)
comparing 200 IU vs. 2000 IU of vitamin D/day, and by Viljakainen,
et al.(35), comparing 200 IU vs. 400 IU of vitamin D per
day. Maalouf, et al.(36) reported that in children and adolescents
with serum 25(OH)D concentration below 20 ng/mL (i.e. <50 nmol/L),
a vitamin D3 dose equivalent to 2000 IU/day resulted in desirable vitamin D levels. In a study assessing only
winter time vitamin D2 supplementation in Finnish girls, prevalence of hypovitaminosis D was significantly reduced in those receiving vitamin
D(4). The supplementation had more effect on those with severe
hypovitaminosis D than those with normal vitamin D levels at baseline. In
a similar study assessing the impact of winter time supplementation of
vitamin D3 in French male adolescents, Guillemant, et al.(31),
reported that a monthly dose of 50,000 IU was adequate to prevent the
decline in serum 25(OH)D levels usually observed in winter.
The increment in serum 25(OH)D levels in response to
monthly D 3 supplementation in the
present study was significantly less than that reported by Maalouf, et
al.(36), using a comparable dose of D3. The possible reasons for the
differences in outcome between the two studies could be as follows: use of
oil containing vitamin D3 preparation by Maalouf, et al.(36), in
contrast to the direct ingestion of granulated vitamin D3 followed by
water in our study; weekly delivery versus monthly delivery of vitamin D3;
and, differences in the mean baseline calcium intake and severity of hypovitaminosis D in the study population.
Vitamin D supplementation resulted in a significant
increase in serum calcium in both intervention arms (two-monthly and
one-monthly D3 groups) of both
socioeconomic strata. This has also been reported by other workers(33,35).
Similarly, both interventions resulted in a decline in ALP in both SES,
with the maximum decline observed at 6 months in both groups. However, Maalouf, et al.(36) also showed a significant reduction in ALP at
12 months with both low (200 IU/day) and high (2000 IU/day) doses of
vitamin D3 but the reduction at 6 months was not significant. In contrast, Rajakumar, et al.(33) showed decline in ALP with a lower vitamin D
dose of 400 IU/day, after one month of intervention.
The inconsistent PTH response showing a decline at 6
months, but tendency to rise at 12 months, underscore the fact that PTH
levels are under multi-factorial regulation(40). One possible explanation
could be that PTH-mediated raised bone turnover is an essential component
of the maturation process during this life stage. In a study involving
Finnish adolescents, vitamin D supplementation reduced PTH levels only if
the subjects were vitamin D insufficient at baseline(35). In contrast,
using a similar dose of vitamin D, Rajakumar, et al.(33) showed no
effect of vitamin D supplementation on PTH levels, even in those who were
vitamin D insufficient. In view of these varied observations, there is a
need for more studies to evaluate the response of PTH to vitamin D
supplementation in different regimens, age groups and severity of
underlying vitamin D deficiency.
Certain limitations of the present study need to be
highlighted. Firstly, due to constraints in the study conditions, the
cholecalciferol granules had to be given to the subjects with water
instead of milk or an oily preparation. Secondly, due to lack of
permission from the school authorities, pubertal staging could not be
carried out. Thirdly, due to procedural delay, the intervention was
initiated in the winter, while the baseline assessment was performed in
summer months. Finally, since serum albumin was not measured, we have not
provided corrected values of serum calcium. Thus, in the absence of food
fortified with vitamin D, monthly supplementation providing the equivalent
of 2000 IU of Vitamin D3 /day may be
the preferred approach to combat the prevalence of hypovitaminosis D in
Indian school girls.
Contributors: RKM and NT: design of the
study, collection and analysis of data, and writing of the manuscript; NA:
collection and analysis of data and writing of the manuscript; SP: design
of the study, analysis and writing of the manuscript; RA: collection of
data and quality assurance; KM: design of the study and analysis of data;
and SS: laboratory assays. RKM and NT are to be considered as joint first
authors.
Funding: Grant from Institute of Nuclear
Medicine and Allied Sciences (INMAS), New Delhi, India (Project No. TC/2519-INM-04).
Competing interests: None stated.
|
What This Study Adds?
•
60,000 IU of cholecalciferol,
monthly or two-monthly, results in a significant increase in serum
25(OH)D levels in vitamin D deficient school girls.
|
References
1. Holick MF. Vitamin D deficiency. N Engl J Med
2007; 357: 266-281.
2. El-Hajj Fuleihan G, Deeb M. Hypovitaminosis D in a
sunny country. N Engl J Med 1999; 340: 1840-1841.
3. Gannage-Yared MH, Chemali R, Yaacoub N, Halaby G.
Hypovitaminosis D in a sunny country: relation to lifestyle and bone
markers. J Bone Miner Res 2000; 15: 1856–1862.
4. Lehtonen-Veromaa M, Mottonen T, Nuotio I, Irjala K,
Viikari J. The effect of conventional vitamin D 2
supplementation on serum 25(OH) D concentration is weak among peripubertal
Finnish girls: a 3-y prospective study. Eur J Clin Nutr 2002; 56: 431–437.
5. Cheng S, Tylavsky F, Kröger H, Kärkkäinen M,
Lyytikäinen A, Koistinen A, et al. Association of low
25-hydroxyvitamin D concentrations with elevated parathyroid hormone
concentrations and low cortical bone density in early pubertal and
prepubertal Finnish girls. Am J Clin Nutr 2003; 78: 485-492.
6. Outila TA, Karkkainen MU, Lamberg-Allardt CJ.
Vitamin D status affects serum parathyroid hormone concentrations during
winter in female adolescents: associations with forearm bone mineral
density. Am J Clin Nutr 2001; 74: 206-210.
7. Fares JE, Choucair M, Nabulsi M, Salamoun M, Shahine
CH, El-Hajj Fuleihan G. Effect of gender, puberty, and vitamin D status on
biochemical markers of bone remodeling. Bone 2003; 33: 242–247.
8. Baker SS, Cochran WJ, Flores CA, Georgieff MK,
Jacobson MS, Jaksic T, et al. American Academy of Pediatrics
Committee on Nutrition. Calcium requirements of infants, children
and adolescents. Pediatrics 1999; 104: 1152–1157.
9. Weaver CM, Peacock M, Johnston CC. Adolescent
nutrition in the prevention of postmenopausal osteoporosis. J Clin
Endocrinol Metab 1999; 84: 1839-1843.
10. Whiting SJ, Calvo MS. Dietary recommendations for
vitamin D: a critical need for functional end points to establish an
estimated average requirement. J Nutr 2005; 135: 304-309.
11. Gopalan C, Ramasastry BV, Balasubramaniam SC.
Nutritive Value of Indian Foods. Hyderabad, India: Indian Council of
Medical Research (ICMR); 2001.
12. Arya V, Bhambri R, Godbole MM, Mithal A. Vitamin D
status and its relationship with bone mineral density in healthy Asian
Indians. Osteoporos Int 2004; 15: 56-61.
13. Sachan A, Gupta R, Das V, Agarwal A, Awasthi PK,
Bhatia V. High prevalence of vitamin D deficiency among pregnant women and
their newborns in northern India. Am J Clin Nutr 2005; 81: 1060-1064.
14. Harinarayan CV, Ramalakshmi T, Prasad UV, Sudhakar
D, Srinivasarao PVLN, Sarma KVS, et al. High prevalence of low
dietary calcium, high phytate consumption, and vitamin D deficiency in
healthy south Indians. Am J Clin Nutr 2007; 85: 1062-1067.
15. Malhotra N, Mithal A, Gupta S, Godbole MM. Effect
of vitamin D supplementation on the bone health parameters of healthy
young Indian women. Osteoporos Int 2008; 19(Suppl 1): S29-S207.
16. Goswami R, Gupta N, Goswami D, Marwaha RK, Tandon
N, Kochupillai N. Prevalence and significance of low 25-hydroxyvitamin D
concentrations in healthy subjects in Delhi. Am J Clin Nutr 2000; 72:
472-475.
17. Tandon N, Marwaha RK, Kalra S, Gupta N, Dudha A,
Kochupillai N. Bone mineral parameters in healthy young Indian adults with
optimal vitamin D availability. Nat Med J Ind 2003; 16: 298-301.
18. Agarwal KS, Mughal MZ, Upadhyay P, Berry JL, Mawer
EB, Puliyel JM. The impact of atmospheric pollution on vitamin D status of
infants and toddlers in Delhi, India. Arch Dis Child 2002; 87: 111-113.
19. Marwaha RK, Tandon N, Reddy DHK, Agarwal R, Singh
R, Sawhney RC, et al. Vitamin D and bone mineral density status of
healthy school children in northern India. Am J Clin Nutr 2005; 82:
477-482.
20. Puri S, Marwaha RK, Agarwal N, Tandon N, Agarwal R,
Grewal K, et al. Vitamin D status of apparently healthy schoolgirls
from two different socioeconomic strata in Delhi: relation to nutrition
and lifestyle. Br J Nutr 2008; 99: 876-882.
21. Tylavsky FA, Cheng S, Lyytika A, Viljakainen H,
Lamberg-Allardt C. Strategies to improve vitamin D status in northern
European children: exploring the merits of vitamin D fortification and
supplementation. J Nutr 2006; 136: 1130–1134.
22. Cameron MA, Paton LM, Nowson CA, Margerison C,
Frame M, Wark JD. The effect of calcium supplementation on bone density in
premenarcheal females: A co-twin approach. J Clin Endocrinol Metab 2004;
89: 4916–4922.
23. Matkovic V, Goel PK, Badenhop-Stevens NE, Landoll
JD, Li B, Ilich JZ, et al. Calcium supplementation and bone mineral
density in females from childhood to young adulthood: A randomized
controlled trial. Am J Clin Nutr 2005; 81: 175–188.
24. Agarwal DK, Agarwal KN, Upadhyay SK , Mittal R,
Prakash R, Rai S. Physical and sexual growth pattern of affluent Indian
children from 5-18 years of age. Indian Pediatr 1992; 29: 1203-2082.
25. Khanna K, Gupta S, Seth R, Mahana R, Rekhi T. The
Art and Science of Cooking 3rd ed. New Delhi: Phoenix Publishing
House; 1998.
26. Indian Council of Medical Research. Nutrient
Requirements and Recommended Dietary Allowances for Indians. New Delhi:
ICMR; 2004.
27. United States Department of Agriculture.
Provisional table on the Vitamin D content of foods. US: Human Nutrition
Information Service, HNIS/PT-108; 1999.
28. Portale AA. Blood calcium, phosphorus and
magnesium. In: Favus MJ, editor. Primer on the Metabolic Bone Diseases and
Disorders of Mineral Metabolism, 2nd ed. New York: Raven Press; 1997. p.
87-90.
29. Vieth R, Chan P, MacFarlane GD. Efficacy and
safety of vitamin D 3 intake
exceeding the lowest observed adverse effect level. Am J Clin Nutr 2001;
73: 288-294.
30. Vieth R. Vitamin D supplementation,
25-hydroxyvitamin D concentrations, and safety. Am J Clin Nutr 1999; 69:
842–856.
31. Guillemant J, Le HT, Maria A, Allemandou A, Peres
G, Guillemant S. Wintertime vitamin D deficiency in male adolescents:
effect on parathyroid function and response to vitamin D3 supplements.
Osteoporos Int 2001; 12: 875–879.
32. Cheng S, Lyytikäinen A, Kröger H, Lamberg-Allardt
C, Alén M, Koistinen A, et al. Effects of calcium, dairy product,
and vitamin D supplementation on bone mass accrual and body composition in
10-12-year-old girls: a 2-year randomized trial. Am J Clin Nutr 2005; 82:
1147–1148.
33. Rajakumar K, Fernsttrom JD, Janosky JE, Greenspan
SL. Vitamin D insufficiency in preadolescent African-American children.
Clin Pediatr 2005; 44: 683-692.
34. El-Hajj Fuleihan G, Nabulsi M, Tamim H, Maalouf J,
Salamoun M, Khalifeh H, et al. Effect of Vitamin D replacement on
musculoskeletal parameters in school children: A randomized controlled
trial. J Clin Endocrinol Metab 2006; 91: 405–412.
35. Viljakainen HT, Natri AM, Kärkkäinen M, Huttunen
MM, Palssa A, Jakobsen J, et al. A positive dose-response effect of
vitamin D supplementation on site-specific bone mineral augmentation in
adolescent girls: a double-blinded randomized placebo-controlled 1-year
intervention. J Bone Miner Res 2006; 21: 836-844.
36. Maalouf J, Nabulsi M, Vieth R, Kimball S, Rasi RE,
Mahfoud Z, et al. Short term and long term safety of weekly high
dose vitamin D 3
supplementation in school children. J Clin Endocrin Metab 2008; 93:
2693-2701.
37. Docio S, Riancho JA, Perez A, Olmos JM, Amado JA,
Gonzallez-Macias J. Seasonal deficiency of vitamin D in children: a
potential target for osteoporosis preventing strategies? J Bone Miner Res
1998; 13: 544-548.
38. Oliveri B, Cassinelli H, Mautalen C, Ayala M.
Vitamin D prophylaxis in children with a single dose of 150000 IU of
vitamin D. Eur J Clin Nutr 1996; 50: 807-810.
39. Dahifar H, Faraji, A, Ghorbani A, Yassobi S.
Impact of dietary and lifestyle on vitamin D in healthy student girls aged
11-15 years. J Med Invest 2006; 53: 204-208.
40. Guillemant J, Cabrol S, Allemandou A, Peres G,
Guillemant S. Vitamin D-dependent seasonal variation in growing male
adolescents. Bone 1995; 17: 513-516.
|
|
|
 |
|
