M
ost evidence to guide clinical
decision
making comes from observational and
experimental studies [1]. These involve
statistical comparisons between groups based on outcomes or exposures.
The choice of a particular statistical test for
analysis depends on the objectives of the study. As the objectives are
decided in the protocol, the statistical tests are also chosen at this
time itself. One needs to determine whether a statistical test is needed
for a research objective, and if yes, then which statistical test
is best suited. Inexpe-rienced researchers are often confused while
choosing the appropriate statistical test to examine the hypothesis.
Most published articles are directed towards describing the various
statistical tests, rather than explaining how to choose the appropriate
statistical test [2,3]. Those which deal with application of statistical
tests are often focused on related issues (including the mathematical
equations) such that there is a reduced focus on the basic theoretical
concepts which would have helped to understand the principles of
selection of the respective test [4,5].
This article aims to provide practical tips to novice
researchers to approach the application of basic statistical tests for
comparing groups in medical research.
Hypothesis Testing
Statistical tests are used to test hypotheses.
Hypothesis is a prediction about a new phenomenon. It makes a statement
about the existence of a relationship or effect of a factor on a
phenomenon [6]. The objectives which are descriptive in nature, rather
than comparative, have no hypothesis to test, and do not need of any
statistical test. The researcher just wants to see what is there rather
than to compare [7]. In case of more than one objective, statistical
tests may be applicable on certain objectives but not on others.
Let us consider the following objectives: i)
To estimate the proportion of children who are completely vaccinated in
a given community; and ii) To determine the effect of an
educational intervention on child immunization coverage in a given
geographical area. The first objective does not intend to predict
anything or does not state any possible relationship or effect of a
factor on a phenomenon and therefore, is not a hypothesis statement.
Hence, no statistical test will be needed for this objective. The second
objective tries to find the impact of factor X (educational
intervention) on phenomenon B (child immunization coverage). This being
a hypothesis statement, will require a statistical test.
For hypothesis testing, the statistical tests attempt
to reject the null hypothesis. Null hypothesis makes the
assumption that there is no difference between the two groups or there
is no relationship between the two variables. We apply statistical tests
to find whether the null hypothesis is true or false. The P value
obtained from a statistical test is the probability that both the groups
come from the same population rather than two different populations. In
simple terms, it is the probability that the difference observed between
the two groups is a chance finding. The lower the P value, the
lesser the probability that the observed difference is by chance [8].
Statistical tests either reject or accept the null hypothesis, depending
on whether the P value is less than 0.05 or more than or equal to
0.05, respectively [9].
Comparison Between Two Groups
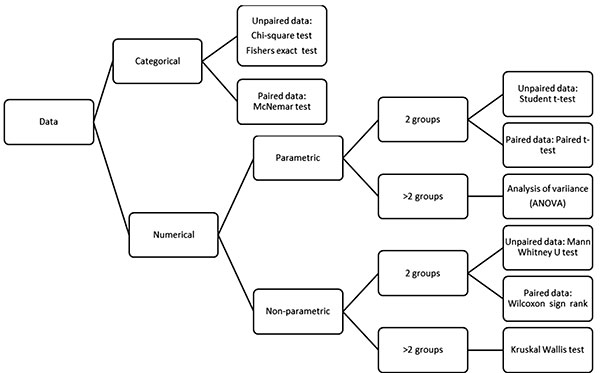
An algorithm to choose an appropriate statistical
test for comparison is given in Fig 1. Parametric tests require
estimation of variables that define the underlying distribution of data,
like mean and standard deviation for normally distributed data [10].
Simply put, when means are compared, the tests used are known as
parametric, whereas for comparison of medians or categorical variables,
the tests used are referred to as nonparametric.
 |
|
Fig. 1 Algorithm to decide the
appropriate statistical test in medical research.
|
When variable X is compared between two (or more)
groups, we decide about the type of data and whether data are paired or
not.
Types of Data
Categorical or Continuous Data
The first step is to ascertain the type of data being
compared. For most practical purposes, data can be considered as
categorical or continuous [11]. A variable such as sex (male/female) or
intensity of pain (mild, moderate, severe) where responses will be
grouped in one or more categories are categorical variables. They are
called nominal when there is no order or grade, and ordinal when they
are graded or ordered. Continuous data are those where each observation
gets a score. It can be an interval data wherein there is no absolute
zero like intelligence quotient scores or temperature in Celsius or
ratio data or when an absolute zero exists like heart rate, number of
episodes of diarrhea and age.
Continuous data can be transformed to categorical
data by applying cut-offs e.g., hemoglobin level is continuous data, but
can be converted into categorical data i.e., anemic and non-anemic by
applying cut-offs for classifying anemia. However, such conversions must
be avoided because it leads to a loss of data, and also reduces the
power. Dichotomization leads to loss of variability and dichot-omizing
at the median value leads to loss of power by one-third. The values near
either side of the cut-off, go far away in two categories in this
conversion [10]. Care should also be taken to choose appropriate cut-off
points. It is preferable to use already recognized cut-offs or they
should be justified and decided a priori, before the beginning of
the study.
Quantitative data should be decided and mentioned
a priori, whether they will be considered as continuous or
categorical data for the purpose of statistical analysis.
Paired or Unpaired Data
The second step to decide about the statistical test
is to find out whether the data is paired or unpaired. Data is
considered to be paired if: i) Two measurements are taken from
the same individual either at two different time points e.g., before and
after an intervention or exposure; or at the same time but for two
different tests to be compared e.g., when comparing two or more
diagnostic tests; ii) Measurements are taken from pairs of
subjects which have been matched at the time of inclusion; and iii)
Data from siblings and twins are also considered as paired [13].
Comparing Categorical Variables
Data such as sex (male or female); disease status
(diseased or healthy) and risk factor (present or absent) is categorical
in nature. The frequency distribution of two or more categorical
variables is presented in a matrix format called as contingency tables
or crosstabs.
Pearson chi-square or just chi-square test is applied
to compare this kind of data. Being a non-parametric test, it is robust
with respect to the distribution of data. Even though there is no limit
on the number of rows and columns, to meet the assumptions of chi-square
test and for ease of interpretation, too many cells must be avoided
[14]. For each cell in a contingency table, expected cell count can be
calculated by the product of row total and column total, divided by the
grand total. The assumptions for chi-square test are given in Box I.
|
Box I Assumptions for Chi-square Test
• Only two variables can be taken into
consideration, both of which must be categorical.
• The cell values must be in counts or
frequencies. Percentages or means or any other transformation of
data.
• The two samples or groups are independent of each other. They
data should not be paired. The expected count in all cells
must be at least 1, and in more than four-fifths of the cells must
be more than 5.
|
Mc Nemar test should be used, while comparing paired
categorical data [15]. Chi-square test is also not helpful when the
numbers in the table are small. In such instances, Yate correction or
Fisher exact test is applied. A general rule of thumb to apply Yate
correction is when the sum of all the values in the cells is less than
100 or the value in any one cell is less than 10 [16]. In contingency
tables, if more than one-fifth of the cells the expected values are less
than 5, chi-square test is inappropriate and Fisher exact test may be
more appropriate [16]. When reporting results of a chi-square test the
style of individual journal should be checked – at Indian Pediatrics,
we only ask that the P value must be reported.
Comparing Quantitative Variables
Quantitative variables may be of various types such
as discrete or continuous, as described previously, and ratio or
interval (not described here). Usually these are summarized as mean or
median, for normally and non-normally distributed data, respectively.
The distribution of data can be checked either by generating a histogram
and examining it visually or by using a statistical test such as
Shapiro-Wilk test. A quick (but less accurate) way to assess the
normality of data is to compare the mean and standard deviation (SD). If
mean is nearly similar to median and the mean is more than 2-3 times of
SD, then it can be considered ‘normally distributed’. However,
this should only be used when sample size is more than 50 [17,18].
Even for ordinal data or non-normal distribution,
with a reasonably large sample size, parametric tests can be used. A
rule of thumb states that while comparing 2-9 groups if each group has
more than 15 observations then the sample is sufficiently large [19].
Variances
While choosing tests, another parameter to consider
is the equality of variances in the two groups. This can be checked by
Levene test. Parametric tests are best when the variances in the two
groups to be considered are equal. Even when one variance is up to 2-3
times the other, parametric tests can be used. However, if the
difference in variances is greater, a parametric test is no longer
valid.
For comparing quantitative data between two groups,
the parametric tests used are Student t-test (for unpaired data)
and paired t-test (paired data). For more than two groups,
Analysis of Variance (ANOVA) is the appropriate test to use. While
applying the Student t-test or ANOVA some assumptions must be met
as given in Box II.
|
Box II Assumptions for Student t test
or One-way ANOVA
• Data must be quantitative (represented by
mean)
• The sample must have been randomly drawn from
the population
• The data should be normally distributed
• Similar variances in the two groups
• Reasonably large (>15 in each group) sample
size
• Independent or unpaired data
• Robust to violations of normality distribution assumption
|
Parametric tests are preferred because of higher
statistical power as they have a greater chance to detect a
statistically significant difference, if a difference actually exists
[20]. In cases where data are not normally distributed, an attempt can
be made to transform it (to normal distribution), so that a parametric
test may become applicable. Taking natural logarithms (log
transformation) or squares of values are some methods that can be used
to transform data. For larger studies (sample size >200), parametric
tests can and should be used even for skewed data [21]. While reporting
a result of a t-test, its important to mention the number of
observations in each group, the mean and SD of each group, and the P
values associated with it.
The non-parametric equivalent (to compare medians)
are Mann-Whitney U-test (unpaired data) and Wilcoxon sign rank
test (paired data). When comparing between more than two groups, Kruskal
Wallis test is the non-parametric equivalent of the parametric analysis
of variance (ANOVA).
This article focuses on bivariate analysis.
Multivariate analysis which adjusts for the confounding effects of the
independent variables or the predictors is beyond the scope of this
article. Bivariate analysis often helps to identify variables for
developing multivariable regression models. The statistical tests used
to compare sensitivity and specificity etc. in diagnostic studies are
also based on the principles described in the article.
CONCLUSION
Comparisons of data points using statistical tests
form an important aspect of hypothesis testing in evidence-based
research. The type and distribution of data, and pairing status, are
helpful to decide the appropriate statistical test (Box III). The
algorithm presented in the paper will be helpful in decision making.
Chi-square, Student t-test, Mann Whitney U test,
and ANOVA are some of the statistical tests used commonly in
medical research. The assumptions for the tests must be met when
applying a particular statistical test.
|
Box III Illustration of Use of Algorithm to
Decide an Appropriate Test
We want to compare hemoglobin levels after a
randomized control trial using oral iron supplements between the
treatment and placebo groups.
Step 1. What is the type of variable?
Haemoglobin (Hb) is a quantitative variable and is continuous. This
will help us determine whether we need to apply tests for
categorical data or quantitative data.
Step 2. What is the distribution (normal or
not normal) of Hb levels? This can be done by a visual inspection of
a histogram or by applying the statistical test (Shapiro Wilk) to
test for normality. This will help us determine whether we should
use parametric or non-parametric test.
Step 3. Are the groups paired or matched? If paired, you
will use paired tests (paired t-test) else a Student’s
t-test would suffice.
|
Funding: None; Competing interest: None
stated.
REFERENCES
1. Röhrig B, du Prel JB, Wachtlin D, Blettner M.
Types of study in medical research: Part 3 of a series on evaluation
of scientific publications. Dtsch Arztebl Int. 2009;106:262-8.
2. Thomas E. An introduction to medical
statistics for health care professionals: Basic statistical tests.
Musculoskelet Care. 2005;3: 201-12.
3. Ali Z, Bhaskar SB. Basic statistical tools in
research and data analysis [published correction appears in Indian J
Anaesth. 2016;60:790]. Indian J Anaesth. 2016;60:662-9.
4. Nayak BK, Hazra A. How to choose the right
statistical test? Indian J Ophthalmol. 2011;59:85-6.
5. Marusteri M, Bacarea V. Comparing groups for
statistical differences: How to choose the right statistical test?
Biochem Med (Zagreb). 2010;20:15-32.
6. Price PC, Jhangiani R, Chiang ICA. Developing
a hypothesis. In: Research Methods in Psychology. Pressbooks,
2017. Accessed July 29, 2020. Available from: https://open
text.wsu.edu/carriecuttler/chapter/developing-a-hypothesis/
7. Swinscow TDV. Study design and choosing
a statistical test. In: Statistics at Square One 9th
Ed (Revised by MJ Campbell) BMJ Books, 1996.
8. Goodman SN. P value hypothesis and likelihood:
Implications for epidemiology of a neglected historical debate. Am J
Epidemiol. 1993;137:485-96.
9. Indrayan A, Satyanarayana L. Basic philosophy
of statistical tests, confidence intervals and sample size
determination. Indian Pediatr. 2000;37:739-51.
10. Whitley E, Ball J. Statistics review 6:
Nonparametric methods. Crit Care. 2002;6:509-13.
11. Swinscow TDV. Data display and summary.
In: Statistics at Square One. 9th Ed (Revised by MJ Campbell.):
BMJ Books, 1996.
12. Altman DG, Royston P. The cost of
dichotomising continuous variables. BMJ. 2006;332:1080.
13. Kirkwood BR, Sterne JAC. Essential Medical
Statistics, 2nd ed. Blackwell; 2003.
14. McHugh ML. The Chi-square test of
independence. Biochem Med (Zagreb). 2013;23:143-9.
15. Trajman A, Luiz RR. McNemar test revisited:
Comparing sensitivity and specificity of diagnostic examina-tions. Scand
J Clin Lab Invest. 2008,68:77-80.
16. Swinscow TDV. The Chi-squared tests. In:
Statistics at Square One. 9th Ed (Revised by MJ Campbell) BMJ Books,
1996.
17. Jeyaseelan L. Short Training Course Materials
on Fundamentals of Biostatistics, Principles of Epidemiology and
SPSS. CMC Vellore: Biostatistics Resource and Training Center
(BRTC); 2007.
18. Mishra P, Pandey CM, Singh U, et al.
Descriptive statistics and normality tests for statistical data. Ann
Card Anaesth. 2019;22:67-72.
19. Norman G. Likert scales, levels of
measurement and the "laws" of statistics. Adv Health Sci Edu.
2010;15:625–32.
20. Rana RK, Singhal R, Dua P. Deciphering the
dilemma of parametric and nonparametric tests. J Pract Cardiovasc
Sci. 2016;2:95-8.
21. Fagerland, MW. t-tests, non-parametric tests, and large studies -
A paradox of statistical practice? BMC Med Res Methodol. 2012;12:78.


