|
|
|
Indian Pediatr 2018;55:972-974 |
 |
Comparison of Outcomes
using Pediatric Index of Mortality (PIM) -3 and PIM-2 Models in
a Pediatric Intensive Care Unit
|
|
Jhuma Sankar, Krishna Mohan Gulla, U Vijaya Kumar,
Rakesh Lodha and SK Kabra
From Department of Pediatrics, All India Institute of
Medical Sciences, New Delhi, India.
Correspondence to: Dr Jhuma Sankar, Assistant
Professor, Department of Pediatrics, AIIMS, New Delhi, India.
Email: [email protected]
Received: December 14, 2017;
Initial review: March 08, 2018;
Accepted: August 21, 2018.
|
Objectives: To compare patient outcomes using the Pediatric Index of
Mortality-3 (PIM-3) model with PIM-2 model for children admitted to the
intensive care unit. Methods: We prospectively recorded the
baseline characteristics, variables of PIM-3 and PIM-2 at admission, and
outcomes of children
£17
years over a period of 11 months. We used Area Under Receiver Operating
Characteristics (AU-ROC) curves and Goodness-of-fit (GOF) tests to
determine which of the two models had better discrimination and
calibration. Results: Out of 202 children enrolled, 69 (34%)
died. Sepsis and pneumonia were the common admitting diagnoses. The
AU-ROC was better for PIM-3 (0.75) as compared to PIM-2 (0.69; P=0.001).
The GOF-P value was 0.001 for both models, that indicated poor
calibration of both (P<0.001). The AU-ROC curves were acceptable
across different age and diagnostic sub-groups. Conclusion: PIM-3
had better discrimination when compared to PIM-2 in our unit. Both
models had poor calibration across deciles of risk.
Keywords: Critical Illness, Outcomes, Prognosis, Scoring
system.
|
|
S everity of illness scoring
systems are an integral part of providing intensive care. The two
commonly used mortality risk scoring systems in pediatric intensive care
units (PICU) include the Pediatric Risk of Mortality (PRISM) and the
Pediatric Index of Mortality (PIM) scores [1,2]. PIM-3 is the latest
revision of PIM that has been validated in Australia, New Zealand,
Ireland and UK [3]. It has the same number of variables as PIM-2 [4]
with two major changes – the variable ‘recovery post-procedure’ is
further divided into three categories, and an additional ‘very high-risk
diagnosis’ variable has been added. Only few studies have validated
PIM-3 so far [5-7], and very few from developing countries [7]. We
therefore aimed to compare the discriminative ability and calibration of
PIM-3 and PIM-2 models, calculated within 1 hour of admission.
Methods
We conducted this observational study in our 8-bedded
tertiary-care PICU between September 2015 and July 2016.
The protocol was cleared by the Institutional Ethics
Committee. All children aged 2 months to
£17 years admitted to
the ICU were eligible for enrolment. Children were enrolled after
obtaining written informed consent from one of the parents.
Children dying within 1 hour of admission were excluded. The data
collected included demographic variables, diagnosis, variables of PIM-3
and PIM-2, clinical course, and outcome. The data collected were
obtained as part of the routine workup of these children.
The variables of PIM-3 and PIM-2 were collected
within 1 hour of admission. Data collection was done by three
researchers, and the intra-observer as well as inter-observer
reliability was good with kappa statistic of 0.92 (95% CI: 0.90-0.94)
and 0.94 (0.91 -0.96), respectively.
Statistical analyses: Data were analyzed
using Stata 11.2 (StataCorp, College Station, TX). The performance of
PIM-2 and PIM-3 was assessed by discrimination and calibration.
Discrimination is the ability of a model to distinguish accurately
between survivors and non-survivors. Mortality discrimination was
assessed using Area Under the Receiver Operating Characteristics
(AU-ROC) curves [8,9]. We defined acceptable discrimination as an AU-ROC
between 0.70 and 0.79, and good discrimination as
³0.80 [8,9].
Calibration is the correlation between predicted and actual outcomes
over the entire range of risk. A good calibration is represented by a
P ³0.05
(as assessed by the GOF test) [10].
Results
The final data set comprised of 202 children [median
(IQR) age, 3 (0.5,7)], of whom 69 died (34%). The major reasons for ICU
admission were severe sepsis and respiratory illnesses (Web Table
I). The major causes of death were refractory shock (56%) and
refractory hypoxemia. The mean probability of death by PIM-3 was 15% and
by PIM-2 was 16%.
 |
|
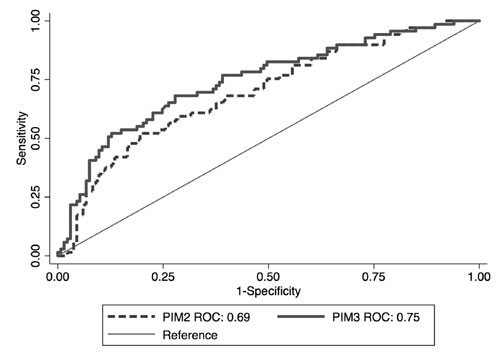
Fig. 1 Comparison of ROC curves –
PIM3 and PIM2.
|
The AU-ROC was higher for PIM-3 (0.75; 95%CI: 0.67,
0.81) as compared to PIM-2 (0.69; 0.62, 0.77) (P=0.005) (Fig.
1). Calibration was poor across deciles of risk for both scores with
GOF P value being <0.0001 for PIM-3 and <0.001 for PIM- 2. PIM-3
had good AU-ROC across all age and diagnostic categories as compared to
PIM-2. Discrimination (AU-ROC) was best for respiratory illnesses
for the two scores (Table I).
TABLE I Area Under ROC Curves of PIM-3 and PIM-2 (N=202)
|
Category |
Area Under ROC Curve |
|
PIM-3 |
PIM- 2 |
|
Age range |
|
|
|
<1 y (n=74) |
0.74 |
0.75 |
|
1-<5 y (n=39) |
0.70 |
0. 67 |
|
5-<10 y (n=58) |
0.74 |
0.65 |
|
³10 y (n=31) |
0.80 |
0.67 |
|
Diagnoses |
|
|
|
Severe sepsis (n=91) |
0.73 |
0.69 |
|
Respiratory illness (n=41) |
0.86 |
0.80 |
|
Neurological illness (n=30) |
0.74 |
0.69 |
|
Cardiac illness (n=13) |
0.78 |
0.79 |
|
Liver failure (n=3) |
- |
- |
|
Other conditions (n=24) |
0.71 |
0.53 |
|
PIM: Pediatric index of mortality. |
Discussion
The results of the present study demonstrate that
PIM-3 had better AU-ROC curve than PIM-2 in the current PICU setting;
however, none of the scores had good calibration.
In comparison to the development set (in which PIM-3
was developed) and the multicenter study from Italy in which it was
validated, the median risk of mortality was higher in our study
population with both PIM-3 and PIM-2. The median probability of death
with PIM-3 was 3.5% and 3.9% and 5.3% and 4.9% with PIM-2 in the
development [3] and validation sets [5], respectively. This clearly
demonstrates that the children admitted to our unit were sicker at
admission and probably late in their course of illness. The mortality
rates in the development and validation sets, respectively were also
much lower (3.7% and 5%) [3,5] as compared to our study. This could
probably explain the difference in AUROC curve between these two studies
and ours with AUROC curve being >0.80 for both PIM-2 and PIM-3 in these
studies [3,5]. The other possible reasons for this disparity is the
difference in disease patterns between these units and our unit. Both
PIM-3 and PIM-2 models have been developed and validated in mixed ICU
units catering to both medical and surgical patients (one-third of
admissions in the development sets were post-surgical) including those
undergoing cardiac bypass and post-transplant [3,5]. In contrast, our
unit mostly caters to acute infectious or medical conditions and only
occasionally admits post-surgical patients. These factors could not be
accounted for by the variables used to calculate the scores. Not
surprisingly therefore, the case mix and the severity of illness at
admission resulted in regression coefficients that are quite different
from the development set for some of the items of the scores.
In contrast to discrimination which was acceptable
for PIM-3, calibration was poor for both PIM-3 and PIM-2. In comparison
to our study, PIM-3 had better calibration than PIM-2 in the Italian
cohort [5]. The results of our study for PIM-3 and PIM-2 are similar to
previous studies from developing countries that reported the models to
be under-predicting deaths in their set-up [11-14]. The poor calibration
of the scores observed in these units and ours could be attributed to
the differences in the patient profile, need to manage large numbers of
severely ill children with less than optimal human resources, and
possible differences in standard of care between these units and the
units where the models where developed [6,7,11-14].
A limitation of this study was that it was a single
clinical unit study and applicability of the results is limited due to
poor calibration, and low sensitivity and specificity. Multi-unit
studies in developing country settings are required to address these
problems.
Contributors: JS, RL, SKK: conceptualized,
designed the study and developed the protocol; KMG, UVK: collected the
data and helped with review of literature; JS: performed the statistical
analysis and wrote the manuscript. All authors approved the final
version of the manuscript.
Funding: None; Competing Interest:
None stated.
|
What This Study Adds?
• PIM-3 as a severity of illness score has better
discrimination as compared to PIM-2; though both have poor
calibration.
|
References
1. Pollack MM, Ruttimann UE, Getson PR. Pediatric
risk of mortality (PRISM) score. Crit Care Med. 1988;16:1110-16.
2. Shann F, Pearson G, Slater A, Wilkinson K.
Paediatric index of mortality (PIM): A mortality prediction model for
children in intensive care. Intensive Care Med. 1997;23:201-7.
3. Straney L, Clements A, Parslow RC, Pearson G,
Shann F, Alexander J, et al. ANZICS Paediatric Study Group and
the Paediatric Intensive Care Audit Network. Paediatric index of
mortality 3: An updated model for predicting mortality in pediatric
intensive care. Pediatr Crit Care Med. 2013;14:673-81.
4. Slater A, Shann F, Pearson G; Paediatric Index of
Mortality (PIM) Study Group. PIM-2: A revised version of the Paediatric
Index of Mortality. Intensive Care Med. 2003;29:278-85.
5. Wolfler A, Osello R, Gualino J, Calderini E, Vigna
G, Santuz P, et al. Pediatric Intensive Therapy Network (TIPNet)
Study Group. The importance of mortality risk assessment: Validation of
the Pediatric index of mortality 3 score. Pediatr Crit Care Med.
2016;17:251-6.
6. Lee OJ, Jung M, Kim M, Yang HK, Cho J. Validation
of the Pediatric index of mortality 3 in a single Pediatric Intensive
Care Unit in Korea. J Korean Med Sci. 2017;32:365-70.
7. Sari DSP, Saputra I, Triratna S, Saleh IM. The
Pediatric Index of Mortality-3 score to predict mortality in a pediatric
intensive care unit in Palembang, South Sumatera, Indonesia. Paediatrica
Indonesia. 2017;57:164-70.
8. Pollack MM. Clinical scoring systems in pediatric
intensive care. In: Fuhrman BP, Zimmerman JJ (editors). Pediatric
Critical Care. Mosby Year Book, St. Louis, 1992. p. 153-62.
9. Hanley JA, McNeil BJ. The meaning and use of the
area under the receiver operating characteristic (ROC) curve. Radiology.
1982;143:26-36.
10. Hosmer DW, Lemeshow S. Applied logistic
regression. 1989. Wiley, New York.
11. Taori RN, Lahiri KR, Tullu MS. Performance of
PRISM (Pediatric Risk of Mortality) score and PIM (Pediatric Index of
Mortality) score in a tertiary care pediatric ICU. Indian J Pediatr.
2010;77:267-71.
12. Thukral A, Lodha R, Irshad M, Arora NK.
Performance of Pediatric Risk of Mortality (PRISM), Pediatric Index of
Mortality (PIM), and PIM-2 in a pediatric intensive care unit in a
developing country. Pediatr Crit Care Med. 2006; 7:356-61.
13. Qureshi AU, Ali AS, Ahmad TM. Comparison of three
prognostic scores (PRISM, PELOD and PIM-2) at pediatric intensive care
unit under Pakistani circumstances. J Ayub Med Coll Abbottabad.
2007;19:49-53.
14. Sankar J, Chandel A, Dubey NK, Sreenivas V,
Sankar MJ. Do interventions in an ICU affect the predictive ability of
Pediatric index of mortality and Pediatric index of mortality-2 scores
in a tertiary care hospital? Pediatr Crit Care Med.
2013;14:e70-6.
|
|
|
 |
|
