|
|
|
Indian Pediatr 2011;48: 855-860 |
 |
Pattern of Growth Faltering and Recovery in
Under-5 Children in India Using WHO Growth Standards - A Study
on First and Third National Family Health Survey |
|
*Raja Sriswan Mamidi, Pallavi Shidhaye, KV Radhakrishna, JJ Babu and P
Sudhershan Reddy
From the Clinical Division, National Institute of
Nutrition; and, Niloufer Hospital; Hyderabad, India.
Correspondence to: Dr Raja Sriswan Mamidi, Senior
Research Fellow, *National Institute of Nutrition,
(Indian Council of Medical Research), Jamai Osmania PO, Hyderabad 500 007,
India.
Email: [email protected]
Received: April 8, 2010;
Initial review: May 10, 2010;
Accepted: October 19, 2010.
Published online: 2011 March 15.
PII: S097475591000291-1
|
Objective: To examine the pattern of growth faltering in preschool
children, using World Health Organization (WHO) growth standards 2006 from
the available datasets of first and third National Family Health Survey (NFHS
1 and 3).
Design: Data-analysis of two large-scale
cross-sectional surveys done at a gap of 15 years.
Setting: General community.
Subjects: Preschool children included in NFHS 1 (n
= 37,768) and NFHS 3 (n = 41,306).
Main outcome measures: Weight for age Z-scores
(WAZ), height for age Z scores (HAZ) and weight for height Z
scores (WHZ) based on WHO growth standards for the first four years of
life.
Results: Mean WAZ score at ‘0’ month during first
and third surveys were -1.15 (n=268) and -0.76 (n=184),
respectively. Of the total growth faltering in weight for age Z (WAZ)
score by the end of third year, 55% and 44% of the growth faltering was
already present at birth for the first and third survey, respectively.
There was no change in weight for height Z (WHZ) score for the first three
years during both the surveys.
Conclusions: A good part of the total growth
faltering in India has already taken place at birth. Much of the growth
faltering in early life can be attributed to faltering in HAZ scores or
stunting. Understanding the causal role of stunting and its prevention as
well as improving birth weight appears to be the key for better efficacy
of public health programs in preventing under-5 malnutrition in India.
Key words: Growth faltering, India, Malnutrition, NFHS,
Preschool children.
|
|
P
rotein energy malnutrition is a public health
problem in India. As per the NFHS 3 (National Family Health Survey 2006)
report, 47% of children below 5 years of age are underweight, 46% of
children are stunted and 17% of children are wasted [1]. This has been
largely attributed to poor complementary feeding from the second half of
first year of life [2,3]. Growth faltering in weight in developing
countries has been shown to be starting around 4th month of life; however,
stunting might start from the onset of birth, the causes of which are
unknown [4]. This pattern of faltering has been shown from the reference
growth standards of NCHS (National Center for Health Statistics), but
these were derived from studies on bottle-fed infants and the growth of
breast fed infants have been shown to be different from bottle fed infants
[5].
There is little data as to the timing of growth
faltering in under-5 children in India and there exist no studies
examining growth faltering at the National level in India. It was
therefore of interest to examine the patterns of faltering and recovery
using the new growth standards based on breast fed infants (WHO growth
standards, 2006), using the available data from the first and third NFHS.
Methods
NFHS had carried out anthropometric measurements in
children below the age of 4 years in its first survey in 1991 (NFHS 1) in
all the states in India, and later extended anthropometric measurements to
children below five years of life and women aged 15 to 45 years during the
second survey in 1999 [6,7]. In the third survey, anthropometric
measurements of men aged 15 to 45 years were also included [1].
The study uses the raw data of NFHS available from
Demographic Health Survey (www.measure.dhs). These two surveys were used
as they represent the earliest (first) and latest (third) surveys and give
us a better contrast in the extent of improvement during these two time
points with a gap of 15 years. The sample design adopted in both surveys
in each state was systematic, stratified sample of households with two
stages in rural areas and three stages in urban areas.
NFHS 1 conducted anthropometric measurements in 37,768
children below 4 years of age. Height was measured to the nearest 0.1cm
and weight to the nearest 100 grams by the field staff. Age of the child
was calculated in "days" based on the information on dates of birth and
date of interview taken and was founded to the nearest "month". The
guidelines given in the United Nations manual "How to weigh and measure
children" were followed when training the field staff. Height was not
measured in few states in the first survey (Andhra Pradesh, Himachal
Pradesh, Madhya Pradesh, Tamil Nadu, West Bengal). However, the lack of
height measurements for these states should not subsequently bias the
national estimate of height for age and weight for height since these five
states cluster closely around the national estimate of the percentage of
children who are underweight (weight for age), as weight was measured in
these states [6]. Weight for age (WAZ) Z scores, height for age (HAZ) Z
scores, weight for height (WHZ) Z scores were calculated using NCHS growth
standards. Z scores of all the above indices were recalculated using WHO
2006 growth standards for the survey. The software "ENA for SMART" used
for the analysis is available at www.nutrisurvey.net/ena. In the
third survey, anthropometric measurements in 41,306 children below 5 years
as well as in adults aged 15-49 years (69245 men and 118796 women) were
done. However, in the third survey, all the indices of nutritional status
discussed above were calculated using both NCHS and WHO growth standards.
Statistical analysis: All analyses were performed
with the Statistical Package for Social Sciences (SPSS) for windows, 17 (SPSS
Inc, Chicago, USA). For this study, all the nutritional indices of
children in the first and third survey, discussed above are plotted
against age and are compared using WHO growth standards. This is
restricted to first four years of life, as the first survey included
measurements of children below the age of four years. Student t
test was done to see significant differences in mean Z scores in children
in the two surveys for the first three years in various ages, at three
monthly intervals for the first year and a six monthly interval for the
second and third year. Differences were considered significant at P<0.05.
Results
The mean WAZ, HAZ and WHZ scores in relation to age in
children below the age of 4 years during the first and third NFHS survey
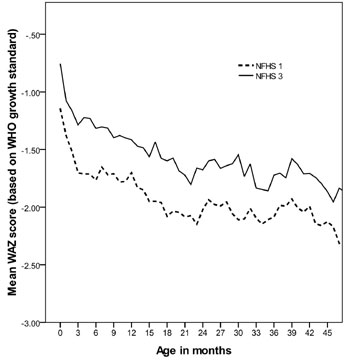
are shown in Fig. 1. Mean WAZ score at ‘0’ month
during first and third surveys were –1.15 (n = 268) and –0.76 (n
= 184), respectively. Moreover, the difference in mean WAZ score (0.40 Z
score) at 0 month in both surveys is nearly maintained until the end of
third year of life (0.36 Z score) (Fig. 1a).
Differences in mean WAZ scores for the first and third survey were
significant at all time points for the first three years (Table
I).
|
(a) |
(b) |
|
(c) |
|
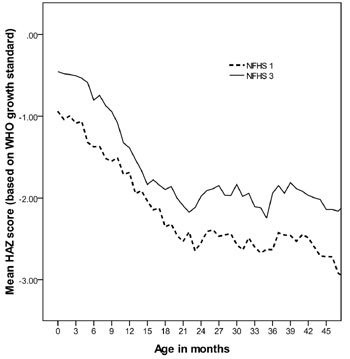
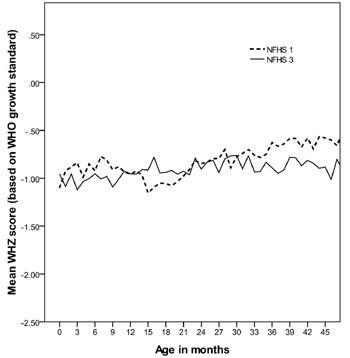
Fig.1 Line graph showing (a) mean WAZ
scores, (b) mean HAZ scores, and (c) mean WHZ scores against the age
of <4 year Indian children during the first and third National
Family Health Surveys (NFHS 1 and NFHS 3, respectively). |
Percent of growth faltering at 0 months (indicating the
percent of total faltering at birth compared to the third year of life), 6
months (indicating the initiation of complementary feeding), 12 months
(first year of life), 24 months (second year of life) compared to 36
months (third year of life) were calculated. Of the total faltering in
weight for age at 36 months (–2.08 Z score) (Fig. 1), 55% of
growth faltering in weight had already taken place at birth (–1.15 Z
score), this increased further to 82% by the end of 6 months (–1.71 Z
score). No further increase in percent of growth faltering takes place
from 6th month to 12th month (–1.70 Z score). By the end of 24 months,
growth faltering is complete (–2.14 Z score). Similarly for the third
survey, the percent of growth faltering at 0 months, 6 months, 12 months,
and 24 months were 44%, 71%, 68% and 96%, respectively.
Mean HAZ scores at 0 month during first and third
survey were -0.94 (n=158) and –0.45 Z (n=184) scores,
respectively (Fig.1b). The difference increases
slightly and by the end of third year mean HAZ score of the children were
–2.63 Z score and -1.94 Z score for the first and third survey,
respectively. Differences in mean HAZ zcores for the first and third
survey were significant at all time points for the first years (Table
I).
TABLE I  Mean Weight for Age Z (WAZ), Height for Age Z (HAZ) and Weight for Height Z (WHZ) Scores of

Children Under-3 Years in the First (NFHS1) and Third (NFHS3) National Family Health Surveys
|
|
NFHS1 |
NFHS3 |
P value |
|
|
n |
MEAN |
(SD) |
n |
MEAN |
(SD) |
|
| 0 month |
| WAZ |
268 |
-1.15 |
(1.53) |
184 |
-0.76 |
(1.35) |
0.005 |
| HAZ |
158 |
-0.94 |
(2.06) |
184 |
-0.45 |
(1.60) |
0.014 |
| WHZ |
138 |
-1.10 |
(1.71) |
184 |
-0.96 |
(1.89) |
0.487 |
| 3 months |
| WAZ |
941 |
-1.70 |
(1.71) |
627 |
01.29 |
(1.31) |
<0.001 |
| HAZ |
741 |
-1.09 |
(2.06) |
627 |
-0.50 |
(1.82) |
<0.001 |
| WHZ |
748 |
-0.84 |
(1.97) |
627 |
-1.12 |
(1.71) |
<0.005 |
| 6 months |
| WAZ |
971 |
-1.77 |
(1.57) |
710 |
-1.32 |
(1.31) |
<0.001 |
| HAZ |
720 |
-1.37 |
(1.88) |
710 |
-0.80 |
(1.73) |
<0.001 |
| WHZ |
740 |
-0.92 |
(1.85) |
710 |
-0.95 |
(1.60) |
0.735 |
| 9 months |
| WAZ |
843 |
-1.71 |
(1.47) |
703 |
-1.40 |
(1.34) |
<0.001 |
| HAZ |
571 |
-1.55 |
(1.97) |
703 |
-0.94 |
(1.72) |
<0.001 |
| WHZ |
583 |
-0.91 |
(1.70) |
703 |
-1.09 |
(1.49) |
0.041 |
| 12 months |
| WAZ |
712 |
-1.70 |
(1.38) |
663 |
-1.42 |
(1.27) |
<0.001 |
| HAZ |
480 |
-1.69 |
(1.68) |
663 |
-1.39 |
(1.61) |
0.002 |
| WHZ |
490 |
-6.96 |
(1.55) |
663 |
-0.95 |
(1.48) |
0.948 |
| 18 months |
| WAZ |
882 |
-2.08 |
(1.50) |
811 |
-1.60 |
(1.32) |
<0.001 |
| HAZ |
663 |
-2.36 |
(1.80) |
811 |
-1.90 |
(1.67) |
<0.001 |
| WHZ |
690 |
-1.06 |
(1.54) |
811 |
-0.94 |
(1.38) |
0.118 |
| 24 months |
| WAZ |
696 |
-2.02 |
(1.44) |
623 |
-1.68 |
(1.28) |
<0.001 |
| HAZ |
496 |
-2.55 |
(1.80) |
623 |
-1.98 |
(1.76) |
<0.001 |
| WHZ |
507 |
-0.85 |
(1.51) |
623 |
-0.90 |
(1.29) |
0.513 |
| 30 months |
| WAZ |
759 |
-2.11 |
(1.43) |
740 |
-1.55 |
(1.22) |
<0.001 |
| HAZ |
551 |
-2.57 |
(1.65) |
740 |
-1.83 |
(1.50) |
<0.001 |
| WHZ |
569 |
-0.77 |
(1.50) |
740 |
-0.76 |
(1.30) |
0.864 |
| 36 months |
| WAZ |
675 |
-2.08 |
(1.31) |
698 |
-1.72 |
(1.27) |
<0.001 |
| HAZ |
475 |
-2.63 |
(1.76) |
698 |
-1.94 |
(1.67) |
<0.001 |
| WHZ |
486 |
-0.63 |
(1.37) |
698 |
-0.89 |
(1.23) |
0.001 |
Percent of growth faltering were calculated similarly
with respect to HAZ score at the end of third year at both time points.
During the first survey, percent of faltering in HAZ score at 0, 6, 12 and
24 months were 36%, 50%, 65%, and 96%, respectively. During the third
survey, percent of faltering in HAZ score at 0, 6, 12 and 24 months were
23%, 41%, 71% and 102%, respectively (Fig. 1b).
Mean WHZ scores during both the surveys (Fig.
1c) were similar till the end of first year of life; however,
during the first survey, there was a sudden decrease in WHZ scores during
the beginning of second year of life followed by recovery by the end of
second year. Thereafter, mean WHZ scores during the first survey were
slightly higher than during the third survey. There was no statistical
difference in mean WHZ scores for the first and third survey at most time
points except at 3, 9 and 36 months, where the children of the first
survey had slightly higher Z scores (Table I).
Discussion
Growth faltering in weight in developing countries has
been known to start around the fourth month of life but these studies were
based on NCHS growth standards [4]. In this study, growth faltering in
weight appeared to start right from birth and there appeared a fall in WAZ
scores for the first 3 months and thereafter, the rate of fall appeared to
slow down. The pattern of growth faltering for weight for age in both
survey points was remarkably similar. It is interesting to note that of
the total faltering that had taken place by the end of first three years
of life, 55% and 44% of growth faltering in the first and third surveys,
respectively, was present at birth. Weight for age index depends on both
stunting (HAZ) and wasting (WHZ) indices, which have a physiological role.
Stunting is known to represent a state of chronic malnutrition and wasting
represents a state of acute malnutrition [8]. Weight for age can then be a
considered as a state, which merely reflects the characteristic of these
two conditions, and might not as such have a physiological role
independently.
With regard to wasting, the status of wasting at birth
seem to be similar till the end of first three years of life, except for
an abrupt decline in wasting at the beginning of first year of life in the
first survey. The sudden rise and fall in WHZ scores for the first 6
months of life seen with NCHS growth standards in developing countries [4]
is no longer seen with new WHO growth standards. It appears that the
energy and protein needs are sufficient to maintain the wasting status of
the child, but not sufficient enough to promote catch up growth.
The timing of stunting in developing countries, in a
study based on worldwide demographic data (based on NCHS growth
standards), showed that the onset of stunting starts at birth irrespective
of region [4]. In this study, of the total faltering at three years of
age, 36% and 23% in first and third survey respectively, occurred at
birth. This increases further to 50% and 41% by the end of 6 months of
life.
Much of the growth faltering can be attributed to
faltering in HAZ scores or stunting, since the status of wasting hardly
changed by the end of third year compared to birth, and weight for age
lacks a physiological role. The etiology of stunting has been poorly
understood. Dietary quality rather than quantity has been regarded by some
as an important etiological factor for stunting [9]. However, as seen from
the above discussion, faltering in stunting in this study as well as in
other developing countries [4] appears to start from birth and the similar
efficacy of breast milk compared to other foods for the promotion of
growth has been well documented [10- 12]. It may possible that the
recovery of stunting is intergenerational [13,14] and a complete recovery
in stunting in one generation is unlikely to happen. The recovery in
stunting has been seen in a span of two to three generations of children
living in better environmental conditions, one such example being the
secular trends in adult height in developed countries in 19th century,
where the adult male height improved from around 164 cm to around 176 cm
at a rate of 0.5 to 1.5 cm per decade [15,16]. It appears that
understanding the intergenerational effects on linear growth and its
causes is essential for building up a strategy to reduce the burden of
stunting and hence under -5 nutrition in the country.
Percent of growth faltering can be calculated based on
the assumption that the same child was followed up for the first three
years of life. Limitation of our study is that it is a semi longitudinal
study with two cross-sectional surveys at different time points and
calculations based on a cross-sectional study may not be entirely
appropriate for such analysis. However, it is often difficult to carry out
longitudinal studies with an adequate sample size in a developing country
due to resource and time constraints.
A good part of the total growth faltering in India has
already taken place at birth. Much of the growth faltering in early life
can be attributed to faltering in HAZ scores or stunting. Understanding
the causal role of stunting and its prevention as well as improving birth
weight appears to be the key for better efficacy of public health programs
in preventing under-5 undernutrition in India.
Acknowledgments: Dr B Sesikeran, Director, National
Institute of Nutrition, Hyderabad, India for his support to carry out this
work. We also thank the Demographic Health Survey (MEASURE-DHS) for
provision of access to datasets.
Contributors: RSM analyzed the data and wrote the
paper. PS, KVR, JJB, PSR guided data analysis, interpretation of data and
helped in editing the paper. All the authors approved the final
manuscript.
Funding: None.
Competing interests: None stated.
|
What is Already Known?
• Studies on growth faltering in weight and
height in developing countries are based on NCHS growth standards
which were based on bottle fed infants.
What this Study Adds?
• A good part of the total growth faltering in
India has already taken place at birth and much of the growth
faltering in early life can be attributed to faltering in HAZ
scores or stunting.
|
References
1. National Family Health Survey (NFHS-3).
International Institute for Population Sciences; Mumbai: 2007.
2. Dewey KG. Guiding Principles for Complementary
Feeding of the Breastfed Child. PAHO/ WHO, 2003.
3. Brown KH, Dewey KG, Allen LH. Complementary Feeding
of Young Children in Developing Countries: A Review of Current Scientific
Knowledge. WHO/ UNICEF, 1998.
4. Shrimpton R, Victora CG, de Onis M, Lima RC,
Blossner M, Clugston G. Worldwide timing of growth faltering: implications
for nutritional interventions. Pediatrics. 2001;107:1-7.
5. Victora CG, Morris SS, Barros FC, de Onis M, Yip R.
The NCHS reference and the growth of breast- and bottle-fed infants. J
Nutr. 1998;128:1134-8.
6. National Family Health Survey (NFHS-1). Mumbai:
International Institute for Population Sciences; 1993.
7. National Family Health Survey (NFHS-2).
Mumbai:International Institute of Population Sciences; 2000.
8. Waterlow JC. Note on the assessment and
classification of protein energy malnutrition in children. Lancet.
1973;2:87-9.
9. Allen LH. Nutritional influences on linear growth: a
general review. Eur J Clin Nutr. 1994;48:S75-89.
10. Cohen RJ, Brown KH, Canahuati J, Riviera LL, Dewey
KG. Effects of age of introduction of complementary foods on infant breast
milk intake, total energy intake, and growth: a randomised intervention
study in Honduras. Lancet. 1994;344:288-93.
11. Dewey KG, Cohen RJ, Brown KH, Landa Rivera L. Age
of introduction of complementary foods and growth of term,
low-birth-weight, breast-fed infants: a randomized intervention study in
Honduras. Am J Clin Nutr. 1999;69:679-86.
12. Bhandari N, Bahl R, Nayyar B, Khokhar P, Rohde JE,
Bhan MK. Food Supplementation with encouragement to feed it to infants
from 4 to 12 months of age has a small impact on weight gain. J Nutr.
2001;131:1946-51.
13. Stein AD, Barnhart HX, Wang M, Hoshen MB, Ologoudou
K, Ramakrishnan KU, et al. Comparison of linear growth patterns in
the first three years of life across two generations in Guatemala.
Pediatrics. 2004;113:270-5.
14. Ramakrishnan U, Martorell R, Schroeder DG, Flores
R. Role of intergenerational effects on linear growth. J Nutr.
1999;129:544S-4S.
15. Cole TJ. Secular trends in growth. Proc Nutr Soc.
2000;59:17-24.
16. Meredith HV. Findings from Asia, Australia, Europe, and North
America on secular change in mean height of children, youths, and young
adults. Am J Phys Anthropol. 1976;44:315-26.
|
|
|
 |
|
