|
|
Original Articles Indian Pediatrics 2003; 40:1043-1053 |
||||||||||||||||||||||||||||||||||||||||||||||||||||||||||||||||||||||||||||||||||||||||||||||||||||||||||||||||||||||||||||||||||||||||||||||||||||||||||||||||||||
Shamim A. Qazi, Mushtaq A. Khan, Talat Rizvi, Zubaida Khatoon, *Karen E. Peterson
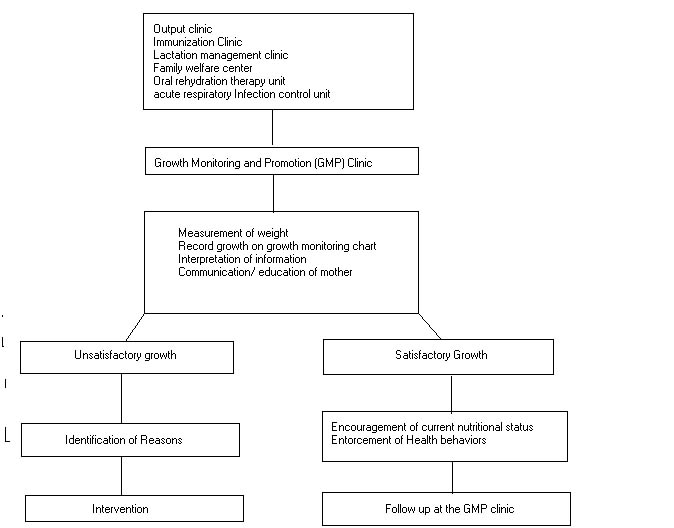
To describe the operation of growth monitoring and promotion (GMP) clinic and longitudinal growth patterns of children. Design: Prospective observation and intervention. Setting: Outpatient department of a teaching hospital. Methods: Less than 6 months old infants were registered at GMP clinic and followed for up to two years of age. Mothers were provided information, education and counselling about healthy growth of their infants. The outcome measure was change in weight after follow-up. Results: We enrolled a cohort of 553 children in the first 6 months of life, of which 318 (57.5%) were males. Mean follow up period was 15.7 (SD ± 6.4) months. At enrollment 207 (37.4%) were underweight [weight-for-age Z score (WAZ) < –2], of which 153 (73.9%) were from low-income families. The children from poorer families also gained weight regularly, although it was less than the higher income families. Of 346 infants with normal weight at registration, 305 (87.6%) maintained their weight gain by last follow-up visit. Of 207 underweight infants at enrollment 128 (62.4%) improved their weight gain by the last follow-up visit. Overall 433(81.0%) infants followed-up at our GMP clinic either maintained or improved their weight gain. Conclusions: Children at risk of undernutrition should be identified at an early age and through effective interaction between health workers and the family, their growth can be improved. Children of poor families can also benefit from this activity, provided a comprehensive approach is made available. Growth monitoring, Hospital based, Infant, Undernutrition. Child undernutrition is still a major public health problem in Pakistan in the 1990’s, despite an increase of the gross national product (GNP) per capita and substantial reduction in urban and rural poverty in recent years (1). Only a few countries worldwide have a higher prevalence of low birth weight infants, estimated at 25% in 1988 (1,2). According to survey finding among children under five years of age, 40.4% were underweight in 1990-91, 50.0% were stunted and 9.2% showed evidence of wasting(3). Reduction of moderate malnutrition to 20% has been the goal and focus of several Government of Pakistan (GOP) nutrition programs and policies, consistent with the commitments of international agencies to halve the proportion of child undernutrition worldwide(3-6). Analyses of risk factors for child undernutrition in Pakistan suggest that improving food security alone is unlikely to advance the overall nutritional status of children(7). The nutrition strategies must be linked to primary health and development programs that improve breast-feeding and weaning practices, decrease the incidence of infectious disease, increase levels of maternal education, and improve utilization of family planning services(7). GOP nutrition strategies include integration of nutrition related activities into existing primary health care services(2). Initiating growth monitoring and promotion (GMP) activities early in life is essential because prevalence of malnutrition generally does not increase after 12-18 months of age(8,9). Studies of Pakistani children have shown that weight gain in children of lower socioeconomic classes was reduced in the first 12 months of life and length gain was lower than expected from 6 to 18 months of age (10). Isolated efforts made to develop malnutrition rehabilitation programs in pediatric facilities in Pakistan(11) in most cases identified malnourished infants when they came either for routine "well child care" or "sick child care". Emphasis was placed on reversing faltering growth by treating illnesses, nutrition education and occasionally food supplements. Acute treatment was largely unsuccessful in sustaining the rehabilitated nutritional status and access to treatment for eligible children was also low. To avoid those limitations, we adopted an alternative approach of identifying and targeting children in first six months of life for preventive, promotive and preemptive approaches to prevent and reduce mal-nutrition. The objectives of this manuscript are to (i) describe the operation of a clinic-based growth promotion program in a Pakistani setting; and (ii) document growth patterns observed over the first 24 months of life. Subjects and Methods Institution The Children’s Hospital, Pakistan Institute of Medical Sciences has 200 beds and it treats approximately 400 patients daily in outpatient and emergency departments. Majority of children are brought directly to the hospital by parents or family members and only a small proportion is referred by community general physicians. The Growth Monitoring and Promotion (GMP) clinic was established in 1988 in the primary health care (PHC) block. The primary health care (PHC) block also houses clinical service delivery clinics, immunization clinic, family welfare center (FWC) providing family planning services, lactation management clinic helping mothers with lactation problems, oral rehydration therapy (ORT) unit and acute respiratory infections (ARI) control unit. The GMP clinic is staffed with health education assistant, a graduate trained in health education, nutri-tional anthropometry, nutrition education, communication, standardization of instru-ments and PHC strategies mentioned above. She was assisted by an experienced aya (a paramedical worker) with eight grades education, trained in nutritional anthro-pometry, preparation and demonstration of complementary foods preparation and communication with the mothers. They were trained and supervised by a public health physician and a preventive pediatrics physician. Continuous supervision and regular on-the-job refresher-training were conducted. GMP clinic protocol Children less than six months of age coming to the OPD for any of the above services were referred to the GMP clinic for assessment and education (Fig 1). Initial assessment included weight, nutritional history by the GMP clinic staff and a physical examination by primary care physician in the OPD. Zero error was corrected before weighing the child on a tray type scale (Tanita, Japan) with 50-gram divisions. Accuracy of the scale was checked weekly by known weights. Mothers were given advice by GMP staff on breast feeding, individualized specific nutrition issues, immunization and child spacing and referred for specific services when appropriate. For low birth weight children mothers were given advice to keep the baby warm, feed more frequently and to bring the child immediately if the child fell sick. Mothers were referred for assessment of other risk factors leading to low birth weight children. Simple complementary foods for demonstration purposes were cooked by aya for children and fed by the mothers. The first assessment at registration would take approximately 30 minutes and the subsequent visits would take on an average 15 minutes. Feeding demonstration would take approximately 45 minutes.
Fig 1. Growth Monitoring and Promotion (GMP) Clinic at the Children's Hospital, Islamabad.
TABLE I Characteristics of Study Children, Stratified by Monthly Income (N=553).
* 1 US $ = Rs. 60.0, Low income <3000.00 and moderate income ³ 3000.00 † Birth weight information available for 341 children ‡ Odds ratios and p-values are in comparison with no siblings data § Normal = ³ –2 WAZ, Underweight = < –2 WAZ ¶ For three children feeding information was not available, Odds ratios and p-values are in comparison with only breastfeeding data •Median weight for all children ▀ Median weight by family income >=Pak. Rs. 3000; ▲ Median weight by family income < Pak. Rs. 3000.
Fig. 3. • Median weight of male children; ∆Median weight of female children.
Mean length of follow-up was 15.7 ± 6.4 months (95% CI 15.1-16.2). Only 227 (41.0) children came for follow-up beyond 18 months of age, whereas 26 (4.7%) children, stopped coming for follow-up before six months of age. Figure 4 provides graphic representation of loss to follow-up. A significantly higher proportion of small birth size infants (10/125) stopped coming for follow-up between 0-5 months as compared to normal size children (14/428) (RR 1.92,95% CI 1.16-3.16 P = 0.02). After first five months of follow-up there was no significant difference in those who were followed for a longer time by birth size, birth weight, family size or family income.
Follow-up of children at the GMP clinic Discussion Although 37% of our study children were underweight at the time of registration, most of them showed catch-up growth; and average weights of small birth size infants improved by four months of age. Weight gain was maximal in the first few months of life. At the end of follow-up only 21.7% children were still underweight compared with the national reported estimate of 35.8%(3). Our data shows that children from poorer families had lower median weights than the children from better income families and females children had lower weights than males, although the growth patterns were parallel in both groups. Thus, nutrition education and advice alone was not enough and female children from very poor did worse as compared to other children. Thus there is a need to reach the most vulnerable groups through interventions, that may not work best if targeted at secondary and tertiary care institutions. Improvement in nutrition status of LBW infants and sustained nutritional status in normal children may have occurred for two reasons. First, enrollment for prospective monitoring as soon as possible after birth was critical, because the age at the peak of growth faltering is too late and not an optimal time to intervene with GMP. Interventions must be directed at or before the age when the risk behaviors/outcomes first begin to act on the child. Catchup growth in the LBW infants is most pronounced in the first 6-8 months of life, if nutritional supplies are adequates(18), so they need to be monitored from birth. The recommended timing and evaluation of growth monitoring (8,9) often fails to take into account the benefits of its integration with PHC interventions. Other growth promotive messages (e.g., exclusive breast feeding, appropriate use of complementary foods and feeding during illness), must also be part of the health education. Moreover, consistent with the national policy of growth promotion(11), we tried maternal behavioral change through information, education and communication to achieve improved nutrition at home and thus improve growth of their children. Several potential limitations of the data must be considered in interpreting the results, First, a number of children were not brought regularly for follow-up, Regular visits place a large burden particularly on low-income families in terms of travel costs and time. Furthermore, mothers, especially very poor were less inclined to bring older children for weighing, as they did not value the time investment for the visit. In the first five months the disproportionate loss to follow-up of small birth size infants could be due to early infant mortality, resulting in a survival bias. We were unable to evaluate this possibility because of limited resources. Irregular follow-up, time and other cost limitations have been reported in other locations using growth-monitoring program(19). Second, birth weight data was not available for all children. We used the perceived birth size and found it to be a reasonable proxy for LBW babies, Third, this was a hospital-based convenience sample, not necessarily representative of the community, therefore these results may not be generaliza-ble. Fourth, infections are common in Pakistan and a drop in growth velocity may occur after illness, resulting in some normal weight children at registration who became underweight and some underweight children remained underweight, despite advice to provide extra nutrition during and after illness to reverse the drop. Fifth, fewer female children, were registered, consistent with health facility utilization for females in Pakistan(20). Finally, the study design did not permit assessment of impact or adequacy of the model, because there was no control group who was not exposed to our intervention. Ethically it was inappropriate not to provide nutritional advice to a control group. GMP is less likely to succeed if health & care providers are not trained to assess, interpret and act on the information provided by weighing(8,21). Our approach was a combined screening, education and communication strategy where workers were able to assess, interpret the results and act on it. Such an approach should be "family centred", by involving parents in decision making and addressing health and social needs of the family. Growth monitoring and prospective interventions require interaction between health workers and the family, a health approach that is not currently in vogue in Pakistan. Our study demonstrates that this approach could be an important part of the delivery of primary health care. Acknowledgement The authors are indebted to the following people who reviewed the manuscript and gave their suggestions: Dr. Patricia Hibberd, Clini-cal Research Institute, New England Medical Center, Boston and Dr. Jonathan Simon, Director Center for International Health, Boston University, Boston, United States. Contributors: SAQ was responsible for initialization, institutionalization and overall supervision of the GMP clinic, conceptualization of the manuscript, data management, analysis and manuscript writing. MAK helped in initialization and institutionalization of the GMP clinic, conceptualization of the manuscript and contribution in manuscript writing. TR was involved in supervision and management of the GMP clinic on day-to-day basis, conceptualization of the manuscript and contributed to data analysis and manuscript writing. ZK helped in managing the GMP clinic on day-to-day basis and data collection. KEP was involved with conceptualization and contribution in manuscript writing. Funding: None. Competing interests: None stated.
| ||||||||||||||||||||||||||||||||||||||||||||||||||||||||||||||||||||||||||||||||||||||||||||||||||||||||||||||||||||||||||||||||||||||||||||||||||||||||||||||||||||
| ||||||||||||||||||||||||||||||||||||||||||||||||||||||||||||||||||||||||||||||||||||||||||||||||||||||||||||||||||||||||||||||||||||||||||||||||||||||||||||||||||||
![]()