 |
|
Essentials of Biostatistics Indian Pediatrics 2000;37; 515-521: |
||||||||||||||||||||||||||||||||||||||||||||||||||||||
|
7. Measures of Mortality and Morbidity in Children |
||||||||||||||||||||||||||||||||||||||||||||||||||||||
|
A. Indrayan
L. Satyanarayana*
The previous article(1) of this series was devoted to the interpretation of individual based measurements and their reference values. However, the term health is used as much for a group or a community as for individuals. A different set of instruments is required to measure health of a group of people. Such a measure helps to compare the state of health over a period of time in the same community, among people of different social and ethnic groups, among people residing in different areas, and among people of different biological groups such as of different age, different gender or different race. Such measures are called indicators. This term is generally used when the measure is restricted to a specific aspect. There are several indicators of mortality and morbidity that measure children’s health. Section 7.1 is on indicators of mortality and Section 7.2 includes measures of morbidity such as incidence and prevalence.
Death is easy to identify in nearly all the cases and the date of death is generally available in records. Thus, the mortality statistics are considered reliable and used all across the world. A higher rate of mortality in children is considered an indicator of poor health, though this may not be so for old age. Indicators used to measure deaths in a population are crude death rate (CDR), child morality rate, life expectancy at birth, etc. Among the child mortality indicators, the infant mortality rate is widely used as an indicator of health status and development. There are many other indicators that measure mortality in children beginning with conception.
The
following are some indicators related to fetal deaths. Early neonatal deaths are deaths occurring during first week of life (<7 days). Late fetal deaths include the fetuses of more than or equal to 28 weeks of gestation. In cases where gestation period is not available, a weight of more than or equal to 1000 gram is considered. Another measure for perinatal mortality is
Perinatal
mortality ratio
=(Late fetal + Early neaontal) deaths weighing> 1000
g/Live births Note that we are using the term "rate" when the numerator is part of the denominator, otherwise calling it a "ratio". In that sense rates are proportions. In all the indicators listed above, abortions, live births and deaths are counted for one year period.
As we explained in our earlier article(2), the basic requirement for a quantity to be called a rate is that the denominator is the group at risk for the events being counted in the numerator over a period of time. The following are some rates pertaining to child motality. Neonatal
mortality rate(NMR)
= (Neonatal
deaths*/
Live births)*1000 Neonatal period is upto 28 days of life and the post-neonatal period is 28 days to 364 days. These two together form the infant period. Note that an infant is a child less than one year of age and a neonate is less than 4 weeks. Infant
mortality rate(IMR)
= Deaths
of infants/Live
births*1000 U5MR is also called child mortality rate. This is used as an indicator of social well being by UNICEF. Some times mortality in 1-4 years age-group is termed as child mortality rate. Thus, exercise caution while interpreting this rate reported in literature.
The number of deaths (irrespective of age) in an area in a year per 1000 population counted at mid-year is called crude death rate (CDR). When the numerator and the denominator both are restricted to a particular age-group, we get the specific death rate for that age-group. For example, the age specific death rate (ASDR) for the age 5-14 years is the deaths in age 5-14 years per 1000 children of this age group. Such a rate provides an adequate comparison of the health status in the two areas or at two times. In the year 1995, the ASDR for females in the age-group 5-14 years was 2.1 in India while it was only 0.09 in Sweden. The rate in India was more than 20 times. That shows the qualitative difference in deaths, though the CDR for the general population was nearly same, 9, in both the countries. The ASDR for the age-group 0-4 years is different from the U5MR because the denominator is population of this age group in ASDR but number of live births in U5MR. It is customary to use the term "mortality rate" when the denominator is live births and the term "death rate" when the denominator is population size.
Standardization is a method of adjustment. This is generally done for age differentials but can be done for other factors also. The objective is to remove the effect of differential mortality or differential structure of the subgroups in the two populations under comparison. The rates are then brought to a common base and thus made comparable. This requires an assumption of a standard or a reference population. In the case of age-standardization, the standard may have a predefined age-structure or a predefined ASDR. A form of standardization using predefined ASDRs of a standard population is called standardized mortality ratio (SMR). This is the ratio of the number of deaths observed in a study group to the number that would be expected if the study group had the same specific rates as in a "standard group". This is multiplied by 100 and expressed in terms of percentage. SMR = (Observed number of deaths / Expected number of deatth)*1000 where the denominator is based on the age-specific rates in a standard population. This can be obtained by multiplying the age-specific population in your sample by the age-specific mortality rates in a standard population. The standardization is not necessarily age-specific but could be gender-specific, exposure-specific or specific for any other categorization. It can be any other measurement such as incidence in place of mortality. For example, Table I shows the expected childhood cancer incident cases for the year 1989 using age-specific cancer incidence rates for the year 1988. The observed number of childhood (0-14 years age) cancer cases for the year 1989 is 308(3) while the expected on the basis of 1988 rate is 360. Thus, the age-standardized cancer incident ratio is (308/360) ´ 100 = 85 per cent. This shows that the childhood cancer load for the year 1989 is 85 per cent of that of the year 1988. There is a decline of 15 per cent over one year period. The study and the standard groups can be disease and control groups as in a case-control study, or general populations or any other groups of interest. In this method, the more stable rates of the larger population are generally applied to the smaller study group to obtain the expected number of deaths though this is not the case in the above example. SMR measures the likely excess or reduced risk of mortality in the study group.
Morbidity is departure from health. This results or has potential to result in at least some restriction in performing the normal activities of life. Morbidity in children could be in terms of infectious diseases such as diarrhea, pneumonia and tetanus, or chronic such as congenital anomalies and thalassemia. The magnitude of morbidity in children can be measured by: (i) the number of children affected, (ii) the number of episodes or spells of sickness, particularly for acute conditions, (iii) the duration of illness, and (iv) and severity of illness. Morbidity is not so easy to quantify as mortality. Some measures of morbidity are described below.
These terms are familiar and quoted frequently in medical literature. For example, the studies by National Nutrition Monitoring Bureau (India) have indicated(4) that there has been a steady decline in the prevalence of severe protein energy malnutrition (Gomez classification <60% of standard) from 18-20.8% in 1969-75 to 8.5% or less. Incidence of congenital cardiac lesions was originally estimated to be 6 to 8 per 1000 live births in the Western countries while the more recent figures suggest that the incidence to be about 1/1000 live births(4). A survey conducted by ICMR involving 133,000 children 6-16 years of age showed the incidence of rheumatic heart disease to be 5.3/1000 per year(4). The fundamental distinction between these terms is that prevalence is the presence of morbidity and incidence is its fresh occurrence. Thus, prevalence is computed on the basis of the existing cases and incidence on the basis of the new cases. They can be obtained either by counting the subjects affected or by counting the episodes occurred. Prevalence is considered to measure the load on health care services, and the incidence is considered to measure the risk of getting the disease. By very nature, an incidence relates to a period of time but not the prevalence. Yet there are concepts of point and period prevalence. Point Prevalence: This is the number of cases existing at a specific point of time and obtained generally for chronic than for acute conditions. For example, the prevalence of Intelligence Quotient (IQ) below 70 in Indian children is 2 to 3 per cent(4). The prevalence of recurrent abdominal pains (RAP) in childhood ranges between 10 and 20 per cent(5). Another study reports(6) a prevalence of (23/5000) 0.46% for hypertension in the school going children of age-group between 5 to 17 years. A survey to identify affected cases generally takes weeks or months but the count obtained is a point prevalence when the inquiry is with regard to the presence or absence of morbidity at the time of contact or a particular reference point. This can be obtained by a cross-sectional survey. A prevalence rate (per cent, per thousand, or per million persons) can be calculated for specific age, gender, occupation, etc. Prevalence rate estimates the probability of presence of morbidity in a randomly selected person from that group. We earlier(1) called this a pretest probability. Period Prevalence: The number of children affected or the number of episodes of illness present during a specific period such as one week or one month in a defined population are counted. This includes the number of cases arising before but extending into or through the period, as well as those having inception during the period. For measuring period prevalence, generally only a short duration is considered and it is mostly done for acute conditions. For example, in a study on morbidity in preschool children in Lucknow(7) in the year 1996, parents were asked to recall the symptoms of diseases with which the child had suffered in the preceding month. This study found period prevalence of respiratory disease from 8.1% to 17.1%, diarrheal disease from 6.1% to 13.8% in different months of the study. Duration of Morbidity: Acute conditions such as typhoid, malaria and diarrhea last a few days while chronic conditions such as diabetes, malignancy and epilepsy can go on for years. Duration depends on the course a disease takes. This, in turn, depends on its severity, adequacy of treatment if any, subject’s own capability to resist, etc. In case of acute conditions, a measure of the duration of sickness is its mean or the median. Whenever any mean is calculated, it is always advisable to calculate the SD also and include this in the report so that the reader knows about the extent of variation. The starting point of morbidity could be the day of appearance of the first sign or first symptom, the day of diagnosis, the day of positive test, the day of reporting, etc, and it should be clearly stated. The termination could be in terms of disappearance of complaints, ability to resume normal activities, negative test, discharge from the hospital, etc. In case of chronic conditions, the distribu-tion of duration of sickness may be far from Gaussian. Unusually longer duration will be more common than the unusually shorter duration. This makes the distribution skewed to the right. If so, mean may not be a true representative of the central value. Median and 3rd-97th percentiles or range are calculated instead. If the end-point is death, such as in leukemia and AIDS, the duration of sickness is the same as the duration of survival. Incidence: This is the number of episodes or the number of persons having onset in a specific period of time. This onset could be the time when the person first felt sick or injured, or it could be the time when the person (or the family) was first told that he had a condition which he was previously unaware of. Thus, a child, who is diabetic for long time, is considered to have onset at the time when it was first detected. Incidence of tuberculosis in children is about 1 % per year. In south east Asia, the incidence of tuberculosis in the population above 5 years is 0.7 to 2/1000 per year(4). The incidence of Down syndrome (Trisomy 13) is about 2 per 10000 births(4). These are some examples of use of incidence. An incidence rate may show increase if the reporting or case-detection is improved. Thus, this may not be a real rise. A rise in incidence rate, if real, indicates that the existing strategy to control the disease has not succeeded. Alternative or improved strategies may then be needed. Analysis of differences in incidence in various socioeconomic, biological and geo-graphical groups may provide useful tips to devise an improved strategy for control of the disease. Note the following about incidence: (i) Incidence rate is necessarily associated with a duration and can be obtained only through a cohort or a follow-up study; (ii) Incidence reflects causal factors. This is used to formulate and test hypothesis on etiology of the disease; and (iii) Incidence rate can also be calculated for spells or episodes instead of the affected persons. This would count a person two or more times if the same person gets repeated spells within the reference period such as in the case of diarrhea and asthmatic attacks. The Concept of Person-Time: The annual incidence reported(7) for Lucknow per 100 child-years for respiratory, diarrhea, skin diseases and pneumonia were 167, 79.9, 30.6 and 9.6, respectively. It is sometimes not possible to observe each person in a cohort for the same duration. Also, the duration of exposure may vary from subject to subject. For example, persons in stressful environment for different periods may be observed for incidence of peptic ulcer disease. One may be under stress for 12 years, second for 5 years, third for 3 years, etc. These durations are totaled and called person-years. If the ith person is observed for xi years then total person-years for n persons = S xi (i = 1,2, ... , n). While person-years is the most frequently used person time, this could also be person-months, person-weeks, etc. Incidence
rate per 100 person-years= (New cases occurring in the observed
period/ Person-years observed)* 100. This term is generally used when the exposure is for a limited period such as during an epidemic. Attack rate can be calculated per person-year also.
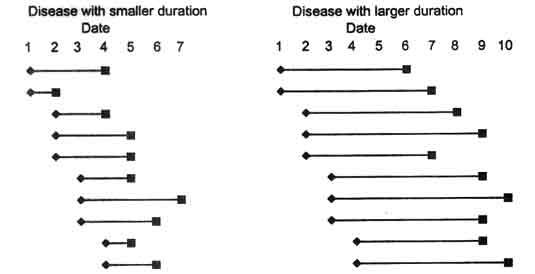
A follow-up study is relatively more expensive than a cross-sectional survey. Thus it is easier to find prevalence than incidence. Duration of disease does not affect incidence but severely affects prevalence. Prevalence tends to accumulate and becomes higher in case the duration is long. Since prevalence depends on the incidence and duration, the relationship can be exploited to find incidence on the basis of prevalence and duration. If there are no intervening factors then, Incidence =Prevalence/Average duration of sickness where incidence and duration are in the same time unit. If the average duration of sickness for a particular disease is 15 days then this is 15/365 = 0.041 years. If the prevalence is 1.2 per thousand and duration 15 days then incidence rate is 1.2/0.041 = 29 per thousand per year. If the prevalence rate is per 1000 persons then incidence too is a rate per 1000 persons. The incidence can be calculated for specific groups, such as age, gender, occupation and region by inserting the prevalence and duration for that group in the above formula. Figure 1 illustrates the effect of duration on prevalence when the incidence is same. The disease on the left side has shorter duration than the disease on the right side. The prevalence in the latter case is higher though the onset in both the cases is the same. For example, on the 6th day, the point prevalence is 3 cases on the left side and 10 cases on the right side where the duration of disease is longer. If the duration is reduced by intervention or otherwise, the prevalence would decline even when the incidence increases. Fig. 1. Pictorial presentation of smaller and larger durations of diseases to delineate the relationship between prevalence and incidence.
Precise incidence or prevalence rates are central to epidemiology but they are also very difficult to achieve. A critical component in disease monitoring is the degree of under count. One way to improve estimate of the rates is by correcting them for the level of ascertainment. The capture-recapture method was originally devised for obtaining counts of animals in the wild. Suppose a sample of n1 = 48 tigers is captured, marked and then released. They randomly mix with other tigers. Sub-sequently, a second sample of n2 = 35 tigers is captured from the same area. If m = 16 of them are found to have the mark, an estimate of the total number of tigers is obtained by inflating by a factor of (35/16). Thus an estimate of the total count N is 48 ´ 35/16 = 105. It has been statistically established that a better estimate in the long run is obtained when one is added to each of these numbers and finally one is subtracted. Thus, the capture-recapture estimate is N =((n1 + 1) (n2 + 1)(/m + 1)) – 1 where n1 is the size of the first smaple, n2 of second sample, and m is the number of cases found to appear in both the samples. Example: The methodology was adopted to assess the prevalence of childhood diabetes in Madrid, Spain(8). Population based registry identified 432 cases through hospital inpatient records. Another source was Spanish Diabetes Association. This recorded 138 cases. It was found on matching that 119 cases were common to the two sources. Thus, an estimate of the total number of cases of childhood diabetes (N) is N =((432 + 1) (138 + 1)/119 + 1()) – 1 = 501. The results can be converted to prevalence rates as shown in Table II. The cases in either source are under counts but the duplicates help to come up with an estimate of the total cases, as well as of the improved prevalence rate.
|
||||||||||||||||||||||||||||||||||||||||||||||||||||||
![]()