|
|
|
Indian Pediatr 2019;56:209-212 |
 |
Validating the MUAC
(Mid-upper arm circumference) Cut-off for Detection of Severe
Acute Malnutrition in Children Aged 6-59 Months in Rural
Maharashtra
|
|
R Sougaijam, SS Gupta, AV Raut, MS Bharambe and BS
Garg
From Department of Community Medicine, Dr Sushila
Nayar School of Public Health, Mahatma Gandhi Institute of Medical
Sciences Sewagram, Wardha, Maharashtra, India.
Correspondence to: Dr Reshma Sougaijam, Wangkhei
khunou, Ward no. 22, Imphal – 795001, Manipur, India,
Email:
[email protected]
Received: August 27, 2017;
Initial review: January 12, 2018;
Accepted: January 19, 2019.
|
Objective: To review the Mid-upper arm
circumference (MUAC) cut-off currently being used to identify Severe
Acute Malnutrition (SAM) as currently defined using Weight-for-Height.
Methods: Cross-sectional study conducted in 24 villages of a
Primary Health Centre in Wardha district of Maharashtra among 2650
children between the ages of 6 to 59 months. Results: For
identifying SAM, sensitivity of MUAC was 23.5% and specificity was 99.7%
for cut-off <11.5 cm. Using Youden index, best Mid-upper arm
circumference cut-off point to identify SAM was <13 cm with sensitivity
of 74.5% and specificity of 92.7%. Using Receiver operating
characteristics curve, best MUAC cut-off point was 12.8 cm with 74.5%
sensitivity and 92.7% specificity. Area under curve was 0.88 (95%CI:
0.85-0.91). Conclusion: The current MUAC cut-off of <11.5
cm for detecting SAM needs to be increased to ensure that children, who
need referral for management of malnutrition, are not missed.
Keywords: Anthropometry, Diagnosis, Undernutrition, Wasting,
|
|
I
n India, around 6.4% children
suffer from Severe
Acute Malnutrition (SAM) [1,2].
World Health
Organization (WHO) endorses Mid-upper arm
circumference (MUAC) as a suitable tool for identifying SAM. MUAC as
compared to the Weight-for-height (WFH)-based measurements confers
several advantages, and many agencies are using MUAC as a basis for
admitting children to feeding programs [3].
Usually WFH is used as the gold standard for
identifying SAM. However, several studies reveal that MUAC could be even
better than WFH for identifying SAM children at risk of death [4].
MUAC cut-off point 11.0 cm was related to
mortality risk and therefore was considered for use in malnutrition
screening and detection efforts among children between 6 and 59 months
of age [4-8]. However, in
2009, WHO recommended to increase the cut-off point from 11.0 to 11.5 cm
to define SAM with MUAC [9]. A multi-country study conducted in 2010
also supported the change in MUAC cut-off from <11.0 cm to <11.5 cm to
identify children at greatest risk of death resulting from severe
wasting [10].
As racial differences have been observed in body
composition of children, there is need to validate these cut-offs
separately for Indian children.
Therefore, the present study was undertaken to validate
the cut-off of MUAC for identifying SAM as currently defined using WFH.
Methods
The present study was conducted in 24 villages of
Talegaon Primary Health Centre (PHC) of Wardha district in Maharashtra
having a population of 44672. Study population was children
between 6 to 59 months of age. Assuming sensitivity of MUAC with
respect to WFH <-3 SD as 50%, desired precision of 10% for 95%
confidence, proportion of SAM children in age-group 6-59 months for
Maharashtra as 4% and a non-response rate of 10%, the estimated sample
size was 2650. Subjects were enrolled by house-to-house visit from April
2012 to March 2013 after obtaining written informed consent from the
mother. Nutritional status of the children was assessed with the help of
anthropometric measurements – weight, length/ height and MUAC.
The study was initiated after approval from
Institutional Ethics committee for human research at MGIMS, Sewagram.
The primary caregivers of study subjects were counseled regarding child
feeding. A list of children with SAM was provided to Anganwadi workers
and health care providers for facilitating treatment.
Statistical analyses: Data was analyzed in STATA
version 12, anthropometric analysis was done by using WHO’s ANTHRO
software. Each of the nutritional status indicators except for MUAC were
expressed in standard deviation units (Z-scores) from the median of the
reference population. Sensitivity and specificity of MUAC at particular
cut-off with respect to WFH Z score <–3 SD was calculated. Youden index
given by sensitivity + specificity –1 was calculated to know the
accuracy of the cut-off points of MUAC for identifying SAM. Receiver
operating characteristic (ROC) curve was also plotted to determine the
cut-off point of MUAC for detecting SAM using R-software.
Results
In the total 2650 study participants, 52% were males.
The prevalence (95% CI) of severe underweight (weight for age <–3 SD),
severe stunting (height for age <–3 SD) and severe wasting (weight for
height<-3 SD) was 11.1% (9.9-12.3), 13.9% (12.7-15.3) and 8% (3.8-5.4),
respectively (Table I). The best cut-off to diagnose SAM
was found at MUAC <12.8 cm, where sensitivity was 74.1% and specificity
was 93.2% and highest Youden index of 0.67 (Table II).
TABLE I Nutritional Status by Age of Children Aged 6-59 months (N=2650)
|
Age |
Wasting(W/H), n=839 |
Underweight(W/A), n=1369 |
Stunting(H/A), n=1481 |
|
<–2SD |
<–3SD |
<–2SD |
<–3SD |
<–2SD |
<–3SD |
|
6-11(n=285) |
69 (24.2%) |
26 (9.1%) |
74 (25.9%) |
23 (8.0%) |
55 (19.3%) |
15 (5.26%) |
|
12-23 (n=575) |
130 (22.6%) |
48 (8.4%) |
205 (35.7%) |
66 (11.5%) |
274 (47.7%) |
116 (20.2%) |
|
24-35 (n=570) |
138 (24.2%) |
52 (9.1%) |
244 (42.8%) |
83 (14.6%) |
255 (44.7%) |
106 (18.6%) |
|
36-47 (n=551) |
112 (20.3%) |
31 (5.6%) |
240 (43.7%) |
55 (9.9%) |
246 (44.7%) |
63 (11.4%) |
|
48-59 (n=669) |
178 (26.6%) |
55 (8.2%) |
312 (46.6%) |
66 (9.9%) |
281 (42%) |
70 (10.5%) |
|
Total (n=2650) |
627 (23.7%) |
212 (8%) |
1075 (40.6%) |
293 (11.1%) |
1111 (41.9%) |
370 (13.9%) |
TABLE  II	Sensitivity and Specificity of Mid-upper Arm Circumference (MUAC) as Compared to
Weight-for-height for Detecting Severe Acute Malnutrition
|
MUAC cut-off (cm) |
Sensitivity (%) |
Specificity (%) |
Youden index |
|
<11.0 (n=6) |
2.8 |
100 |
0.03 |
|
<11.5 (n=70) |
23.5 |
99.7 |
0.23 |
|
<12.0 (n=130) |
33.5 |
99.5 |
0.33 |
|
<12.5 (n=288) |
63.7 |
95.8 |
0.59 |
|
<12.8 (n=324) |
74.1 |
93.2 |
0.67 |
|
<13.0 (n=342) |
74.5 |
92.7 |
0.67 |
|
<13.5 (n=850) |
85.3 |
78.7 |
0.64 |
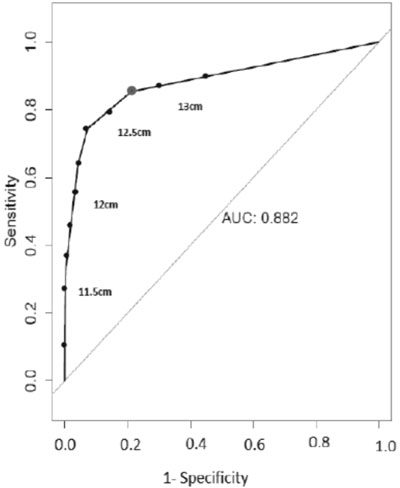
Fig. 1 shows receiver operating
characteristic curve for severe acute malnutrition (W/H <-3SD) and MUAC
(Area under curve 0.882; 95% CI: 0.85-0.91).
 |
|
Fig. 1 ROC for Severe acute
malnutrition (W/H <–3SD) and Mid-upper arm circumference.
|
Discussion
In the present study, prevalence of severe wasting
(WFH) was found to be 8%. For diagnosing SAM at cut-off <11.5 cm,
sensitivity was 23.5% while specificity was 99.7%. The best cut-off to
diagnose SAM was found at cut-off point <12.8cm where sensitivity was
74.1% and specificity was 93.2% and highest Youden index of 0.67.
As data collection for the current study was done
during home visits, we used Salter scale with 100 gm precision for
measuring weight. We understand, for this kind of study, the precision
of weight measurement is not optimum.
There was an increase in sensitivity for detecting
SAM as the MUAC cut-off increased from 11.0 cm to 13.0 cm without much
decline in specificity. Our findings are similar to that of Fernandez,
et al. [10] in their multi-country study. Studies from Africa
have reported a higher sensitivity for detecting SAM with cut-offs of
11.5 cm (65.1%) [5] when compared with the findings of the present
study. The present study also reiterates the findings of studies from
various regions of India [10-14], suggesting to increase the MUAC
cut-offs for detecting SAM. It will help to identify more number of SAM
children resulting from severe wasting.
A cut-off of 12.8 cm will be difficult to implement
in the public health policy context, therefore we recommend to use a
12.5 cm cut-off, as at 12.5 the burden of children without SAM
(false-positives) being referred to health facilities for treatment will
be much less than at a cut-off of 13 cm. This might have been the wisdom
behind the conventional MUAC cut-off levels of 12.5 cm and 13.5 cm.
MUAC is regarded as the best anthropometric measure
that indexes the muscle mass directly. However, a study from Ethiopia
[15] showed that at all ages, MUAC is more influenced than WFH by body
composition measured in terms of Fat Mass variability relative to the
fat-free mass variability.
Considering that racial difference or different ethnicities has been
observed in body composition [12,16], there is a need for
conducting a multi-centric study with adequate power to decide best MUAC
cut-off for detection of SAM among Indian children. Such a study would
help to overcome the limitation of limited external generalizability of
the present study as this was conducted in villages under only one PHC
area.
Contributors: RS,SSG,AVR: acquisition and
analysis of data, drafting the work; SSG,BSG: interpretation of data,
revising the draft and final approval; SG,SSG,AVR: revising the draft;
RS,MSB: statistical analysis of data; BSG,SSG,RS,AVR: conception and
design of the study.
Funding: None; Competing interest: None
stated.
|
What This Study Adds?
·
Sensitivity of Mid-upper arm
circumference at currently recommended cut-off of <11.5 cm to
detect severe acute malnutrition was low in a rural area of
Maharashtra.
|
References
1. International Institute for Population Sciences.
India National Family Health Survey (NFHS-3), 2005-06. International
Institute for Population Sciences; 2007.
2. Kapil U, Sachdev HP. Management of children with
severe acute malnutrition: A national priority. Indian Pediatr.
2010;47:651-3.
3. Myatt M, Duffield A. Weight-for-height and MUAC
for estimating the prevalence of acute undernutrition. Report for IASC,
UNICEF. 2007:104-10.
4. Myatt M, Khara T, Collins S. A review of methods
to detect cases of severely malnourished children in the community for
their admission into community-based theraputic care programs. Food Nutr
Bull. 2006;27:S7-23.
5. Berkley J, Mwangi I, Griffiths K, Ahmed I,
Mithwani S, English M, et al. Assessment of severe malnutrition
among hospitalized children in rural Kenya. JAMA. 2005;294:591-7.
6. Vella V, Tomkins A, Ndiku J, Marshal T, Cortinovis
I. Anthropometry as a predictor for mortality among Ugandan children,
allowing for socio-economic variables. Eur J Clin Nutr. 1994;48:189-97.
7. Chen LC, Chowdhury A, Huffman SL. Anthropometric
assessment of energy-protein malnutrition and subsequent risk of
mortality among preschool aged children. Am J Clin Nutr.
1980;33:1836-45.
8. Trowbridge FL, Sommer A. Nutritional anthropometry
and mortality risk. Am J Clin Nutr. 1981;34:2591-2.
9. World Health Organization. WHO Child Growth
Standards and the Identification of Severe Acute Malnutrition in Infants
and Children: A Joint Statement by the World Health Organization and the
United Nations Children’s Fund: World Health Organization (WHO); 2009.
10. Fernandez MA, Delchevalerie P, Van Herp M.
Accuracy of MUAC in the detection of severe wasting with the new WHO
growth standards. Pediatrics. 2010;126:195-201.
11. Dasgupta R, Sinha D, Jain SK, Prasad V. Screening
for SAM in the community: Is MUAC a ‘simple tool’? Indian Pediatr.
2013;50:154-5.
12. Shekhar S, Shah D. Validation of mid-upper-arm
circumference cut-offs to diagnose severe wasting in Indian children.
Indian Pediatr. 2012;49:496-7.
13. Kumar R, Aggarwal AK, Iyengar SD. Nutritional
status of children: Validity of mid-upper arm circumference for
screening undernutrition. Indian Pediatr. 1996;33: 189-96.
14. Kapil U, Pandey RM, Bansal R, Pant B, Varshney
AM, Yadav CP, et al. Mid-upper arm circumference in detection of
weight-for-height Z-score below-3 in children aged 6-59 months. Public
Health Nutr. 2018;21:1794-9.
15. Grijalva-Eternod CS, Wells JCK, Girma T, Kæstel
P, Admassu B, Henrik Friis H, et al. Mid upper arm circumference
and weight-for-length Z-scores have different associations with
body composition: evidence from a cohort of Ethiopian infants. Am J Clin
Nutr. 2015;102:593.
16. Shaw NJ, Crabtree NJ, Kibirige MS, Fordham JN.
Ethnic and gender differences in body fat in British schoolchildren as
measured by DXA. Arch Dis Child. 2007;92:872-5.
|
|
|
 |
|
