|
|
|
Indian Pediatr 2019;56:205-208 |
 |
Parental Education,
Children’s Nutritional Status and Non-verbal Intelligence in
Rural School-children
|
|
Rubina Mandlik, Veena Ekbote, Shashi Chiplonkar,
Vaman Khadilkar and Anuradha Khadilkar
From Hirabai Cowasji Jehangir Medical Research
Institute, Jehangir Hospital, Pune, Maharashtra, India.
Correspondence to: Dr Anuradha Khadilkar, Department
of Pediatrics, Hirabai Cowasji Jehangir Medical Research Institute,
Jehangir Hospital, 32 Sassoon Road, Pune 411 001, India.
Email:
[email protected]
Received: October 12, 2017;
Initial review: March 03, 2018;
Accepted: January 19, 2019.
|
Objective: To assess non-verbal intelligence and
its relationship with nutritional status, nutrient intakes and parents’
education in school-children. Methods: A cross-sectional,
observational study was conducted in children between 6-11 years,
without any known chronic disorder or intellectual disability. Data were
collected regarding parents’ education, anthropometry and dietary
intakes. Non-verbal intelligence was assessed by Raven’s Coloured
Progressive Matrices (RCPM). Results: In 323 enrolled children
(52.9% boys), a significant positive association was observed between
RCPM scores and parents’ education (father’s rs=0.14, mother’s
rs=0.22), height Z-scores (rs=0.14) and dietary intakes of
zinc (rs=0.14), iron (rs=0.12) and folate (rs=0.14).
Conclusion: Height in normal range, higher zinc, iron and
folate intakes, and parental higher educational levels were associated
with higher non-verbal intelligence scores.
Keywords: Cognitive function, Micronutrients, Raven’s Coloured
Progressive Matrices.
|
|
P
arental education and child’s nutritional status
are hypothesized to be major factors that affect a child’s cognitive
abilities [1,2]. Majority of the Indian population (70%) resides in
rural areas where literacy rates are as low as 68.9% [3]. The
nutritional status of children in rural areas has been reported to be
poor with high prevalence of micronutrient deficiencies [4]. Indian
studies suggest that poor cognitive development is related to poor
growth and low socio-economic status [2]. However, there are few reports
that have studied the relationship between cognitive development of
Indian children with micronutrient intake and their parents’ education.
Non-verbal intelligence indicates the ability to
learn, analyze, comprehend, and solve novel, complex problems without
the use of words [5]. Assessment tools like the Raven’s Coloured
Progressive Matrices (RCPM) are preferred in multicultural settings or
rural areas where poor language skills are a barrier [5].
The objectives of this study were to assess the
non-verbal intelligence in school-children from a rural setting and to
study the relationship of nutritional status, nutrient (zinc, iron and
folate) intakes and parents’ education with children’s non-verbal
intelligence.
Methods
This cross-sectional study was carried out in 6-11
year old children from a randomly selected primary school in Karegaon, a
rural area in Western Maharashtra, from mid June 2014 to end of July
2014. Children with known chronic disorders like diabetes, thalassemia
and intellectual disability were excluded [6]. According to earlier
reports of RCPM scores (70.65% children below average), considering a 4%
margin of error and 5% significance level, sample size of 313 was
computed [2]. Ethical approval was obtained from the Ethics Committee,
Jehangir Clinical Development Centre. Written informed consent was
obtained from parents.
Demographic data, socioeconomic status (SES) and
parents’ education were elicited by structured questionnaires [7].
Height, weight and hemoglobin concentrations were assessed by standard
techniques [8,9]. Anemia was categorized as mild (hemoglobin 11-11.4 g/dL)
and moderate (hemoglobin 8.0-10.9 g/dL) [9].
Clinical psychologists administered the RCPM test.
This measures the general ability of children aged 4 to 11 years, by 3
sets of "diagrammatic puzzles" (12 items in each), with increasing
levels of difficulty [5]. It takes about 15 minutes to administer the
test. Categorization of RCPM scores is as follows: Superior and High
Average (111-130), Average (91-110), Low Average (81-90), Borderline
(71-80) and Extremely Low ( £70)
[5].
Dietary intake was assessed by 24-hour dietary recall
taken over three non-consecutive days. Nutrient intakes were estimated
by the C-Diet software (a cooked foods database software) and were
compared to the Indian recommended dietary allowances (RDA) [10,11].
Dietary adequacy was computed based on Indian RDA.
SPSS for Windows (version 21.0.2012) was used for
statistical analyses. Normality of variables was tested using one-sample
Kolmogorov-Smirnov test. Chi-square test was used to test the
relationship between the categorical variables. Spearman’s Rank
correlation coefficient (r s)
was used to denote correlation between variables.
Results
The study population comprised of 323 children (52.9%
boys) with mean age of 8 (1.1) years and 89% belonging to middle SES.
Anthropometric parameters and nutritional intakes were comparable and
diets were deficient in both macronutrients and micronutrients. Mild
anemia was detected in 2.3% and moderate anemia in 4.5% children.
Table I depicts the distribution of RCPM scores and
inter-category comparison of demographics.
TABLE I Demographic Characteristics of Children According to the RCPM Scores
|
Parameters |
Superior and High |
Average |
Low Average |
Borderline |
Extremely |
|
Average (111 to 130) |
(91 to 110) |
(81 to 90) |
(71 to 80) |
Low(£70) |
|
n |
11 |
81 |
77 |
79 |
75 |
|
Gender |
|
Male |
73% |
49% |
53% |
54% |
52% |
|
Female |
27% |
51% |
47% |
46% |
48% |
|
Socio-Economic Status |
|
Low SES |
- |
3% |
6% |
8% |
8% |
|
Middle SES |
82% |
92% |
90% |
86% |
92% |
|
High SES |
18%# |
5% |
4% |
6% |
- |
|
Father’s Education |
|
High School and Above |
73% |
80% |
78% |
65%* |
63%* |
|
Lesser than High School |
27% |
20% |
22% |
35%* |
37%* |
|
Mother’s Education |
|
High School and Above |
55% |
56% |
42% |
44% |
24%# |
|
Lesser than High School |
45% |
44% |
57% |
56% |
76%# |
|
*Significantly different from ‘Average’ RCPM score; #Significantly different from other score categories. |
Children, whose parents had completed high school
education or more, attained significantly better scores compared to
children whose parents had lower education levels. Significant positive
associations, but with low correlation coefficients, were found between
both father’s (r s=0.14)
and mother’s (rs=0.22)
education and children’s RCPM score categories.
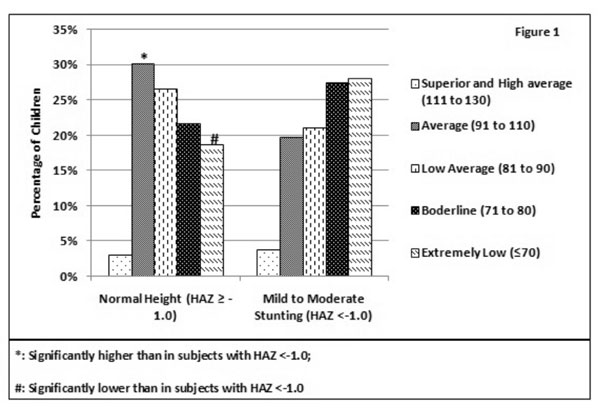
A significantly greater proportion of children (30%)
with normal heights (HAZ ³–1.0)
attained ‘Average’ RCPM scores compared to children (20%) with mild to
moderate stunting (HAZ<–1.0). The percentage of children with ‘Extremely
Low’ scores was lower among children with normal heights (19%) compared
to those with mild to moderate stunting (28%) (Fig. 1).
Similar trends, which were non-significant (P>0.05), were noted
between WAZ and RCPM scores.
 |
|
Fig. 1 Association of height-for-age
z-scores with RCPM standard scores.
|
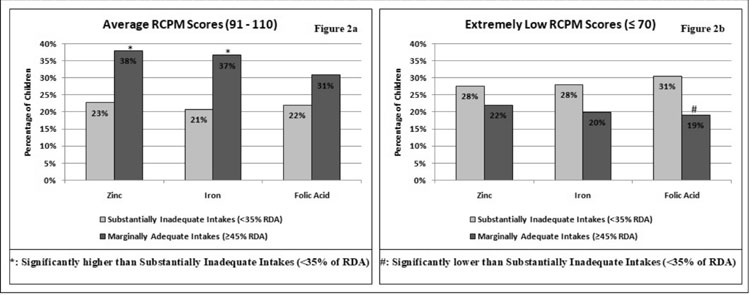
Significant, positive though weak correlations were
obtained for zinc (r=0.14), iron (r=0.12) and folate (r=0.14)
intakes with RCPM scores. These correlations were investigated further
by categorizing micronutrient intakes according to tertiles generated
from the data into 3 groups: substantially inadequate intakes (<35% of
RDA), marginally inadequate intakes (35 to 44% of RDA) and marginally
adequate intakes (³45%
of RDA); and exploring their associations with RCPM categories. A
greater percentage of children, who had marginally adequate intakes of
zinc (38%), iron (37%) and folate (31%) separately, scored ‘Average’
RCPM scores compared to children who had substantially inadequate
intakes of zinc (23%), iron (21%) and folate (22%) (Fig. 2a).
Also, among the children with marginally adequate intakes, the
percentage of children who scored ‘Extremely Low’ RCPM scores were
lesser compared to children with substantially inadequate intakes of
zinc, iron and folate (Fig. 2b).
 |
| (a) |
(b) |
|
Fig. 2 Comparison of percentage of
children with ‘Average’ (a), and extremely low (b) RCPM Scores
among micronutrient intake categories.
|
Discussion
This observational study in 6-11 year old children
from a single school in a rural area reveals that majority of children
had below average scores (£90)
in non-verbal intelligence measured by RCPM. Significant positive
associations were found between parents’ education, children’s height
(indicator of nutritional status) and intakes of iron, zinc and folate
with RCPM scores.
Comparably, in a study of Santal tribal children,
RCPM scores of well-nourished children as well as of those from upper
SES were found to be significantly higher than that of the poorly
nourished children and those from lower SES, respectively [2]. The
absence of association of RCPM scores with SES in our study can be
explained by the relatively homogeneous socio-economic status
distribution. However, we did observe positive though weak associations
of paternal and maternal education with RCPM scores, with the latter
demonstrating a stronger association. Schooling, more than household
wealth, has been proposed to be a reliable assessment of SES and
maternal schooling has been demonstrated to exert a strong influence on
children’s cognitive functions [1]. The weak associations obtained
between parental education and RCPM scores may be because other than
parental education level, data related to important factors like
parenting style and family interactions, which also have an influence on
cognitive outcomes, was not collected by us.
It has also been demonstrated in previous studies in
children that micronutrient intakes are positively associated with
cognitive test scores. We observed that though diets of the study
children were overall deficient in micronutrients, those whose diets had
relatively higher amounts of zinc, iron and folate performed better in
RCPM test. Sen, et al. [12] demonstrated that anemia
negatively affected cognition in Indian adolescent girls and
demonstrated an improvement in assessment scores with iron-folic acid
supplementation. Serum folate levels have shown weak significant
positive associations with cognitive test scores in the NHANES III data
on 6-16 year olds [13]. Supplementation studies with zinc-rich foods
have demonstrated positive effects on cognition in young, undernourished
Indian adolescent girls [14]. However, we found poor associations of
micronutrient intakes with RCPM scores in our study; this may possibly
be because current dietary intakes may not have an association with
long-term outcomes such as cognition.
This study being an observational study, only
provides an insight into limited factors that are associated with
non-verbal intelligence in school-children from a rural setting. Further
studies are required to elucidate the mechanisms of association of
different variables observed in this study with non-verbal intelligence
in school-children. Also, long-term supplementation studies which
consider factors such as parenting and family interactions are required.
Thus, in rural school-children, parent’s, especially
mother’s education, children’s linear growth and dietary intakes of
zinc, iron and folate may be important influencers of outcomes in
non-verbal tests of intelligence.
Acknowledgements: We are grateful for the help
and support of Neha Kajale and Sonal Palande. We are thankful to all the
psychologists who administered the Raven’s CPM test and assisted with
its interpretation. We also wish to thank the school principals,
teachers and school staff.
Contributors: RM: data collection, analyses and
drafted the initial manuscript; VHE: assisted with data collection, data
analysis and manuscript revisions; SAC: conceptualized and designed the
study, carried out the analyses, reviewed and revised the manuscript,
and approved the final manuscript as submitted; VVK: conceptualized and
designed the study, critically reviewed the manuscript, and approved the
final manuscript as submitted; AVK: conceptualized and designed the
study, reviewed and revised the manuscript, and approved the final
manuscript as submitted. All authors approved the manuscript, are
accountable for all aspects.
Funding: Rubina Mandlik was funded by a
fellowship grant from the University Grants Commission (UGC), Government
of India.
Competing interest: None stated.
|
What This Study Adds?
•
Majority (72%) of the 6-11 year-old children from rural setting
had ‘Low Average’ or lower scores (i.e.<90) in non-verbal
intelligence tests.
• Maternal education status, child’s
linear growth and dietary intakes of iron, zinc and folic acid
demonstrated significant, positive but weak associations with
children’s RCPM scores.
|
References
1. Crookston BT, Forste R, McClellan C, Georgiadis A,
Heaton TB. Factors associated with cognitive achievement in late
childhood and adolescence: The Young Lives cohort study of children in
Ethiopia, India, Peru, and Vietnam. BMC Pediatr. 2014;14:253.
2. Chowdhury DS, Ghosh T. Nutritional and
socioeconomic status in cognitive development of Santal children of
Purulia district, India. Ann Hum Biol. 2011;38:188-93.
3. Government of India. Census of India 2011: Rural
Urban distribution of population. Ministry of Home Affairs Government of
India. 2011 Available from:
http://censusindia.gov.in/2011-prov-results/paper2/data_files/india/Rural_Urban_2011.pdf.
Accessed May 20, 2018.
4. Laxmaiah A, Arlappa N, Balakrishna N, Mallikarjuna
Rao K, Galreddy C, Kumar S, et al. Prevalence and determinants of
micronutrient deficiencies among rural children of eight states in
India. Ann Nutr Metab. 2013;62:231-41.
5. Raven J. Coloured Progressive Matrices and
Crichton Vocabulary Scale India Edition. Bengaluru: NCS Pearson (India)
Pvt Ltd; 2004. p. 1-99.
6. Diagnostic and Statistical Manual of Mental
Disorders: DSM-5. 5th ed. Arlington, Virginia, USA: American Psychiatric
Association; 2013.
7. Kumar N, Shekhar C, Kumar P, Kundu A. Kuppuswamy’s
socioeconomic status scale-updating for 2007. Indian J Pediatr.
2007;74:1131-2.
8. Khadilkar V, Yadav S, Agrawal K, Tamboli S,
Banerjee M, Cherian A, et al. Revised IAP growth charts for
height, weight and body mass index for 5-18-year-old Indian children.
Indian Pediatr. 2015;52:47-55.
9. World Health Organization. Haemoglobin
concentrations for the diagnosis of anaemia and assessment of severity.
In: Vitamin and Mineral Nutrition Information System. 2011. p.
1-6.
10. Chiplonkar S. CDiet – Bellycheaters. Available
from: https://bellycheaters.com/cdiet/. Accessed October 05,
2018.
11. Indian Council of Medical Research. Nutrient
Requirements and Recommended Dietary Allowances for Indians. ICMR: New
Delhi; 2009. p. 1-334.
12. Sen A, Kanani SJ. Impact of iron-folic acid
supple-mentation on cognitive abilities of school girls in Vadodara.
Indian Pediatr. 2009;46:137-43.
13. Nguyen C, Gracely E, Lee B. Serum folate but not
vitamin B-12 concentrations are positively associated with cognitive
test scores in children aged 6–16 years. J Nutr. 2013;143:500.
14. Tupe RP, Chiplonkar SA. Zinc supplementation
improved cognitive performance and taste acuity in Indian adolescent
girls. J Am Coll Nutr. 2009;28:388-96.
|
|
|
 |
|
