|
|
|
Indian Pediatr 2017;54: 215-221 |
 |
Accuracy of Tactile Assessment of Fever in
Children by Caregivers:
A Systematic Review and Meta-analysis
|
|
Yan-Wei Li, Le-Shan Zhou and Xing Li
From Nursing department, Tongji Hospital, Tongji
Medical College, Huazhong University of Science and Technology, Wuhan,
China
Correspondence to: Le-Shan Zhou, Professor, Xiangya
Nursing School, Central South University, No 172, Tongzipo Road, Yuelu
District, Changsha City, 410013, China. [email protected]
Published online: February 02, 2017.
PII:S097475591600044
|
|
Context: Fever is the most common
complaint in the pediatric and emergency departments. Caregivers prefer
to detect fever in their children by tactile assessment.
Objective: To summarize the
evidence on the accuracy of caregivers’ tactile assessment for detecting
fever in children.
Evidence-acquisition: We
performed a literature search of Cochrane Library, PubMed, Web of
Knowledge, EMBASE (ovid), EBSCO and Google Scholar, without restriction
of publication date, to identify English articles assessing caregivers’
ability of detecting fever in children by tactile assessment. Quality
assessment was based on the 2011 Quality Assessment of Diagnostic
Accuracy Studies (QUADAS-2) criteria. Pooled estimates of sensitivity
and specificity were calculated with use of bivariate model and summary
receiver operation characteristics plots for meta-analysis.
Results: 11 articles were
included in our analysis. The summary estimates for tactile assessment
as a diagnostic tool revealed a sensitivity of 87.5% (95% CI 79.3% to
92.8%) and specificity of 54.6% (95% CI 38.5% to 69.9%). The pooled
positive likelihood ratio was 1.93 (95% CI 1.39 to 2.67) and negative
likelihood ratio was 0.23 (95% CI 0.15 to 0.36). Area under curve was
0.82 (95% CI 0.7 to 0.85). The pooled diagnostic odds ratio was 8.46
(95% CI 4.54 to 15.76).
Conclusion: Tactile assessment of
fever in children by palpation has moderate diagnostic value.
Caregivers’ assessment as "no fever" by touch is quite accurate in
ruling out fever, while assessment as "fever" can be considered but
needs confirmation
Keywords: Assessment, Measurement, Parents and
Pyrexia.
|
|
F
ever is the most common complaint
in the pediatric out-patient and emergency departments, accounting for
almost one-third of these visits [1,2]. Fever is a vital symptom for
diagnosis. In a child, many infections disease either single or in
combination could present with fever [3]. Although thermometers are
readily available at home, parents still prefer to detect fever by
touch. A study from New York revealed that although 78% parents owned a
thermometer at home, 48% still used palpation as the usual method to
detect fever, and up to 87% of parents used palpation at least
occasionally [4], similar to that reported by other authors [5,6]. It is
a fact that tactile assessment of fever by palpation is universal due to
its convenience.
The initial diagnosis of fever in a child is based
almost entirely on the assessment by the caregivers [7]. The ability of
caregivers to detect fever accurately in children by tactile examination
is critical in preventing a first stage delay in the management of
childhood illnesses [8]. The World Health Organization and United
Nations Children’s Fund assume that mothers are able to assess their
children by palpation for the presence of fever [9]. However, it is
controversial about whether caregivers have the ability to accurately
evaluate their children’ body temperature. Some studies suggest that
there are significant inaccuracies in tactile assessment of body
temperature, and objective measurement of temperature is recommended
[8-10]. While findings in other studies showed that caregivers were able
to provide accurate information about the presence or absence of fever
in their children by palpation without the use of a thermometer [11-13].
Therefore, tactile assessment could be accept as a reliable screening
tool for fever determination, and caregivers’ description of their
children’ history of fever should be considered when giving medical
decisions [11-13].
Teng, et al. [10] conducted a systematic
review in 2007 about the accuracy of mother’s touch to detect fever in
children. Many new studies have since been published in the topic. We,
therefore, conducted this updated systematic review on the accuracy of
palpation by caregiver to detect fever.
Methods
This systematic review was conducted according to the
guidance of the Preferred Reporting Items for Systematic Review and Meta
Analyses (PRISMA) Statement [14].
Search Strategy
We searched the databases of Cochrane Library, Pub
Med, Web of knowledge, EMBASE (Ovid), EBSCO and Google Scholar for
diagnostic studies in English comparing tactile assessment of fever with
objective method using a thermometer, without date restrictions. We used
the following search terms: child or children, fever or febrile, palpate
or palpation or touch or tactile or subjective assesment. Hand-search
was performed after screening the reference lists of the retrived
articles for pertinent publications. Abstracts were reviewed and
full-text articles were obtained for studies that met the eligibility
criteria.
Study Selection
Inclusion criteria: (a) published original
papers in English; (b) evaluated the accuracy of palpation by
parents as a method of detecting fever in children, compared with
thermometer measurement; and (c) provided detailed information on
the sensitivity, specificity, positive predictive value (PPV) and
negative predictive value (NPV) of tactile assessment. We contacted the
corresponding authors to obtain missing information when necessary.
Exclusion criteria: (a) tactile assessment
was not done during the study, which means tactile assessment was done
at a different time and could not be compared against thermometer
measurement at the same time; (b) publication with only title and
abstract, and full text could not be obtained after contacting the
corresponding authors twice; and (c) duplications, letters and
reviews.
Data were extracted independently through a
standardized protocol by two reviewers. Disagreements between the two of
them were recorded and resolved by consultation with a third author. We
recorded characteristics of the study (author, design, year of
publication, study country, and setting), study population (sample size,
age range, inclusion and exclusion criteria, and prevalence of fever),
reference standard (axillary temperature or rectal temperature or
others, diagnostic cut-off), and index tests (definition, procedures,
and link with inclusion criteria) on predefined forms. The diagnostic
performance measure for index tests: sensitivity, specificity, positive
predictive value (PPV), negative predictive value (NPV), positive
likelihood ratio (–LR), negative likelihood ratio (–LR) were also
collected.
Quality Assessment
We assessed the quality of selected studies and
potential risk of bias with the 2011 revised version of the Quality
Assessment of Diagnostic Accuracy Studies (QUADAS-2), adapted to the
review diagnostic accuracy studies, as recommended by the Cochrane
Collaboration. This tool is composed of four domains that consider
patient selection, index test, reference standard and flow of patients
through the study, and timing of the index tests [15]. The quality
assessment was done independently by two authors. Any disagreement was
resolved through discussion and consensus.
Data Synthesis and Analysis
Statistical analysis was performed using STATA
software version12.0 (Stata Corporation, College Station, Texas, USA).
Bivariate binomial mixed model was chosen and computed using the Midas
program, as recommended by the Cochrane Collaboration for meta-analysis
of diagnostic accuracy studies [16]. Meta-analytic integration of
appointed studies was used for pooled estimated sensitivity, pooled
estimated specificity, positive likelihood ratio, negative likelihood
ratio, diagnostic odds ratio and variations (Chi-square, I-square, LRT
p) for heterogeneity assessment. A summary receiver operating
characteristic (SROC) curve was drawn to identify diagnostic performance
of tactile assessment from the area under the curve (AUC). Publication
bias was explored using Egger’s test and Funnel plots.
Results
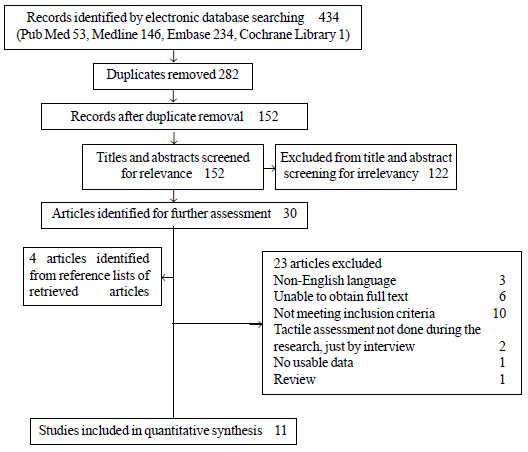
The study selection process is displayed in Fig.
1. Eleven full-text articles [4,10,13,17-24] were included in the
quantitative study and underwent quality assessment using QUADAS-2(http://www.bristol.ac.uk/social-community-medicine/projects/quadas/quadas-2/).
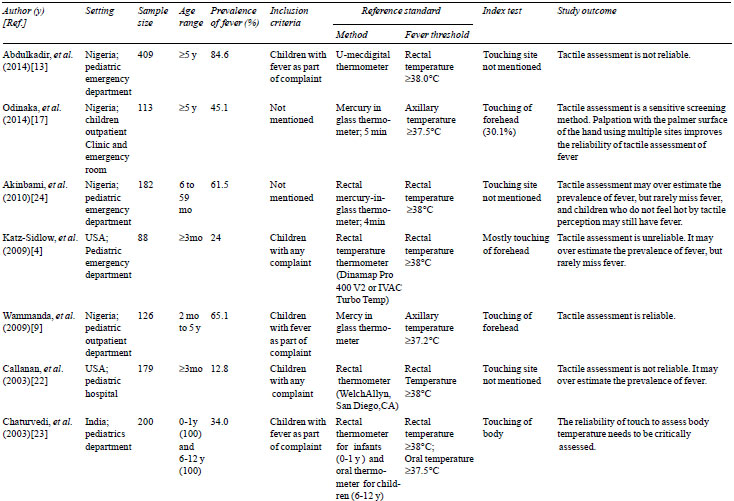
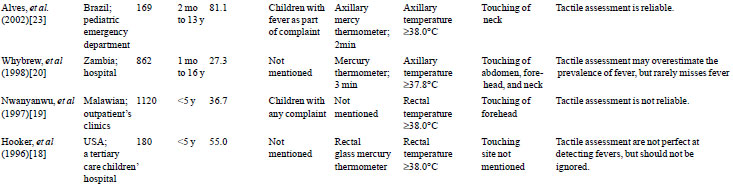
Table I summarizes the characteristics of the included
studies. The 11 included studies were conducted in various
countries/regions in the world and included a total of 3,625 children.
Major variations in sensitivity, specificity, positive predictive value,
negative predictive value existed in these studies Table II.
 |
|
Fig. 1 Flow diagram of the study
selection process.
|
TABLE I Characteristics of Included Diagnostic Studies
 |
|
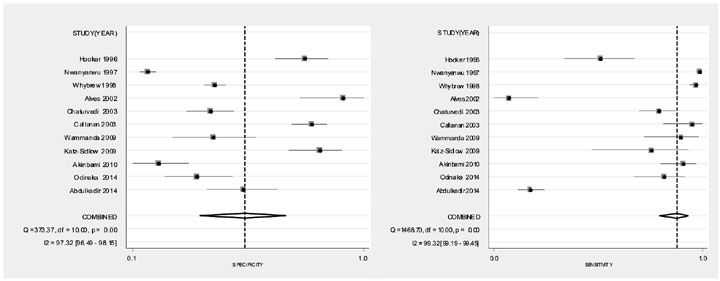
Fig. 2 Forest plot for sensitivity and
specificity of tactile assessment.
|
Quality assessment: Risk of bias and
applicability of the included studies are displayed in Table
III. Overall the 11 studies were rated with an average acceptable
applicability. The majority of the included studies were at low risk for
two categories with respect to applicability, including the patient and
index test. Most studies used convenience samples, leading to high risk
of bias in the patient section domain.
TABLE II The Diagnostic Parameters of Tactile Assessment in the Included Studies
|
Studies |
TP/n |
FP/n |
FN/n |
TN/n |
Sen/% |
Spe/% |
PLR |
NLR |
DOR |
|
Abdulkadir, et al. (2014) |
218 |
29 |
128 |
34 |
63.0 |
54.0 |
1.37 |
0.69 |
2.00 |
|
Odinaka, et al .(2014) |
42 |
39 |
9 |
23 |
82.4 |
37.1 |
1.31 |
0.48 |
2.75 |
|
Akinbami, et al. (2010) |
106 |
54 |
6 |
16 |
94.6 |
22.9 |
1.23 |
0.23 |
5.23 |
|
Katz-Sidlow, et al. (2009) |
17 |
12 |
4 |
55 |
81 |
82 |
4.52 |
0.23 |
19.48 |
|
Wammanda, et al. (2009) |
79 |
25 |
3 |
19 |
96.3 |
43.2 |
1.70 |
0.08 |
20.01 |
|
Callanan, et al. (2003) |
21 |
33 |
2 |
123 |
91.3 |
78.8 |
4.32 |
0.11 |
39.14 |
|
Chaturvedi, et al. (2003) |
48 |
75 |
20 |
54 |
70.5 |
40.9 |
1.21 |
0.70 |
1.73 |
|
Alves, et al. (2002) |
104 |
3 |
33 |
29 |
75.9 |
90.6 |
8.10 |
0.27 |
30.46 |
|
Whybrew, et al. (1998) |
221 |
353 |
15 |
273 |
93.6 |
43.6 |
1.66 |
0.15 |
11.39 |
|
Nwanyanwu, et al. (1997) |
399 |
574 |
11 |
136 |
97.3 |
19.2 |
1.20 |
0.14 |
8.59 |
|
Hooker, et al. (1996) |
81 |
19 |
18 |
62 |
81.8 |
76.5 |
3.49 |
0.24 |
14.68 |
Notes: TP: true positive; FP: false positive; TN: true negative; FN: false negative;
Sen: sensitivity; Spe: specificity; PLR: positive likelihood ratio; NLR:negative
likelihood ratio; DOR: diagnostic odds ratio; n: number of  children.
|
TABLE III	Bias and Applicability: The Relative Level Bias Assessment of Bias Risk and Applicability
Concerns Across the Included Studies
|
Study |
Risk of bias |
Applicability concerns |
|
Patient |
Index |
Reference
|
Flow and |
Patient
|
Index |
Reference
|
|
selection |
test |
standard |
timing |
selection |
test |
standard |
|
Abdulkadir, et al. (2014) |
High |
High |
Low |
Low |
Low |
High |
Low |
|
Odinaka, et al. (2014) |
Low |
Low |
Low |
Low |
Low |
Low |
Low |
|
Akinbami, et al. (2010) |
High |
Low |
Low |
Low |
Low |
High |
Low |
|
Katz-Sidlow, et al. (2009) |
High |
Low |
High |
Low |
High |
Low |
Low |
|
Wammanda, et al. (2009) |
High |
Low |
High |
Low |
Low |
Low |
High |
|
Callanan, et al. (2003) |
High |
High |
High |
Low |
High |
High |
Low |
|
Chaturvedi, et al. (2003) |
High |
Low |
Low |
Low |
High |
Low |
High |
|
Alves, et al. (2002) |
Low |
Low |
Low |
Low |
Low |
Low |
High |
|
Whybrew (1998) |
High |
Low |
Low |
Low |
Low |
Low |
High |
|
Nwanyanwu, et al. (1997) |
Low |
Low |
High |
Low |
Low |
Low |
Low |
|
Hooker, et al. (1996) |
High |
High |
Low |
Low |
Low |
High |
Low |
Meta-analysis: The pooled sensitivity of
tactile assessment as a method of detecting fever was 87.5% (95% CI
79.3% to 92 8%) and the pooled specificity was 54.6% (95% CI 38.5% to
69.9%). The pooled diagnostic odds ratio was 8.46 (95%CI, 4.54 to15.76).
Significant heterogeneity was found among studies (P<0.001, I 2=99.3).
Forest plot for sensitivity and specificity of
tactile assessment is showed in Fig. 2. The funnel plot
and the test indicates no publication bias (P=0.11).
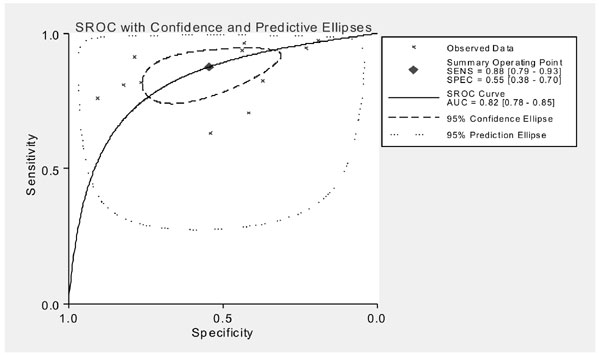
The SROC curve of sensitivity vs. specificity
of tactile assessment suggests diagnostic cut-off located in the point
where sensitivity was 0.88 and specificity 0.55. It also indicates that
there was no threshold effect. Area under curve was 0.82 (95% CI 0.7 to
0.85), predicting moderate diagnostic value (Fig. 3). When
looking at the likelihood ratios (measures that are more meaningful for
clinical decisions), pooled estimates of positive likelihood ratio were
1.93 (95% CI 1.39 to 2.67), and pooled estimates of negative likelihood
ratio were 0.23 (95% CI 0.15 to 0.36).
 |
|
Fig. 3 SROC curve of sensitivity
versus specificity of tactile assessment.
|
Discussion
This systematic review and meta-analysis documented
that tactile assessment of fever by caregiver in children had moderate
diagnostic value. The reasonably high sensitivity and low negative
likelihood ratio indicated that caregivers’ assessment of ‘no fever’
were quite accurate. When a child had no fever, the caregiver can
perhaps accurately judge it by palpation. On the other hand, the
specificity and the positive likelihood ratio were not good enough,
meaning thereby that caregivers’ assessment of ‘fever’ was not that
reliable and confirmation was needed. Tactile assessment was therefore
more useful to exclude fever rather than to confirm fever.
There are some limitations of this review. First, six
potentially relevant articles could not be included because of missing
information [25-30]. In the abstract of four of these studies, it was
stated that caregivers’ assessment of fever was reliable [25-27,30] with
relatively high sensitivity. Abstracts of the other two articles could
not be found [28,29]. Second, the quality of the results was moderate to
low. Also there was significant heterogeneity among the chosen studies
for the meta-analysis. Although bivariate binomial mixed model allowing
for heterogeneity was used in our analysis [31], the heterogeneity could
not be eliminated through statistical methods. The heterogeneity was
supposed to be caused by the significant differences in educational
background, severity of pyrexia, age of child, methods of temperature
recording, fever threshold and research design in the included studies.
The results of our study were similar to the findings
of a previous systematic review [10]. The diagnostic odds ratio was
different from that of the earlier review, but the 95% confidence level
was still above one. We added area under curve to indicate diagnostic
value, which is more convincing when the diagnostic cut-off is
different.
As a subjective method, tactile assessment of fever
had not reached a uniform standard so far. There were only few studies
exploring the effect of different palpation method (site used, part of
hand used) on reliability of tactile assessment. Odinaka’s study [17]
revealed that palpation with the palmar surface of the hand using
multiple sites improves the reliability of tactile assessment of fever.
Since detecting fever by touch has some value for reference, we can
explore some techniques to improve the reliability of this method and
carry out relevant education to caregivers.
Contributors: YWL: conceptualized and designed
the study, carried out the analyses, interpreted the data, drafted the
initial manuscript, and approved the final manuscript as submitted; LSZ:
conceptualized and designed the study, assisted in the interpretation of
the results, revised the manuscript, and approved the final manuscript
as submitted; XL: assisted in data extraction and the interpretation of
the results, and approved the final manuscript as submitted.
Funding: None; Competing interest: None
stated.
References
1. Wallenstein MB, Schroeder AR, Hole MK, Ryan C,
Fijalkowski N, Alvarez E, et al. Fever literacy and fever phobia.
Clin Pediatr. 2013;52:254-9.
2. Dai YT, Lu SH. What’s missing for evidence-based
fever management? Is fever beneficial or harmful to humans? Int J Nurs
Stud. 2012;49:505-7.
3. Behrman RE, Kliegman RM, Jenson HB. Nelson
Textbook of Paediatrics. 16 Edition. WB Saunders Company: New York;
2000. p. 2-3.
4. Katz-Sidlow RJ, Rowberry JP, H M. Fever
determination in young infants: prevalence and accuracy of parental
palpation. Pediatr Emerg Care. 2009;25:12-4.
5. Polat M, Kara S, Tezer H, Tapýsýz A, Derinöz O,
Dolgun A. A current analysis of caregivers’ approaches to fever and
antipyretic usage. J Infect Dev Ctries. 2014;8:365-71.
6. Zyoud SH, Al-Jabi SW, Sweileh WM, Nabulsi MM,
Tubaila MF, Awang R, et al. Beliefs and practices regarding
childhood fever among parents: A cross-sectional study from Palestine.
BMC Pediatr. 2013;13:1-8.
7. Einterz EM, Bates ME. Fever in Africa: Do patients
know when they are hot? Lancet. 1997;350:781.
8. Asekun-Olarinmoye EO, Egbewale BE, Olajide FO.
Subjective assessment of childhood fever by mothers utilizing primary
health care facilities in Osogbo, Osun State, Nigeria. Niger J Clin
Pract. 2009;12:434-8.
9. Wammanda RD, Onazi SO. Ability of mothers to
assess the presence of fever in their children: Implication for the
treatment of fever under the IMCI guidelines. Ann Afr Med.
2009;8:173-6.
10. Teng CL, Ng CJ, Nik-Sherina H, Zailinawati AH,
Tong SF. The accuracy of mother’s touch to detect fever in children: A
systematic review. J Trop Pediatrics. 2007;54:70-3.
11. Oyakhirome S, Profanter K, Kremsner PG.
Assessment of fever in African children: implication for malaria trials.
Am Soc Trop Med Hyg. 2010;82:215-8.
12. Jawad J, Faisal B, Shafique M, Ghafoor T.
Maternal perception of fever in children by tactile technique, How valid
it is? Pak Armed Forces Med J. 2014;64:488-92.
13. Abdulkadir MB, Johnson WB, Ibraheem RM. Validity
and accuracy of maternal tactile assessment for fever in under-five
children in north central Nigeria: a cross-sectional study. BMJ Open.
2014;4:e005776.
14. Moher D, Liberati A, Tetzlaff J, Altman D, Group
P. Preferred reporting items for systematic reviews and meta-analyses:
the PRISMA statement. Ann Intern Med. 2009; 151:264-9.
15. Whiting PF, Rutjes AW, Westwood ME, Mallett S,
Deeks JJ, Reitsma JB, et al. QUADAS-2: a revised tool for the
quality assessment of diagnostic accuracy studies. Ann Intern Med.
2011;155:529-36.
16. Macaskill P, Gatsonis C, Deeks J, Harbord R,
Takwoingi Y. Chapter 10: Analysing and Presenting Results. In:
Deeks JJ, Bossuyt PM, Gatsonis C (eds). Cochrane handbook for systematic
reviews of diagnostic test accuracy version 1.0, The Cochrane
Collaboration. 2010. Available from://srdta.cochrane.org.
Accessed January 6, 2014.
17. Odinaka KK, Edelu BO, Nwolisa EC. Accuracy of
subjective assessment of fever by Nigerian mothers in under-5 children.
Niger Med J. 2014;55:338-41.
18. Hooker EA, Smith SW, Miles T, King L. Subjective
assessment of fever by parents: comparison with measurement by
noncontact tympanic thermometer and calibrated rectal glass mercury
thermometer. Ann Emerg Med. 1996;28:313-7.
19. Nwanyanwu OC, Ziba C, Redd SC, Luby SP. Palpation
as a method of fever determination in Malawian children who are less
than 5 years old: how reliable is it? Ann Trop Med Parasitol.
1997;91:359-63.
20. Whybrew K, Murray M, Morley C. Diagnosing fever
by touch: observational study. BMJ. 1998;317:321-30.
21. Alves J, Correia JD. Ability of mothers to assess
the presence of fever in their children without using a thermometer.
Trop Doct. 2002;32:145-6.
22. Callanan, D. Detecting fever in young infants:
Reliability of perceived, pacifier, and temporal artery temperatures in
infants younger than 3 months of age. Pediatr Emerg Care.
2003;19:240-3.
23. Chaturvedi D, Vilhekar KY, Chaturvedi P, Bharambe
MS. Reliability of perception of fever by touch. Indian J Pediatr.
2003;70:871-3.
24. Akinbami FO, Orimadegun AE, Tongo OO, Okafor OO,
Akinyinka OO. Detection of fever in children emergency care: Comparisons
of tactile and rectal temperatures in Nigerian children. BMC Res
Notes. 2010;3:108.
25. Banco L, Veltri D. Ability of mothers to
subjectively assess the presence of fever in their children. AM J Dis
Child. 1984;138:976-8.
26. Ernst TN, Philp M. Temperature assessment by
parental palpation. AM J Dis Child. 1985;139:546-7.
27. Singhi S, Sood V. Reliability of subjective
assessment of fever by mothers. Indian Pediatr. 1990;27:811-5.
28. Ford H, Hoffman BD. How good is the hand?: What
is the value of tactile fever perception among children’s caregivers?
Pediatr Res. 2004;55S:238-9.
29. Ozuah PO. Feeling the heat: Subjective assessment
of fever by parents. Pediatr Res. 2001;49:131.
30. Al-Almaie SM. The reliability of mothers to
assess the presence of fever in their children. Saudi Med J.
1999;20:696-8.
31. Rambaud-Althaus C, Althaus F, Genton B,
D’Acremont V. Clinical features for diagnosis of pneumonia in children
younger than 5 years: A systematic review and meta-analysis. Lancet
Infect Dis. 2015;15:439-50.
|
|
|
 |
|