|
|
|
Indian Pediatr 2017;54: 193-198 |
 |
Lean Body Mass and Bone
Health in Urban Adolescents From Northern India
|
|
*Raman K Marwaha, #MK
Garg, $Kuntal
Bhadra, ‡Namita
Mahalle, **Ambrish Mithal and ##Nikhil
Tandon
From #Army Hospital (Research &
Referral) Delhi Cantt, New Delhi; India, $Department
of Endocrinology and Thyroid Research Centre, Institute of Nuclear
Medicine & Allied Sciences, Delhi; ‡Biochemistry
Division Department of Pathology, Deenanath Mangeshkar Hospital and
Research Center, Pune; ** Division of Endocrinology and
Diabetes, Medanta,
The Medicity, Gurgaon; and ##Department of
Endocrinology and Metabolism, AIIMS, New Delhi, India.
Correspondence to: Maj Gen (retd) Dr RK Marwaha, Flat
No 17, Gautam Apartments, Gautam Nagar, New Delhi 110 049, Email:
marwaha_ramank@hotmail.com
Received: August 04, 2015;
Initial review: October 20, 2015;
Accepted: December 27, 2016.
Published online: February 02, 2017.
PII:S097475591600039
|
Objective: To prepare percentile charts of lean body mass (LBM)
among Indian urban children and adolescents; and to evaluate gender
differences in LBM, and its relation with pubertal status.
Design: Secondary data analysis.
Setting: School in city of Delhi, India.
Participants: 1403 apparently healthy children
and adolescents (826 boys) with mean (SD) age 13.2 (2.7) years.
Outcome measures: Lean body mass assessed by dual
energy absorptiometry.
Results: Total and regional lean mass were
greater in older age groups in both sexes. LBM showed rising trends up
to the age of 18 years in boys, whereas it plateaued after the age of 15
years in girls. The age-associated increase in LBM was significantly
higher in boys (130%) compared to girls (83%) (P<0.001). Total
and regional lean mass increased with progression of pubertal staging in
both genders. During pubertal development, LBM almost doubled (100%
increase) from stage-2 to stage-5 in boys, as opposed to a 73% rise in
girls (P<0.001). Total and regional lean mass and Appendicular
skeletal muscle mass index (ASMI) was positively correlated with age,
body mass index (BMI), serum 25(OH)D, total fat mass, and bone mineral
content (BMC). Relation between LBM and BMC remained significant even
after adjusting for age, fat mass and various biochemical parameters.
Conclusions: Total and regional LBM rise with age
and pubertal maturation in both genders, but more so in boys when
compared to girls. LBM has direct bearing on BMC even after adjusting
for age, fat mass and biochemical parameters.
Keywords: Bone mineral content, Bone health, Children, Muscle
mass
|
|
L
ean body mass (LBM) at older age
depends on the peak LBM which is acquired during adolescent and puberty
[1]. LBM during childhood and adolescence depends on genetic factors,
hormonal status, growth, sexual maturation, nutritional status and
ethnicity [1-4]. Ethnic differences occur due to variation in adiposity,
fat-free mass (surrogate for lean mass) and effect of environment [3].
There are gender differences in body composition during puberty [3,4].
During puberty, males gain greater amounts of LBM, whereas females
acquire significantly more fat mass [5]. There are few population-based
cross-sectional [6,7] and longitudinal studies [8-10], which have
assessed LBM in children and adolescents. However, there are no
normative data available for Indian population. This study aimed to
describe percentile charts of LBM among children and adolescents,
evaluate gender differences and its relation with pubertal status, and
assess its effect on bone mineral contents.
Methods
This study was a secondary analysis of data from our
earlier study [11,12]. Adolescents were recruited from different schools
in the city of Delhi as a part of a project to generate normative data
for bone mineral density (BMD). There were 1829 apparently healthy
children and adolescents who underwent health examination (clinical,
biochemical and densitometric) on voluntary basis. For present study,
the data on lean mass and its distribution was available from 1403
children and adolescents (age 5-18 years). Children and adolescents with
clinically overt hepatic, renal, neoplastic, gastrointestinal,
dermatological and endocrine and systemic infective disorders, steroid
intake or alcoholism were excluded. Demographic, anthropometric and
clinical data were ascertained and a detailed physical examination
conducted. The study was approved by the ethics committee of the
Institute of Nuclear Medicine and Allied Sciences and all children gave
written informed consent.
Pubertal staging were assessed in females by breast
development according to diagrams and descriptions based upon the Tanner
criteria [13]. Testicular volume was determined by Prader orchidometer
(Pharmacia and Upjohn, Uppsala, Sweden). Average of left and right
testicular volume was used to determine pubertal stage in males, and
staged as: stage 1 = £3mL,
stage 2 4-8 mL, stage 3 10-15 mL, stage 4 = 20mL, and stage 5 25 mL
[14].
Fasting blood samples were drawn for the estimation
of serum 25-hydroxy vitamin D (25(OH)D), intact parathyroid hormone (iPTH),
total and ionized calcium, inorganic phosphorus, and serum alkaline
phosphatase (SAP). The normal range for different biochemical parameters
were as used before [12].
Lean mass and regional distribution, total fat mass,
and BMD at anteroposterior (AP) lumbar spine (L1–L4), femur (total hip,
femoral neck), forearm (33% radius) and total body was measured using
the Prodigy Oracle (GE Lunar Corp., Madison, WI) according to standard
protocol. Quality control procedures were carried out in accordance with
the manufacturer’s recommendations. Instrument variation was determined
regularly using a phantom supplied by the manufacturer and mean
coefficient of variation was <0.5%. For in vivo measurements,
mean coefficients of variation for all sites were <1%.
Appendicular skeletal muscle mass index (ASMI) was
calculated by lean mass at arms and leg (kg) divided by square of height
(m 2).
Percentile charts were generated for boys and girls separately. Lean
mass index (LMI) and fat mass index (FMI) were calculated by dividing
total LBM and total fat mass with square of height in meters [15]. Other
variables calculated were LBM (kg)/height (m) ratio, total bone mineral
content (BMC) and LBM ratio [10,16].
Statistical analysis was carried out using SPSS
version 20.0 (Chicago, IL, USA). Percentile charts were generated
through the software used in the predefined age group according to
gender. Independent two variables (gender) were tested by Student’s
t-test. One way analysis of variance (ANOVA) was used test differences
between pubertal staging and age groups. Post-hoc analysis was used to
compare the significance level between two groups within each parameter.
Pearson’s correlation coefficient was calculated to assess the strength
of relationship between total lean mass and its distribution and BMC at
various sites. Multiple regression analysis was done to find association
between lean mass and its distribution with BMC at various sites after
adjustment with variables like age, total fat, serum calcium,
phosphates, SAP, 25(OH)D and iPTH levels. The trend line in the graph
between total lean mass and age was plotted using Loess fit method with
Epanechnikov variation.
Results
We included 1403 (826 boys) children and adolescents
with mean (SD) age of 13.2 (2.7) years. Basic characteristics are shown
in Web Table I. Boys were
younger, taller and heavier than girls, but their BMI was lower than
that of girls. Boys had higher serum 25(OH)D, calcium, phosphates and
SAP levels. BMC at all sites except trunk was higher in boys when
compared to girls (Web Table
I).
 |
|
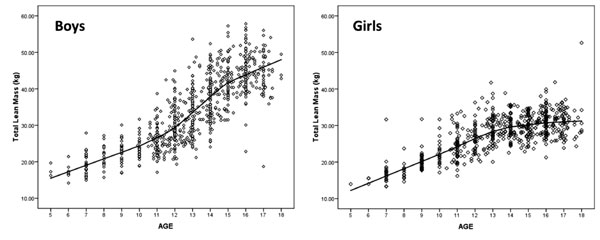
Fig.1 Total lean mass according to age
in boys and girls.
|
Total, trunk, arm, and leg lean mass as well as ASMI
increased with increasing age in both sexes (Tables I and
II). The increase persisted till the age of 18 years in boys but
plateaued at 15 years in girls (Fig. 1). LBM increased
significantly more in boys (130%) compared to girls (83%) (P<0.0001).
TABLE I Percentile Distribution of Lean Mass as Assessed by Dual-energy Absoptiometry in Boys (n=826)
|
Percentile |
5th |
10th |
15th |
25th |
50th |
75th |
85th |
90th |
95th |
|
Age (n) |
Total lean mass (kg) |
|
Total lean mass |
|
5-8 (62) |
15.72 |
15.93 |
16.22 |
17.04 |
18.98 |
21.56 |
22.55 |
23.34 |
24.37 |
|
>8-11 (138) |
19.55 |
20.65 |
21.37 |
22.32 |
24.24 |
27.19 |
28.23 |
29.36 |
30.95 |
|
>11-15 (447) |
23.95 |
25.55 |
26.65 |
29.02 |
34.50 |
39.96 |
42.89 |
45.28 |
47.73 |
|
>15-18 (179) |
37.63 |
38.57 |
39.21 |
40.78 |
44.48 |
48.47 |
50.23 |
51.33 |
53.64 |
|
Appendicular skeletal muscle mass index (kg/m2) |
|
5-8 (62) |
4.52 |
4.74 |
4.86 |
4.96 |
5.41 |
6.09 |
6.40 |
6.51 |
6.74 |
|
>8-11 (138) |
5.36 |
5.62 |
5.79 |
6.09 |
6.64 |
7.08 |
7.42 |
7.66 |
8.11 |
|
>11-15 (447) |
6.14 |
6.56 |
6.79 |
7.33 |
8.47 |
9.60 |
10.34 |
10.69 |
11.19 |
|
>15-18 (179) |
8.77 |
9.03 |
9.30 |
9.67 |
10.37 |
11.44 |
12.02 |
12.29 |
12.67 |
|
Arm lean mass (kg) |
|
5-8 (62) |
1.35 |
1.39 |
1.48 |
1.59 |
1.80 |
2.10 |
2.20 |
2.32 |
2.50 |
|
>8-11 (138) |
1.78 |
1.91 |
2.06 |
2.20 |
2.41 |
2.75 |
2.92 |
3.09 |
3.22 |
|
>11-15 (447) |
2.27 |
2.46 |
2.62 |
3.00 |
3.70 |
4.51 |
4.95 |
5.21 |
5.61 |
|
>15-18 (179) |
3.97 |
4.23 |
4.39 |
4.60 |
5.16 |
5.69 |
6.16 |
6.30 |
6.59 |
|
Leg lean mass (kg) |
|
5-8 (62) |
4.44 |
4.62 |
4.78 |
5.12 |
5.74 |
6.75 |
7.29 |
7.61 |
8.11 |
|
>8-11 (138) |
6.25 |
6.59 |
6.90 |
7.37 |
8.24 |
9.39 |
9.80 |
10.33 |
10.95 |
|
>11-15 (447) |
8.02 |
8.69 |
9.19 |
10.14 |
12.11 |
14.30 |
15.18 |
15.84 |
17.11 |
|
>15-18 (179) |
12.66 |
13.11 |
13.35 |
13.94 |
15.45 |
17.01 |
18.05 |
19.59 |
19.20 |
|
Trunk lean mass (kg) |
|
5-8 (62) |
7.13 |
7.27 |
7.36 |
7.67 |
8.65 |
9.75 |
10.27 |
10.85 |
12.28 |
|
>8-11 (138) |
8.57 |
9.22 |
9.31 |
9.75 |
10.76 |
12.08 |
12.83 |
13.41 |
14.26 |
|
>11-15 (447) |
10.56 |
11.42 |
11.97 |
12.98 |
15.74 |
18.06 |
19.60 |
20.49 |
21.43 |
|
>15-18 (179) |
16.15 |
17.93 |
17.93 |
18.60 |
20.13 |
21.85 |
22.82 |
23.52 |
24.66 |
Boys had significantly more total and regional lean
mass when compared to girls, whereas girls had higher total fat mass
than boys. When LBM was adjusted for height (LBM/Ht ratio), and total
BMC (LBM/BMC ratio), boys still had significantly higher ratio than
girls. A similar pattern was observed at other sites (Web
Table I). Boys had higher arm to leg lean mass ratio
when compared to girls (0.31(0.03) vs 0.29 (0.03), P
<0.0001). Boys had highest percent increase in lean mass at all sites in
the age group of >11-15 years, whereas girls had in the age group of
>8-11 years. A similar pattern was also observed in ASMI. In all age
groups, boys had significantly higher total and regional lean mass when
compared to girls (Tables I and II). Girls had
significantly higher total BMC per gram of LBM when compared with boys
(61 vs
53 g/kg LBM, P<0.0001).
TABLE II Percentile Distribution of Lean Mass as Assessed by Dual-energy Absorptiometry in Girls (N=577)
|
Age (N) |
Percentile total lean mass (kg) |
|
5th |
10th |
15th |
25th |
50th |
75th |
85th |
90th |
95th |
|
Total lean mass (kg) |
|
5-8 (34) |
13.76 |
14.19 |
14.75 |
15.40 |
16.52 |
18.01 |
18.59 |
19.24 |
21.37 |
|
>8-11 (97) |
17.87 |
18.35 |
18.85 |
19.90 |
22.00 |
24.84 |
26.34 |
29.31 |
30.94 |
|
>11-15 (260) |
22.48 |
23.80 |
24.53 |
26.31 |
28.81 |
31.60 |
32.73 |
33.69 |
35.18 |
|
>15-18 (186) |
25.87 |
26.59 |
27.44 |
28.21 |
30.99 |
33.16 |
34.39 |
35.04 |
36.13 |
|
Appendicular Skeletal Muscle mass index (kg/m2) |
|
5-8 (34) |
3.92 |
4.07 |
4.12 |
4.23 |
4.74 |
5.11 |
5.36 |
5.62 |
5.77 |
|
>8-11 (97) |
4.69 |
4.94 |
5.08 |
5.37 |
5.92 |
6.47 |
6.94 |
7.39 |
7.90 |
|
>11-15 (260) |
5.46 |
5.78 |
6.11 |
6.31 |
6.83 |
7.52 |
7.90 |
8.17 |
8.49 |
|
>15-18 (186) |
5.98 |
6.29 |
6.42 |
6.67 |
7.29 |
7.90 |
8.19 |
8.43 |
8.85 |
|
Arm lean mass (kg) |
|
5-8 (34) |
1.10 |
1.18 |
1.25 |
1.30 |
1.45 |
1.68 |
1.82 |
1.86 |
2.11 |
|
>8-11 (97) |
1.49 |
1.63 |
1.71 |
1.84 |
2.06 |
2.44 |
2.63 |
2.96 |
3.17 |
|
>11-15 (260) |
1.95 |
2.19 |
2.32 |
2.50 |
2.85 |
3.13 |
3.31 |
3.44 |
3.63 |
|
>15-18 (186) |
2.37 |
2.48 |
2.59 |
2.72 |
3.04 |
3.40 |
3.59 |
3.69 |
3.83 |
|
Leg lean mass (kg) |
|
5-8 (34) |
3.48 |
3.70 |
4.02 |
4.35 |
4.83 |
5.71 |
5.87 |
6.21 |
6.88 |
|
>8-11 (97) |
5.38 |
5.74 |
6.02 |
6.62 |
7.39 |
8.29 |
9.23 |
10.12 |
10.88 |
|
>11-15 (260) |
7.41 |
7.82 |
8.11 |
9.74 |
9.69 |
10.76 |
11.38 |
11.64 |
12.50 |
|
>15-18 (186) |
8.22 |
8.81 |
9.04 |
9.45 |
10.46 |
11.54 |
12.01 |
12.37 |
12.72 |
|
Trunk lean mass (kg) |
|
5-8 (34) |
6.61 |
6.71 |
6.86 |
7.11 |
7.79 |
8.44 |
8.82 |
9.41 |
11.14 |
|
>8-11 (97) |
8.16 |
8.42 |
8.62 |
9.09 |
9.90 |
11.47 |
12.27 |
13.25 |
14.02 |
|
>11-15 (260) |
10.04 |
10.64 |
11.36 |
12.12 |
13.42 |
14.86 |
15.38 |
15.70 |
16.46 |
|
>15-18 (186) |
11.95 |
12.31 |
12.91 |
13.37 |
14.53 |
15.57 |
16.11 |
16.31 |
16.94 |
Total and regional lean mass were more at higher
stages of puberty. Total lean mass in individuals in stage 5 of puberty
was 100% and 73% higher than those in stage 2 for boys and girls,
respectively. A similar pattern was observed at other regional sites (Table
III). Total and trunk lean mass showed highest percent increase in
the pubertal stage 3 in both sexes. However, there were regional
differences between sexes, with the largest percentage increase in arm
and leg lean mass, and ASMI being seen in pubertal stage-2 in girls as
compared with stage 3 in boys (Table III).
TABLE III Lean Mass According to Pubertal Staging
|
Pubertal Staging* |
|
1 |
2 |
3 |
4 |
5 |
|
|
(B=103; G=39) |
(B=194; G=49) |
(B=183; G=80) |
(B=148; G=117) |
(B=198; G=292) |
|
Total Lean Mass (kg) |
|
Boys |
22.16 (4.21) |
27.04 (4.72) |
34.71 (6.39) |
39.71 (6.49) |
44.24 (5.59) |
|
% Increase# |
|
22.0 |
28.4 |
14.4 |
11.4 |
|
Girls |
17.61 (3.34) |
20.96 (3.02) |
25.51 (3.85) |
28.58 (4.12) |
30.38 (3.65) |
|
% Increase# |
|
19.0 |
21.7 |
12.0 |
6.3 |
|
Arm Lean Mass (kg) |
|
Boys |
2.15 (0.50) |
2.73 (0.62) |
3.74 (0.86) |
4.47 (1.03) |
5.13 (0.87) |
|
% Increase# |
|
26.9 |
37.0 |
19.5 |
14.8 |
|
Girls |
1.57 (0.48) |
2.00 (0.40) |
2.44 (0.49) |
2.78 (0.53) |
3.00 (0.48) |
|
% Increase# |
|
27.4 |
22.0 |
13.9 |
7.9 |
|
Leg Lean Mass (kg) |
|
Boys |
7.20 (1.76) |
9.26 (1.84) |
12.21 (2.46) |
13.90 (2.39) |
15.49 (2.25) |
|
% Increase# |
|
28.6 |
31.9 |
13.8 |
11.4 |
|
Girls |
5.36 (1.46) |
6.85 (1.21) |
8.72 (1.59) |
9.77 (1.61) |
10.27 (1.49) |
|
% Increase# |
|
27.8 |
27.3 |
12.0 |
5.1 |
|
Trunk Lean Mass (kg) |
|
Boys |
10.03 (1.98) |
12.09 (2.40) |
15.50 (3.23) |
17.98 (3.19) |
20.01 (2.68) |
|
% Increase# |
|
20.5 |
26.6 |
15.4 |
11.3 |
|
Girls |
8.26 (1.59) |
9.52 (1.40) |
11.64 (1.88) |
13.26 (2.01) |
14.25 (1.96) |
|
% Increase# |
|
15.3 |
22.3 |
13.9 |
7.4 |
|
ASMI (kg/m2) |
|
Boys |
6.07 (0.93) |
7.00 (1.04) |
8.59 (1.34) |
9.50 (1.47) |
10.46 (1.39) |
|
% Increase# |
|
15.3 |
22.7 |
10.6 |
10.1 |
|
Girls |
4.95 (0.80) |
5.66 (0.76) |
6.46 (0.91) |
6.91 (0.99) |
7.19 (0.89) |
|
% Increase# |
|
14.3 |
14.1 |
7.0 |
4.1 |
|
B=boys, G=girls; *P value trends <0.001 for all; #percentage
increase of mean lean mass between successive pubertal stage. |
Total and regional lean mass and ASMI was positively
correlated with age, BMI, serum 25(OH)D, total fat mass, BMC in total
study population and both sexes independently. These parameters were
negatively correlated with iPTH, phosphorus and SAP. Total, trunk and
leg lean mass showed strongest correlation with leg BMC, followed by
arm, total and trunk BMC, whereas arm lean mass and ASMI showed
strongest correlation with arm BMC compared to other sites. In multiple
regression analysis, after adjusting for age, total fat mass, serum
calcium, phosphates, alkaline phosphatase, 25OHD and PTH, total and
regional lean mass at all sites showed positive correlation with BMC at
all sites among study population and gender separately. The total lean
mass showed strongest relation with leg BMC followed by arm, total and
trunk BMC. Trunk BMC had the lowest correlation with total and regional
lean mass in total population and both sexes. Leg and arm lean mass had
highest correlation with their respective regional BMC (data not shown).
Discussion
In this study, we generated the percentile charts for
total and regional lean mass and ASMI in Indian urban children and
adolescents according to gender. While the total and regional lean mass
increased with age in both sexes, boys continued to acquire lean mass
beyond the age of 18 years, whereas the increase plateaued after the age
of 15 years in girls. Boys had significantly more lean mass when
compared to girls across all ages (5-18 years), but girls had
significantly higher BMC per unit LBM in comparison to boys. In the
present study, lean mass was higher at higher stages of puberty, with
the difference being more marked in boys than girls. There was strong
correlation between lean mass and BMC in both sexes, with the weakest
relationship being observed between total lean mass and spinal BMC.
Since this was a cross-sectional study, we
could not assess the change in lean mass over time in individual
subjects during pubertal development as described by others [9,11]. The
study was able to capture the end of the growth period in females.
However, since growth in males, continues beyond the studied age, there
can be further increase in LBM in males, which the present study was
unable to capture [16]. Growth of lean mass and BMC also depends on
genetic factors, in addition to local and systemic factors such as
exercise and diet, which were not assessed in this study. In this large
cross-sectional study, percentile charts were generated according to age
groups and gender. While the sample size for each category is small, it
may form basis for comparison with larger studies in future.
Though, similar reference data are available for US
population studied in the National Health and Nutrition Examination
Survey (NHANES) [17] and Polish children and adolescents [7]. There are
differences in height and BMI of children and adolescents of Indian, US
and Polish origin; hence, comparison between these data sets is not
feasible due to lack of data for adjustment for height and BMI. Increase
in total and regional lean mass with age has been observed in children
and adolescents in several other studies [4,5,10,18]. Maximum increase
in lean mass occurred earlier in girls (8-11 years) than boys (11-15
years) in this study. A longitudinal study has also shown that girls
accrue lean mass predominantly in the age group 10-12 years when
compared to boys (12-14 years) [10]. Gender difference in LBM, similar
to our study, have also been seen in studies from UK and New Zealand
[7,10]. However, in a study by Boots, et al. [3], the difference
between sexes emerged only after the age of 14 years. Ferretti, et al.
[16] reported a constant relationship between BMC and LBM across all
ages, with a value of 50-54 g per unit of LBM, which is similar to that
reported in the present study. This ratio reverses in adults [19],
thereby suggesting that girls accumulate more BMC during puberty as
compared to boys. However, boys continue to accumulate bone mineral
content with age and surpass girls with reversal of ratio in adulthood.
Increase in LBM occurs significantly more with pubertal maturation in
boys compared with girls. However, the increase in lean mass with
puberty was significantly higher in Dutch boys and girls compared to
their Indian counterparts in the present study (146% vs 100% and
100% vs 73%, respectively). In contrast, girls from New Zealand
showed similar increase with puberty compared to the girls in the
present study (86% vs 83%). The variation in lean mass during
pubertal maturation could be explained based on genetic, nutritional and
lifestyle factors.
Muscles are integral part of lean mass. Low LBM may
be forerunner of sarcopenia in future, which has bearing on morbidity
and mortality in elderly age group [1,2]. This study provides reference
data for LBM in Indian children and adolescents. Total and regional LBM
increases with age and pubertal progression. Boys have more LBM than
girls, but girls have more BMC per unit of LBM. LBM is strongly
correlated with BMC in both sexes. Further longitudinal studies are
required to assess the LBM as well as other body composition in Indian
children and adolescents.
Contributors: RKM, AM, NT: conceptualized
the study; KB: supervised and collected the data; MKG, NM: prepared the
manuscript.
Funding: Institute of Nuclear Medicine and
Allied Sciences, DRDO. Competing interest: None stated.
|
What This
Study Adds?
• Reference percentile charts of total and
regional lean body mass among Indian urban adolescents are
generated.
• There is increase in total and regional lean body mass with
age and pubertal progression in Indian adolescents in both
genders.
|
References
1. Von Haehling S, Morley JE, Anker SD. An overview
of sarcopenia: facts and numbers on prevalence and clinical impact. J
Cachexia Sarcopenia Muscle. 2010;1:129-33.
2. Mithal A, Bonjour JP, Boonen S for IOF CSA
Nutrition Working Group. Impact of nutrition on muscle mass, strength,
and performance in older adults. Osteoporos Int. 2013;24:1555-66.
3. Boot AM, Bouquet J, de Ridder MA, Krenning EP, de
Muinck Keizer-Schrama SM. Determinants of body composition measured by
dual-energy X-ray absorptiometry in Dutch children and
adolescents. Am J Clin Nutr. 1997;66:232-8.
4. Wells JC. Sexual dimorphism of body composition.
Best Pract Res Clin Endocrinol Metab. 2007;21:415-30.
5. Courteix D, Lespessailles E, Loiseau-Peres S,
Obert P, Ferry B, Benhamou CL. Lean tissue mass is a better predictor of
bone mineral content and density than body weight in prepubertal girls.
Rev Rhum Engl Ed. 1998;65:328-36.
6. Weber DR, Moore RH, Leonard MB, Zemel BS. Fat and
lean BMI reference curves in children and adolescents and their utility
in identifying excess adiposity compared with BMI and percentage body
fat. Am J Clin Nutr. 2013;98: 49-56.
7. P³udowski P, Matusik H, Olszaniecka M, Lebiedowski
M, Lorenc RS. Reference values for the indicators of skeletal and
muscular status of healthy Polish children. J Clin Densitom.
2005;8:164-77.
8. Zhu K, Greenfield H, Zhang Q, Du X, Ma G, Foo LH,
et al. Growth and bone mineral accretion during puberty in
Chinese girls: a five-year longitudinal study. J Bone Miner Res.
2008;23:167-72.
9. Xu L, Nicholson P, Wang Q, Alén M, Cheng S. Bone
and muscle development during puberty in girls: a seven-year
longitudinal study. J Bone Miner Res. 2009;24:1693-8.
10. Wey HE, Binkley TL, Beare TM, Wey CL, Specker BL.
Cross-sectional versus longitudinal associations of lean and fat mass
with pQCT bone outcomes in children. J Clin Endocrinol Metab.
2011;96:106-14.
11. Shivaprasad C, Marwaha RK, Tandon N, Kanwar R,
Mani K, Narang A, et al. Correlation between bone mineral density
measured by peripheral and central dual energy X-ray
absorptiometry in healthy Indian children and adolescents aged 10-18
years. J Pediatr Endocrinol Metab. 2013;26:695-702.
12. Marwaha RK, Tandon N, Reddy DR, Aggarwal R, Singh
R, Sawhney RC, et al. Vitamin D and bone mineral density status
of healthy schoolchildren in northern India. Am J Clin Nutr.
2005;82:477-82.
13. Tanner JM. Growth at Adolescence: With a General
Consideration of the Effects of Hereditary and Environmental Factors
Upon Growth and Maturation From Birth to Maturity. Blackwell Scientific
Publications, Oxford, 1969.
14. Wardhaugh B. Pubertal Staging. Available From:
http://www.patient.co.uk/doctor/Puberty-Normal-and-Abnormal.htm.
Accessed December 01, 2015.
15. Marwaha RK, Garg MK, Tandon N, Mehan N, Sastry A,
Bhadra K. Relationship of body fat and its distribution with bone
mineral density in Indian population. J Clin Densitom. 2013;16:353-9.
16. Ferretti JL, Capozza RF, Cointry GR, García SL,
Plotkin H, Alvarez Filgueira ML, et al. Gender-related
differences in the relationship between densitometric values of
whole-body bone mineral content and lean body mass in humans between 2
and 87 years of age. Bone. 1998;22:683-90.
17. Borrud LG, Flegal KM, Looker AC, Everhart JE,
Harris TB, Shepherd JA. Body composition data for individuals 8 years of
age and older: U.S. population, 1999-2004. Vital Health Stat.
2010;250:1-87
18. Mølgaard C, Michaelsen KF. Changes in body
composition during growth in healthy school-age children. Appl Radiat
Isot. 1998;49:577-9.
19. Wang Z, Heo M, Lee RC, Kotler DP, Withers RT,
Heymsfield SB. Muscularity in adult humans: proportion of adipose tissue
free body mass and skeletal muscle. Am J Hum Biol. 2001;13:612-19.
|
|
|
 |
|
