|
India was one of the first
countries to adopt the
World Health Organization’s Expanded Programme
of Immunization (EPI). The program started
globally in 1974 and was initiated in India in 1978. Since its
inception, considerable progress has been made in terms of reduction in
disease burden. Despite these achievements and tremendous advances in
economic and technological spheres in recent years, the burden of
vaccine-preventable diseases remains unacceptably high, in comparison to
developed countries and also many developing countries [1]. One of the
obvious reasons for this could be that the level of coverage with
individual vaccines does not meet the target of sustained high coverage
required to control/eradicate disease. However vaccination coverage data
released by official sources such as the Ministry of Health and Family
Welfare [2] and Indian Council of Medical Research [3], consistently
suggested acceptably high levels of vaccine coverage in India. In
contrast, independent sources such as joint WHO-UNICEF (United Nations
Children’s Fund) report revealed 20-30% differences from the official
data for each vaccine in the national program. More recently, the
National Family Health Survey (NFHS) series [4-6] have shown that the
true vaccination coverage (estimated by robust methodological
procedures) is actually even lower than formerly believed. Over and
above this, the tendency to present vaccination performance in terms of
average coverage rates raises yet another problem viz. the issue
of equity. Averages often mask the wide disparity between extremes; in
the case of childhood vaccination in India, this is especially true as
the range for all observations is extremely high. As an example, the
latest NFHS report [6] gives the national average for complete
vaccination as 43.5%; however this masks the fact that performance in
states like Tamil Nadu with 81% coverage is vastly different from states
like Nagaland with 21% coverage.
Pande and Yazbeck [7] demonstrated the importance of
looking beyond national average figures for childhood vaccination to
uncover disparities masked by the average. They described significant
heterogeneity between states and highlighted the north-south imbalance.
They used the term ‘total system failure’, to describe uniformly low
vaccination coverage across all population segments in some states. They
recognized that some states could have high overall vaccination
performance but significant inequities; in contrast there could be
states with low performance but greater equity.
Gaudin and Yazbeck [8] also reiterated that average
values do not reflect the true picture or provide information for
action; they were concerned about the relationship between "efficiency"
and "equity". The former term is a euphemism for performance, in other
words the overall vaccination coverage; whereas the latter describes the
distribution of vaccination across different groups. Their analysis of
NFHS-2 data [5] revealed areas that had more equitable distribution of
vaccination coverage, but very low overall coverage (high equity but low
efficiency). Enhancing efficiency (coverage) in such areas might
increase inequities. They therefore advocated using Wagstaff’s extended
achievement index (comprising inequality-adjusted immunization scores)
rather than vaccination coverage alone, to allow examination of both
efficiency and equity.
Equity in immunization should not be restricted to
merely creating equal opportunities for immunization of children within
the country (in a sense this already exists as vaccination is provided
free-of-cost to all infants all over the country through a vast network
of public sector institutions). It is also concerned with identifying
the groups at highest risk of remaining unvaccinated and bridging
gaps/imbalances as far as possible. In this regard, the NFHS surveys
[4-6] have provided a vast body of data on the immunization status of
infants grouped by various individual, family, and social
characteristics. The need of the hour is to systematically examine all
sources of data reflecting inequities in vaccination. Such an exercise
would be beneficial in identifying the groups of infants at highest risk
of remaining unvaccinated; and also the characteristics of infants with
high as well as low vaccination coverage status. However no such
document is currently available.
This systematic review of literature was undertaken
to identify inequity in childhood routine immunization in India; and to
explore the reasons for the same.
Methods
Study design: This was a descriptive systematic
review of literature pertaining to childhood vaccination with specific
emphasis on examining and exploring the issues of equity and inequity in
childhood immunization. No secondary data analysis (meta-analysis or
other statistical tests) was undertaken. The design corresponded to
previously used Methodology for this kind of research question [9].
Inclusion criteria
Types of publications: This was a broad-based
review and included all types of publications (available in the public
domain) reporting childhood vaccination in India by direct data
collection through surveys, interviews, research trials, etc or
secondary analysis of published data obtained through one or more of
these methods. Publications representing estimations, data
extrapolations, or employing other indirect methods to calculate
childhood vaccination such as consumption of vaccine doses,
administrative databases, financial logs, etc were not included. No
restriction was applied in terms of type of study, methodology employed,
type of data analysis, or peer-review of publications. Where multiple
sets of data were available through serial updates, the most current
publication was included.
Types of participants: Publications were included
if they contained data on childhood vaccination. The definition of
child/childhood was age group less than five years.
Vaccination/immunization pertained to vaccines in the National
Immunization Schedule, viz. BCG at birth, three doses of DPT and
OPV at 6, 10 and 14 weeks; one dose of measles vaccine at 9 months of
age; and booster doses at 18 months and 5 years. The National
Immunization Schedule also includes a booster dose of tetanus toxoid
(TT) at 10 years of age and 2 doses tetanus toxoid vaccination of
pregnant women. However publications describing these were not included
as they do not directly pertain to the focus of this review. Similarly,
publications on vaccines that are currently not in the National Schedule
(such as hepatitis B, MMR, and newer vaccines) were not included.
Types of outcome measures: The primary outcome
measure was ‘complete vaccination/immunization’ defined as per the 1998
World Health Organization (WHO) guideline viz. receipt of one
dose of BCG vaccine, three doses of DPT and OPV vaccines, and one dose
of measles vaccine by infants in the age group 12-23 completed months.
Secondary outcome measures were (i) ‘no vaccination/immunization’
defined as failure of an infant 12-23 months old to receive even a
single dose of the vaccines listed above, and (ii)
‘partial/incomplete vaccination/immunization’ defined as receipt of
vaccine doses between ‘no vaccination’ and ‘complete vaccination’.
Search methods for identification of studies: The
following databases were searched: Medline through Pubmed
(www.pubmed.com) on 27 November 2011 and updated during 6-12 December
2011. Websites of the World Health Organization, United Nations
Children’s Fund (UNICEF), Demographic and Health Survey (DHS) series,
and Ministry of Health and Family Welfare, were searched between 12 and
27 December 2011. In addition, reference lists of included publications
were searched to discover additional data. No attempt was made to obtain
unpublished data, or data unavailable in the public domain, or data
available within specific institutions at the national, state or local
level. Publications were selected for potential inclusion by screening
titles (first step), screening abstracts of relevant titles (second
step) and studying the full text of relevant abstracts (third step). At
this stage, decision to include or exclude a publication was made.
Search strategy: A Pubmed MeSH search for the
term "equity" returned two categories viz. "Tax Equity and Fiscal
Responsibility Act" (1985), and "The remuneration paid or benefits
granted to an employee" (1978). As neither of these terms was relevant
to this systematic review, additional MeSH search for the term
"Disparity" was undertaken; this returned three categories viz..
"Vision Disparity" (1989), "Healthcare Disparities" (2008) and "Health
Status Disparities" (2008). The last term "Health Status Disparities"
was relevant and hence explored further, yielding 13 subheadings;
amongst these, the following were considered relevant: "statistics and
numerical data, trends, utilization". Therefore the following search
string was used to include citations related to disparity:
"(("Healthcare Disparities/statistics and numerical data"[Mesh]) OR
"Healthcare Disparities/trends"[Mesh]) OR "Healthcare
Disparities/utilization"[Mesh]". This was combined with terms for
immunization/vaccination and India; using the search string: "(immuniz*
OR vaccin*) AND India*". An additional search for the specific terms
‘equity’ and ‘inequity’, combined with vaccination/immunization in India
was undertaken using the string "(vaccin* OR immuniz*) AND India* AND (equit*
OR inequit*)". Following this, a series of searches was undertaken using
specific terms for gender, wealth/poverty, area of residence, social and
socio-economic factors. The detailed search strings for these searches
are listed in Table I.
Table 1	Outline of the Terms, Strings, Strategy and Output for Search and Step-wise

Decision to Include/exclude publication
|
Search for: |
Search string |
Search strategy |
Titles |
Abstracts
|
Full-text |
Included |
Disparity in vaccination
|
“((immuniz* OR vaccin*) AND India*) AND
(“Healthcare Disparities/statistics and numerical data”[Mesh] OR
“Healthcare Disparities/trends” [Mesh]) OR “Healthcare
Disparities/utilization” [Mesh] |
Web Appendix 1
|
25 |
1 |
1 |
1 |
|
Equity/inequity in vaccination |
(vaccin* OR immuniz*) AND India* AND (equit*
OR inequit*)] |
Web Appendix 2
|
22 |
6 |
6 |
6 |
|
Gender |
(immuniz* OR vaccin*) AND India* AND
gender |
Web Appendix 3 |
47 |
27 |
14 |
9 |
|
Area of residence |
(vaccin* OR immuniz*) AND India* AND
(rural OR urban OR slum) |
Web Appendix 4 |
615 |
76 |
29 |
14 |
|
Wealth OR poverty |
(immuniz* OR vaccin*) AND India* AND
(Wealth OR poverty) |
Web Appendix 5 |
150 |
41 |
18 |
7 |
|
Social factors |
(immuniz* OR vaccin*) AND India* AND
(social OR socio*) |
Web Appendix 6 |
496 |
71 |
31 |
8 |
|
Education or literacy |
(immuniz* OR vaccin*) AND India* AND
(education* or literacy) |
Web Appendix 7 |
582 |
96 |
38 |
9 |
|
Incentives |
(immuniz* OR vaccine*) AND incentive AND
India* |
Web Appendix 8 |
42 |
3 |
0 |
0 |
Results
The output of the multiple Medline searches, and the
step-wise screening for inclusion of publications, is summarized in
Table I. Website searches yielded the three NFHS reports
[4-6] and four additional reports from different Departments of the
Ministry of Health and Family Welfare [10-13]. Searching of multiple WHO
[14,15] and UNICEF [16-19] websites did not yield any additional
publications that could be included. Searching reference lists of
included publications yielded one additional publication.
There were a limited number of publications reporting
nation-wide data; these were the three Demographic Health Surveys [4-6],
a survey conducted by the Indian Council of Medical Research (ICMR) [3]
at the invitation of the Ministry of Health and Family Welfare in 1999;
and three reports from the Ministry of Health and Family Welfare
[10-12]. Recently the Ministry of Health and Family Welfare and UNICEF,
jointly published the results of a Coverage Evaluation Survey undertaken
during November 2009 to January 2010 [13]; this represents the most
current nationwide data available. This survey evaluated the vaccination
status of 12-23 month old infants drawn from rural (n=12635) and
urban (n=9969) areas. The methodology used was fairly similar to
the NFHS surveys.
Some common trends were noted in the NFHS-3 report
[6] and other documents. The coverage for individual vaccines was much
higher than the proportion of "fully vaccinated" infants; suggesting
significant decline in coverage for each subsequent dose of DPT /OPV and
between the third dose of DPT/OPV and measles vaccine; suggesting that
coverage rates declined as infants grew older. Another interesting
observation is that although DPT and OPV doses are administered at the
same age (and therefore ideally at the same vaccination session), there
was a consistent difference between the coverage for the two vaccines.
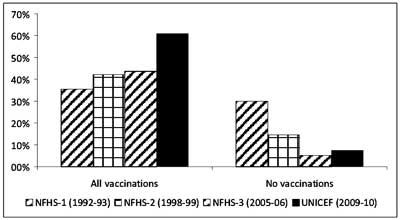
Another important observation from the three NFHS
series [4-6] is the trend over time. In the NFHS-1 survey (1992-93), a
total of 35.4% infants were fully vaccinated and about 30.0% had not
received any vaccination. The second survey (NFHS-2, 1998-99) reported
that 42.0% infants were fully vaccinated and 14.4% had not received any
vaccination. NFHS-3 reported 43.5% full vaccination and 5.1% infants
with no vaccination. These data show that although there was no
significant recent progress in complete vaccination of infants, many
infants are partially immunized. When the data from the UNICEF 2009-10
survey [13] are considered, there appears to be dramatic progress in
vaccination coverage; the complete vaccination rate was 61.0%.
Figure 1 summarizes the data. Further consideration of
time-trends and overall vaccination are outside the scope of this
review. The following sections discusses major factors responsible for
inequities in childhood vaccination.
 |
|
Fig 1 Vaccination trend over time (Data
from the three NFHS series and latest UNICEF coverage evaluation
survey ).
|
State-level differences
NFHS-3 data [6] showed that nine states had full
vaccination rate lower than the national average; these include Madhya
Pradesh, Jharkhand, Meghalaya, Bihar, Assam, Arunachal Pradesh,
Rajasthan, Uttar Pradesh and Nagaland. The below-average coverage states
include highly populous states such as Uttar Pradesh.
A group of Indian researchers [62] analyzed NFHS-3
data further to calculate state-wise disparities by gender and area of
residence, for 4 indicators of child health viz. complete
vaccination, prevalence of underweight children, prevalence of diarrhea
and under-five child mortality. To evaluate the effect of wealth, the
authors plotted the concentration curve (CC) and calculated the
concentration index (CI). The former plots the cumulative population
shares of a particular characteristic against the cumulative outcome
(wealth quintiles from lowest to highest) on the x-axis and
cumulative complete vaccination on the y-axis. If the resulting
curve is not a straight line, it indicates inequity in the health-care
outcome (here complete vaccination). The concentration index is
calculated as twice the area between the diagonal (representing zero
inequity) and the actual curve plotted. The larger the value of the CI,
the greater the degree of inequality. They reported that states with the
highest concentration index (indicating greatest wealth-based
inequities) were Bihar, Assam, Madhya Pradesh, Rajasthan, Jharkhand and
Uttar Pradesh. Only 8 of 18 states had a coverage rate greater than 50%.
The authors also plotted concentration indices for other health-care
measurements including under-five mortality, prevalence of underweight
and prevalence of diarrhea; the results indicated the same finding.
Analysis by area of residence showed that rural
children were the least likely to have complete vaccination. This
inequity was high in states like Madhya Pradesh, Rajasthan,
Chhattisgarh, Jharkhand and Uttar Pradesh. Interestingly, the highest
inequity between rural and urban areas existed in Kerala, followed by
Chhattisgarh and Haryana. A similar analysis by gender was also
undertaken, which suggested the worst imbalance existed in Bihar and
Punjab, followed by Madhya Pradesh and Uttar Pradesh.
The ICMR survey [3] conduced across 90 districts in
India during 1999 reported 13 states with complete vaccination coverage
higher than the national average of 63.3%. Only BIMARU (Bihar, Madhya
Pradesh, Rajasthan and Uttar Pradesh) and north-east states had coverage
lower than the national average. For some reason, the north-east states
were not named individually; likewise a group loosely labelled "Union
territories and others" were reported to have 82% complete vaccination
coverage. These data showed inexplicably higher vaccination coverage
than the NFHS-2 data for the same time period.
Another nation-wide survey conducted by the Health
Ministry among 4320 infants (distributed equally among rural and urban
areas) [11] reported that 56.6% infants were fully vaccinated, compared
to 50% the preceding year. Nearly one-fifth infants had not received any
vaccination. Among the 18 surveyed states reported, over 85% complete
vaccination was noted in only three states viz. Tamil Nadu
(91.5%), Kerala (91.3%) and Maharashtra (84.7%). Six states (West
Bengal, Punjab, Madhya Pradesh, Karnataka, Delhi and Andhra Pradesh)
reported 70-85% complete vaccination. However, complete vaccination by
the age of 12 months was over 80% only in Kerala and Maharashtra. The
states with lowest vaccination coverage included Bihar (12.8% complete
and 58.0% unvaccinated), Rajasthan (19.7% complete and 38.2%
unvaccinated), Uttar Pradesh (26.7% complete and 45.4% unvaccinated),
and Jharkhand (25.7% complete and 39.3% unvaccinated). It must be noted
that no data on north-east states were presented.
The 2009-10 UNICEF survey [13] reported that 16 of 29
states had complete vaccination rate higher than the national average of
61.0%; the Union Territories combined together had 71.3% complete
vaccination. Four states had greater than 80% complete vaccination;
these were Goa (87.9%), Sikkim (85.3%) Punjab (83.6%), and Kerala
(81.5%). The lowest rate was noted in Arunachal Pradesh (24.8%) and
Nagaland (27.8%). Barring these two states, all the other states had
full vaccination rates above 40%. Even the traditionally poor-performing
states showed dramatically improved performance; complete vaccination
rates in Bihar (49.0%), Madhya Pradesh (42.9%), Rajasthan (53.8%) and
Uttar Pradesh (40.9%) were much higher compared to previous surveys a
few years prior [11,12].
In a document titled, ‘National Health profile 2005’
[10], the Central Bureau of Health Intelligence (CBHI), Directorate of
Health Services of the Ministry of Health and Family Welfare, published
data on vaccination coverage during the period 1998-99. The document
reported complete vaccination among 42.0% and no vaccination in 14.4%
infants. Although the methodology of obtaining vaccination data was not
clearly described, state-wise coverage for the same period was reported.
The disparity in complete vaccination ranged from 11.0% in Bihar to
83.4% in Himachal Pradesh. No clear regional pattern could be discerned
from the data. For example, among the north-east states, Assam (complete
vaccination 17.0% and no vaccination 33.2%), Nagaland (complete
vaccination 14.10% and no vaccination 32.7%), and Meghalaya (complete
vaccination 14.3% and no vaccination 42.3%) appear to be very different
from Mizoram (complete vaccination 59.6% and no vaccination 10.5%) or
Arunachal Pradesh (complete vaccination 20.5% and no vaccination 28.7%).
The best state performance was reported from Goa (complete vaccination
82.6% and no vaccination 0.0%) and Himachal Pradesh (complete
vaccination 83.4% and no vaccination 2.8%). Maharashtra and Kerala had
very low rates of non-vaccination (2.0% and 2.2% respectively); although
complete vaccination rate was short of 80% in both states. No coverage
data were reported for 6 Union Territories.
A survey independent of the NFHS [20] compared the
vaccination status of infants (12-32 months) in four BIMARU states of
north India (Bihar, Madhya Pradesh, Rajasthan and Uttar Pradesh) with
the status in India as a whole. A cluster-survey was undertaken in 30
districts comprising 900 villages (6300 children). Complete vaccination
rate was only 48% compared to 63% for India; and these 4 states
accounted for 70% of India’s unvaccinated children although they have
only 40% of the total population. As in other studies, vaccination rates
were lower among infants with illiterate mothers and residing in rural
areas. The proportion of completely unvaccinated infants was highest in
Bihar (28%). The overall proportion of unvaccinated children in the four
states (22%) was twice the national average. The imbalances between boys
vs girls, rural vs urban, scheduled caste/tribe vs
others, and illiterate vs literate parents; for complete
vaccination coverage as well as unvaccinated infants was similar in the
BIMARU states as all over India.
De also re-examined NFHS-2 data to determine the
factors affecting childhood vaccination in Madhya Pradesh, Bihar, Uttar
Pradesh and Rajasthan [21] where the demographic, health and social
indicators (infant mortality rate, total fertility rate, female
literacy, women employment, maternal prenatal care, and institutional
deliveries) are worse than the national average. He evaluated
vaccination coverage in terms of receipt of three doses of DPT and OPV.
Complete vaccination of infants (rural and urban) in these states was
worse than the national average. The inequities in these four states
were similar to those for the national situation; however in Madhya
Pradesh, there was somewhat better vaccination coverage among Muslims
than other social groups.
A group of international researchers [22] tried to
identify the factors influencing the disparity in childhood vaccination
in two Indian states viz.. Maharashtra and Bihar. These were
selected as they were similar in population size, but diverse in terms
of development, economic status, health indicators (such as infant
mortality and life expectancy), and administrative systems. The
investigators evaluated the vaccination status of over 3000 children in
the age group 1-3 years old. They reported that almost two-thirds of
children in Maharashtra were fully vaccinated; whereas this only about
10% in Bihar. The authors attributed these differences to more educated
parents in Maharashtra, higher use of prenatal services, better media
exposure and higher standard of living. Interestingly, this study showed
that the probability of complete vaccination was higher for children in
rural areas of Maharashtra than urban areas, and attributed this to
better rural health care services in the state.
Mohanty, et al. [23] compared childhood
vaccination by household economic status in Uttar Pradesh with
Maharashtra. Using NFHS data, they observed wide variation in complete
vaccination between Maharashtra and Uttar Pradesh. However, the rich to
poor gap estimated by calculation of the concentration index increased
over time in both states suggesting that even in better-performing
states such as Maharashtra, there was significant inequity based on
economic status.
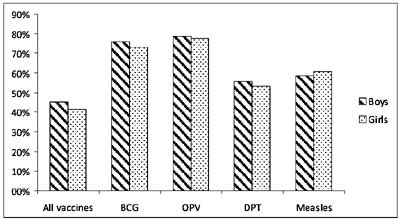
Effect of Gender
There was a higher proportion of boys (53%) than
girls surveyed in NFHS-3 [6]. The complete vaccination rate was 45.3%
for boys and 41.5% for girls. This gender imbalance existed irrespective
of the method of determination of vaccination status; among those whose
vaccination card was examined, 38.8% boys and 36.1% girls were fully
vaccinated. There were 4.3% boys compared to 6.0% girls who had not
received any vaccination. The gap between the genders was about 5% for
most of the individual vaccines including BCG, DPT (all three doses) and
measles; however the gap between boys and girls was considerably less
for the three doses of OPV (about 2%). Fig. 2 depicts a
summary of the NFHS-3 data for different vaccines.
 |
|
Fig 2 Gender-based inequity in
childhood vaccination (data from NFHS-3 survey).
|
A group of researchers evaluated gender differences
by examining data from the three NFHS surveys as well as other studies
[24]. They pooled the data and calculated a relative probability of
vaccination among girls of 0.93 (95% CI 0.90-0.98), suggesting a 7%
lower likelihood. Analysis of the serial NFHS survey data suggested that
the overall gender inequity did not increase over time. Six states with
vaccination coverage higher than the national average, were among the 8
states with the lowest proportion of vaccinated girls. While the overall
girl to boy vaccination coverage ratio was 0.95 for India as a whole; it
varied from 0.86-0.90 in Punjab, Haryana and Bihar. In Uttar Pradesh and
Delhi, the ratio was 0.92 and 0.93 respectively. Among the northern
states, Himachal Pradesh and Rajasthan had the most favorable girl to
boy ratio. In the south, the best gender ratio was observed in Tamil
Nadu and Kerala. In the North-east, Jharkhand and Assam had the most
favourable coverage for girls; although the total coverage was very low.
The 2009-10 UNICEF survey [13] reported complete
vaccination in 61.9% boys and 59.9% girls; the unvaccinated infants were
7.9% and 7.2% respectively. The UNICEF (2005) survey across 22 states
(including combined data for 7 north-east states) reported complete
vaccination among 53.9% female infants compared to 55.1% males [12];
however no tests for statistical significance were performed. The
Ministry of Health and Family Welfare coverage evaluation survey during
2001-02 [11] reported fully vaccinated boys and girls as 58.0% and 55.1%
respectively; however no statistical analysis was undertaken. The ICMR
survey (1999) [3] reported 64.2% and 62.2% complete vaccination among
boys and girls respectively; and no vaccination among 9.1% and 10.3%
boys and girls respectively.
Vaccination data of 1279 infants in the age range 1-3
years in West Bengal state was examined from the District Level
Household Survey under the Reproductive and Child Health project
(2002-2004) [25]. It showed 54% complete vaccination rate. Although
there was wide variation in vaccination rates across 18 districts (range
23.3% to 72.2%); full vaccination was 53.0% among boys and 54.7% among
girls; odds ratio 1.061 (95% CI not given).
A research study undertaken in 3 of 6 districts in
Assam state in 2003 [26] evaluated vaccination status of infants based
on examination of vaccination cards and maternal recall. Standard
30-cluster sampling method was used to collect data for 616 infants
between 1-2 years of age. Complete vaccination was higher among male
infants (64.6%) compared to females (59.3%). An econometric analysis of
vaccination data obtained from a sample of over 4333 rural children
between 1-2 years old reported 50% fully vaccinated girls compared to
55% fully vaccinated boys [27]. A survey evaluating measles incidence
and vaccination coverage in urban slums in Ahmedabad during the year
2000 [28] included over 3000 eligible children using standard 30-cluster
sampling. It reported total measles vaccine coverage of 60% but did not
find gender inequalities. The authors also reported the measles
incidence rate and found no disparity between boys and girls. This
confirmed the absence of gender-based disparity for measles vaccine.
A small study to assess the vaccination status of 1-2
year old infants in Goa [29], included 362 infants using 30-cluster
sampling method. The proportions of boys who were fully vaccinated,
partially vaccinated and unvaccinated were 84.6%, 13.8% and 1.6%
respectively; it was 86.2%, 9.8% and 4.0% for girls. However the author
did not report the absolute number of infants in each group.
A survey carried out in Surat city [30] to calculate
the incidence of measles among children below the age of five years
collected measles vaccination data of 2597 children (9 months to 5
years), using parental recall and examination of immunization cards. The
overall coverage rate in boys was 49.3% compared to 47.2% among girls.
Although the overall difference was not statistically significant;
analysis by age of children revealed gender-based differences among
younger infants. Thus 33.7% boys in the 9-11 month age group were
vaccinated, compared to 26.1% girls; likewise 52.9% boys and 46.2% girls
in the age group 1-2 years were vaccinated. The gap narrowed with
increasing age; 52.3% boys and 49.8% girls in the 2-3 year age group
were vaccinated. Beyond that age, the gender differences narrowed
further and a slightly higher percentage of 4-5 year old girls had been
vaccinated.
Srivastava and Nayak [31] presented a brief report of
gender bias in vaccination coverage in Patna, the capital of Bihar state
during the years 1983-1990. However, the results were presented
graphically and numerical data could not be extracted.
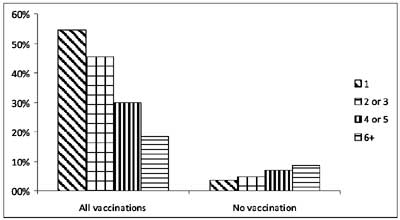
Birth order
The NFHS-3 data [6] showed a trend of declining
vaccination with increasing birth order (Fig. 3). The
proportion of fully vaccinated infants by birth order was 54.6% (first
order), 45.3% (second or third), 29.9% (fourth or fifth) and 18.5%
(sixth or higher). The proportion of unvaccinated infants also showed a
direct relationship; 3.7% among first order, 4.7% among second/third
order, 7.0% among fourth/fifth, and 8.6% among sixth/higher order. Since
the NFHS-3 data presented combined data for birth orders 2 and 3; and 4
and 5; information on each of these could not be obtained separately.
There was also no statistical analysis to confirm the risk associated
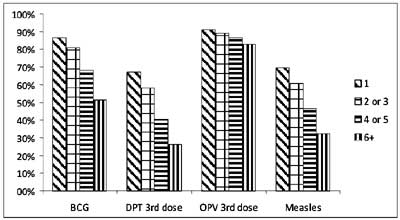
with higher birth order. Analysis of coverage for individual vaccines (Fig.
4) highlights two points: the coverage for OPV is higher than for
DPT as observed previously; and the gaps between increasing birth orders
is much lower for OPV compared to all the other vaccines.
 |
|
Fig 3 Relationship of birth order and childhood
vaccination (data from NFHS-3 survey).
|
 |
|
Fig 4 Coverage of individual vaccines
and relationship to birth order (data from NFHS-3 survey).
|
The 2009 Coverage evaluation survey [13] reported
complete vaccination among infants with birth order 1, 2, 3, 4+ as
67.4%, 64.7%, 53.7%, and 40.4% respectively. The proportion of
unvaccinated infants was 4.4%, 6.7%, 10.8%, and 16.0% respectively.
Analysis of the three NFHS surveys [24] showed that
although higher birth order infants had lower vaccination coverage,
girls were particularly disadvantaged. Among third birth order infants
with two older sisters, only 36.1% girls received age-appropriate
vaccination compared to 45.0% boys. However, third birth order girls
with two older brothers had slightly higher rates than boys in the same
situation.
In a survey of vaccination status of children
dwelling in urban slums in Agra city [32], nearly two-thirds of
unvaccinated infants had birth orders two or greater. Interestingly,
among 228 fully vaccinated infants also, nearly half had birth order two
or higher. The unadjusted and adjusted (for gender and age of child)
relative probability of complete vaccination was significantly lower for
second and third birth order infants compared to first birth order
infants; 0.52 (95% CI 0.36-0.76) and 0.67 (95% CI 0.40-1.13)
respectively.
A small-scale survey in Goa [29], also reported lower
proportion of fully vaccinated infants with higher birth order; it was
86.6%, 88.8%, 69.2% and 75.0%; for birth orders 1, 2, 3 and 4
respectively. The respective proportion of unvaccinated infants was
1.1%, 2.0%, 7.6% and 25.0%. The author did not report absolute numbers
of children in each group.
Pande [33] studied the effect of the gender of older
siblings on the gender-imbalance in rural areas. She reviewed NFHS-1
data and reported that first birth order boys had 38% complete
vaccination compared to 36% in first birth order girls. The complete
vaccination rate of infants with one older sister was 35% among boys and
31% among girls; the rates were identical for boys and girls with two
older sisters. For boys with one older brother, the rate was 35%; the
corresponding rate for girls was 32%. Interestingly, infants with two
older brothers had significantly lower vaccination rates; 22% for boys
and 26% for girls.
Residential Area (Urban, Rural and Urban Slum)
The NFHS-3 survey [6] reported that 57.6% of urban
infants were fully vaccinated compared to 38.6% in rural areas. The
percentage of infants who were not vaccinated was 5.7% in rural areas
compared to 3.3% in urban areas. The urban-rural gap existed for all
individual vaccines, although the gap was lowest with the 3 doses of
OPV. No statistical analysis was carried out in the NFHS-3 report.
The UNICEF 2009-10 survey [13] recorded complete
vaccination in 58.5% rural infants compared to 67.4% urban infants; the
respective unvaccinated infants were 8.5% and 5.2%. The ICMR (1999)
survey [3] evaluating vaccination status of 19000 infants across India
also reported a rural-urban imbalance in complete vaccination (urban
71.7% vs rural 58.5%) as well as no vaccination (rural 11.9%
vs urban 5.7%).
A secondary analysis of NFHS-3 data [34] showed that
among infants residing in urban areas, there were statistically
significant differences in vaccination coverage (BCG, first dose of DPT,
third dose of DPT, and measles) by gender, maternal education level,
maternal occupation, (not working vs working), partner’s
occupation (unemployed/labour vs salaried/professional),
regularity of occupation (all-year vs seasonal/occasional), caste
and religion. Binary logistic regression analysis to calculate the
independent effect of these variables (the dependent variable was "ever
had vaccination") showed a statistically significant effect of maternal
education; no education or incomplete primary education OR 0.238 (95% CI
0.079-0.718); primary education OR 0.304 (95% CI 0.097-0.954). However,
middle/incomplete secondary education showed OR 0.969 (95% CI
0.311-2.968). The other statistically significant effect was found for
‘mother’s autonomy’ (defined as "mother has no money for own use"); OR
0.627 (95% CI 0.408-0.962). There was no statistically significant
independent effect of infant’s gender, wealth category, caste, religion,
maternal occupation, partner’s occupation, or regularity of employment.
The UNICEF nation-wide survey (2005) [12] sampled 30
rural and 15 urban clusters across 22 states (the 7 north-east states
were clubbed together) and reported complete vaccination rate of 47.4%
in rural areas compared to 67.8% in urban areas. The respective
proportion of unvaccinated infants was 18.4% and 7.9%. In terms of
timeliness, only 39.3% infants were completely vaccinated before the
first birthday.
The Department of Family Welfare survey (2002) [11]
reported complete vaccination among 50.3% infants in rural areas
compared to 74.4% in urban. The respective data for non-vaccinated
infants was 23.7% and 8.9% (national average 19.8%).
A small survey in Kerala [35] compared vaccination
rates in three areas; urban, semi-urban and rural. The literacy rate in
all the three areas was above 90%. Standard 30-cluster sampling of
infants 12-23 months old was done and vaccination cards were examined.
The complete vaccination rates in the urban, semi-urban and rural area
were 77.5%, 76.7% and 77.3% respectively. The respective proportions of
unvaccinated infants were 4.2%, 1.9% and below 1%. Although coverage
rates of BCG and DPT/OPV were close to 90% or higher in the three areas,
measles vaccination was highest in the semi-urban area (90.6%) compared
to 77.9% in urban and 79.0% in rural areas.
In Goa state 80% infants residing in rural areas were
fully vaccinated compared to 90.6% infants living in urban areas [29];
however the author did not define urban and rural in the study.
A survey carried out in Chandigarh Union Territory
used maternal recall to assess vaccination status of infants (12-23
months) attending pulse polio booths on a National Immunization Day
[36]. A sample was drawn from 20 urban booths, 16 booths in slums and 4
rural booths to approximate Chandigarh’s population distribution is 50%
urban, 40% in slums and resettled colonies and 10% in rural areas. The
respective proportion of fully vaccinated infants was 80%, 59%, and 83%;
and proportion of unvaccinated infants was 2%, 27%, and 4%.
Another survey in Chandigarh assessed the vaccination
status of 12-23 month old infants [37] from 30 clusters (18 urban, 9
slum, and 3 rural) selecting 40 households from each. The population
distribution was 78% in urban areas, 12% in slums and 10% in rural
areas. The proportion of fully vaccinated infants was 30% in slums, 74%
in rural areas and 62.5% in urban areas. As in other surveys, there was
significant drop-out rate between initiation of vaccination with BCG to
third dose of DPT and measles vaccine.
A vaccination coverage survey in West Bengal [25]
documented complete vaccine coverage of 48.9% in rural areas and 63.9%
in urban areas. Low coverage was observed among the vulnerable groups of
poor minorities, especially in rural areas. Another survey in 3
districts of Assam [26] reported complete vaccination among 85.9%
infants in urban areas compared to 58.7% in rural areas.
Nearly two decades back, a survey [38] in New Delhi
evaluated the vaccination status of children in Narela region having
both rural (population 236000) and urban (population 221000) zones.
Thirty clusters were selected and immunization data of 422 infants
(12-23 month old) was recorded. Complete vaccination (defined in this
study as BCG and three doses of DPT and OPV) was 70.0% in rural area and
73.1% in the urban area. Coverage of individual vaccines in the rural
and urban zones was respectively 83.8% and 88.7% for BCG, 75.7% and
78.8% for third dose of DPT; and 34.3% and 39.2% for measles vaccine.
A community based, cross-sectional survey in two
urbanized villages in East Delhi among 2-4 year old children [39]
collected vaccination data by house-to-house visits. In this study
"urbanized village" was defined as those with population greater than
4000, or population density greater than 400 per square kilometre, or
greater than 75% males employed in activities other than agriculture.
Incidentally, both the selected areas had Health Centers where weekly
vaccination sessions were held. Immunization cards were examined to
ascertain the vaccination status; if unavailable, maternal recall was
used. Among 693 children, the survey did not find any differences in
complete vaccination rates between children living in nuclear or joint
families; or skilled or unskilled paternal occupation. An interesting
finding was that while only 34.6% infants delivered at home were fully
vaccinated; 58.2% of those born in hospitals had received complete
vaccination; the odds ratio was 2.64 (95% CI 1.86 to 3.75). The survey
also reported that 68.2% infants with immunization cards were fully
vaccinated compared to only 27.7% children who did not have cards; odds
ratio 5.78; 95% CI 4.05 to 8.25.
A study examined the vaccination status of 746
children (<2 years old) among migrant families in Delhi through a
30-cluster cross-sectional survey [40] in 23 slums and 7 resettlement
colonies. They further classified the families as either ‘recent
migrants’ (migrated to Delhi within the preceding 5 years) or ‘settled
migrants’ (migrated to Delhi more than 5 years prior). Both groups had
similar demographic profiles in terms of origin, ethnicity, social class
and religion. Vaccination status was determined by examining vaccination
cards and if unavailable, maternal report. The overall vaccination
coverage among migrant families was lower compared to 83.2% among
non-migrant residents of Delhi (although the authors did not measure
this directly). Complete vaccination was recorded in 64.3% recent
migrant infants and 80.8% in settled migrant infants (adjusted OR for
settled migrants 1.93, 95% CI 1.18-3.14). Similarly, coverage with
individual vaccines was lower among recent migrant families;
additionally the difference between settled and recent migrants was
smaller for initial vaccines than those administered later. Thus, 92.6%
recent migrant infants and 89.9% settled migrant infants had received
BCG; whereas 66.2 % and 77.1% of recent and settled migrant infants had
received three doses of DPT. For measles, 67.3% recent migrant infants
were vaccinated compared to 82.0% of settled migrant infants.
Analysis of factors affecting vaccination status
showed better complete vaccination rate with maternal education status
(adjusted OR for >6 years formal education compared to no education was
4.04, 95% CI 2.04-8.00), higher maternal age (adjusted odds ratio for
mothers older than 30 years compared to less than 30 years was 4.47, 95%
CI 1.47-14.15); regular salaried employment of heads of families
(adjusted odds ratio 5.44, 95% CI 1.76-16.77). Another significant
finding was that mothers who had received prenatal care had more
completely immunized infants; adjusted odds ratio for 1-2 antenatal
visits vs no visits was 2.34 (95% CI 1.17-4.67), and for more
than 3 visits 3.89 (95% CI 2.07-7.31). Another finding was a beneficial
effect of postnatal visits by health-care personnel; the odds of
complete vaccination was 2.74 (95% CI 1.42-5.28) compared to no
postnatal visits.
A cross-sectional survey [41] to evaluate missed
immunization opportunities and reasons for non-vaccination in 32 slums
of Udaipur city, included 262 infants (9-24 months old) using 30-cluster
sampling. Vaccination cards and maternal recall were used to determine
vaccination status. The survey recorded 36% complete vaccination; 18%
infants were unvaccinated. The individual vaccine coverage was 79% for
BCG, 80% for first dose of DPT and 50.6% for measles vaccine. However,
the contemporary coverage in urban (non-slum) areas was not described to
make comparisons.
A survey in slums of Lucknow city during 2005 [42]
used 30-cluster sampling with 17 infants (12-23 months old) per cluster.
Immunization cards and maternal reports were used to confirm vaccination
status. Multinomial logistic regression showed that low socioeconomic
status (OR=10.8), Muslim religion (OR=4.3), higher birth order (OR=4.3),
home delivery (OR=3.6) and belonging to a joint family (OR=2.1) were
independent predictors of non-vaccination.
A small cross-sectional survey in Orissa [43]
evaluated vaccination status of 71 infants (<2 years old) among migrant
tribals living in slums of Bhubaneswar city. None of the infants was
completely immunized and 25.3% had not received any vaccine. The overall
coverage for BCG was 59%, first dose DPT 62%, 3 doses DPT 23.6% and
measles vaccine 15%.
A multi-indicator cluster sampling procedure was used
in 1999 to evaluate vaccination coverage of 300 infants in 15 of 299
urban slums in Surat, where about 40% of the population resides in slums
[44]. Vaccination cards (maternal recall if unavailable) were used to
estimate vaccination coverage. The overall complete vaccination rate was
25%. While coverage for three doses of BCG as well as OPV and DPT were
higher among boys, measles vaccine coverage was slightly more among
girls (32.8 % vs 27.8 %).
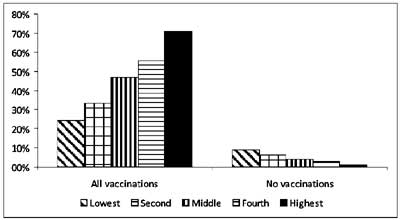
Effect of Poverty and Wealth (Economic Status)
The NFHS-3 survey [6] classified economic status of
families using the ‘wealth index’ defined as a composite score
comprising living standard based on assets (such as television sets,
bicycles etc) and characteristics such as type of construction, access
to water, sanitation system etc. The wealth index was then used to
divide the population into wealth quintiles. The survey report showed
that infants in families with higher wealth indices had better
vaccination status (Fig. 5), although there was no
statistical analysis of the data.
 |
|
Fig 5 Vaccination coverage by wealth
quintiles (data from NFHS-3 survey).
|
A re-analysis of the NFHS-3 data [34] reported that
40% infants among the urban poor (viz. lowest wealth index
quartile) were fully vaccinated; this was statistically significantly
lower than the 65.4% fully vaccinated non-poor children (upper three
wealth index quartiles). These differences between the urban poor and
non-poor existed for infants who did not receive the first dose of DPT
(taken to represent children left out of the immunization program), as
well as those who did not receive the third dose of DPT (representing
children who dropped out from the immunization program).
The UNICEF 2009-10 survey [13] also reported a direct
relationship between the economic status of families and vaccination
coverage; the respective complete vaccination rate in the ascending
order of wealth quintiles was 47.3%, 61.8%, 66.4%, 70.0%, and 76.5%. The
unvaccinated infants in the five quintiles were 13.7%, 6.3%, 4.2%, 4.7%,
and 2.7% respectively. This survey also reported complete vaccination
rate among families with and without BPL (below poverty line) cards; it
was 60.22% and 61.4% respectively. The unimmunized infants were 7.2% and
7.9%, respectively.
Gaudin, et al. [8] used concentration ratios
comparing cumulative population characteristics such as wealth with
cumulative vaccination coverage. They then used this method to compare
data from the first (1992-93) and second (1998-99) NFHS surveys to
estimate the changes over time. They reported that in 1999, there were
fewer areas where children did not receive any vaccination (reflecting
total system failure); the decline was from 38% to 18% in rural areas;
and 17% to 6% in urban areas. However, although wealth-based
inequalities decreased in urban areas, it did not change significantly
in rural areas. This suggests that less wealthy people in villages had
lower vaccination rates. In rural areas, although vaccination coverage
increased, much of this occurred in wealthier segments of the
population.
A group of researchers addressed whether improving
trends in immunization coverage over time could actually mask greater
inequities between different segments of population. They re-analysed
NFHS-3 data and calculated an adjusted score against the backdrop of
average health status of the population and wealth strata [63] and
showed that poor child health is mostly concentrated in poor households;
and the highest impact of increasing average immunization coverage rates
occurred in wealthier households. The adjusted score for full
immunization rate actually declined for many of India’s southern states
which are generally at the top end of the immunization rankings. The
data showed inequalities in child health achievement in states with
better health status such as Kerala and Goa; and states with higher
economic status such as Punjab and Haryana. The traditionally poor
performing states such as Rajasthan, Uttar Pradesh, Bihar, Orissa,
Chhattisgarh and Madhya Pradesh, showed a mixed pattern. Some smaller
states like Jharkhand, Sikkim, Manipur and Arunachal Pradesh showed
evidence of better equity but comparatively lower average. There were
only two states viz. Tamil Nadu and Himachal Pradesh that showed
progress in terms of both equity and achievement.
Mohanty, et al. [23] analysed NFHS data for
trends in childhood vaccination, by household economic status. The
economic status was calculated from consumer durables, land size,
housing quality and water and sanitation facilities of the household.
The concentration index was used to calculate the gap between wealthier
and less wealthy households. The complete vaccination coverage of
infants in the three NFHS surveys was 36%, 40% and 44%. However the
absolute immunization coverage as well as rate of change was much lower
among the lowest wealth quintile; it was 18%, 23% and 24% during the
three surveys. The coverage in the three surveys among second lowest
wealth quintile was 27%, 34% and 33% respectively. In contrast, coverage
for the wealthiest quintile was not only higher than less wealthy
households in each of the surveys, but also showed a rising trend over
time; it increased from 64% (NFHS-1) to 71% (NFHS-3).
The UNICEF 2005 survey used the type of dwelling unit
as an indirect reflection of household economic status [12]. Among
families living in kachcha houses, complete vaccination was noted
in only 40.9%; it was 57.5% in those living in semi-pucca houses
and 65.3% among infants living in pucca houses.
In a study based in Udaipur district of Rajasthan
[45], vaccination status of 2365, under-five children presenting to
primary health centers for curative services, was analysed by household
economic status (determined by the possession of assets and amenities).
In addition to vaccination status, access to piped water was also
assessed. Overall only 40% of 12-23 month old infants were completely
vaccinated; the coverage by ascending order of wealth quartiles was 19%,
29%, 46%, and 68% respectively; the trend existed for all individual
vaccines except OPV. Although there was a direct relationship between
maternal literacy rate and immunization, literacy was itself associated
with socioeconomic status. The literacy rate in the ascending order of
wealth-based quartiles was18%, 42%, 72%, and 92%, showing that women
from wealthier families were more likely to be literate. The survey also
reported a negative relationship between vaccination and distance of the
family from health-care centers; however it was observed that less
wealthy families lived farther away from primary health-care facilities
than more wealthy counterparts. These observations suggest that
household economic status is a significant determinant of childhood
vaccination.
The survey carried out throughout the state of West
Bengal [25] evaluated the impact of living standard; complete
vaccination was 44.6% among those with low standard of living; 58.0% for
medium standard; and 77.1% with high standard of living. In another
study [27] of infants (1-2 years old) residing in rural areas, the
proportion of complete immunization was 45% in poor households and 55%
in non-poor households. In this study, households were classified as
"poor" if the total annual household income was below the poverty line
income.
A survey in Goa [29] categorised household
socio-economic status into 5 unspecified grades; 100% infants in Class I
families were fully immunized; the proportions in other classes were
95.8% in Class II; 92.1% in Class III, 81.7% in Class IV; and 48.6% in
Class V.
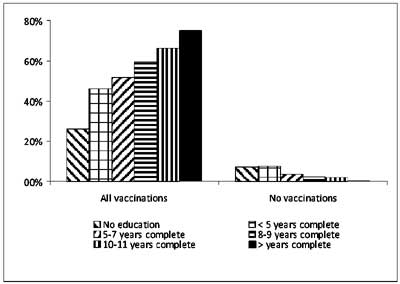
Education or Literacy
Mother’s education status was assessed in the NFHS-3
survey [6]; there was higher complete vaccination and lower
non-vaccination among infants of mothers with more years of formal
education (Fig. 6). However, no statistical analysis was
done.
 |
|
Fig 6 Vaccination coverage by
education/literacy (data from NFHS-3 survey).
|
There was a significant positive correlation between
maternal education and complete vaccination in the UNICEF 2009-10 survey
[13]; 45.3% with no maternal education, 55.4% with <5 years, 64.9% with
5-7 years, 64.9% with 8-9 years, 74.1% with 10-11 years, and 76.6% with
>12 years education. The corresponding unvaccinated infants were 14.3%,
9.0%, 5.1%, 3.8%, 2.1% and 2.0%.
There was a direct relationship between level of
parental education and vaccination status in the UNICEF survey (2005)
[12]. Only 38.2% of illiterate parents were completely vaccinated,
compared to 53.8% with less than 5 years of school education, 59.6% with
5-7 years, 69.9% with 8-10 years, 77.5% with 11-12 years; and 82.4%
among infants whose parents had more than 12 years of schooling.
The Department of Family Welfare survey in 18 states
[11] also reported a positive relationship between complete vaccination
of infants and literacy level of primary care-givers, as follows:
illiterate (31.4%), 1-4 years education (64.4%), 5-8 years (71.3%), 9-14
years (85.5%) and over 15 years (96.7%).
The ICMR 1999 survey [3] reported complete
vaccination rate of 46.4% among infants of illiterate mothers compared
to 64.9% among mothers with primary education, 70.4% with middle
education, and 78.8% with higher secondary maternal education. Paternal
literacy also showed a similar relationship; complete vaccination was
45.8% among infants of illiterate fathers; 59.32% with primary
education, 63.2% with middle education and 69.7% with higher secondary
education. The survey also observed an effect of combined literacy of
both parents; complete vaccination rate was 42.2% infants if both
parents were illiterate, 65.4% if only mother was literate. 50.3% if
only father was literate and 74.4% with both parents literate.
An analysis of over 4000 children living in rural
households in 16 states [27] showed that 66% infants of literate
mothers, 59% of infants with proximate literacy, and 42% infants of
illiterate mothers were fully vaccinated. However, the authors did not
describe definitions for the three categories.
In a cross-sectional study of 693 children (2-4
years) [39] in two urbanized villages in Delhi, 34.4% children of
mothers with no education had received complete vaccination. In
contrast, 48.1% and 50.7% children of mothers who had been educated for
1-8 years and more than 8 years, respectively were fully vaccinated. The
respective odds ratios (compared to no education) were 1.77 (95% CI
1.12-1.28) and 1.96 (95% CI 1.37-2.81). Likewise only 31% of children
whose fathers were uneducated were fully vaccinated compared to 33.7%
and 45.7% where paternal education was 1-8 years and greater than 8
years respectively. The respective ORs were 1.30 (95% CI 0.61-2.1) and
1.80 (05% CI 1.21-2.89). The adjusted OR for complete vaccination was
1.43 (95% CI 1.03-1.99) for literate versus illiterate mothers; and 1.10
(95% CI 0.75-1.60) for literate versus illiterate fathers; suggesting
that maternal literacy was a more important determinant of childhood
vaccination.
A survey in Goa [29] reported that amongst uneducated
mothers, 70.8% infants were fully vaccinated. In contrast, 91.2%, 90.7%
and 100% of infants of mothers with primary, secondary and graduate
level of education respectively had received complete vaccination. The
proportion of fully vaccinated infants showed a gradation with paternal
education; 56% infants of uneducated fathers were fully vaccinated,
compared to 75.3% with primary level, 89.8% with secondary level and
98.5% with graduate level education.
A survey in West Bengal [25] reported complete
vaccination among 61.2% infants with literate mothers and 37.8% with
illiterate mothers; it was 59.9% for infants of literate fathers and
37.6% with illiterate fathers. A survey evaluating vaccination among 616
infants in the age group 1-2 years [26] reported higher complete
vaccination with literate fathers (66.3% compared to 35.4% with
illiterate fathers) and mothers (68.8% compared to 37.9% among
illiterate mothers).
A survey in Agra’s slums [32] reported that over
three quarters of 699 unvaccinated infants had illiterate mothers. Even
among fully vaccinated infants, about 42% mothers were illiterate. The
relative probability of complete vaccination for infants of illiterate
mothers compared to mothers with secondary level education was 0.08 (95%
CI 0.05-0.13) unadjusted and 0.18 (95% CI 0.10-0.30) adjusted for
maternal age and occupation. Among the unvaccinated infants, 92% had
mothers who were not working. This was similar to the proportion in the
fully vaccinated group as well. The relative probability of complete
vaccination among infants of working mothers was 0.37 (95% CI 0.18-0.77)
unadjusted and 0.48 (95% CI 0.21-1.08) adjusted for maternal age, and
education, suggesting that maternal education was a more critical factor
than employment.
A survey in Udaipur district [45] reported complete
vaccination rate of 20% among infants with illiterate mothers, 27% with
less than 5 years education, 42% with 5-7 years education, and 70% among
mothers with more than 8 years education.
One investigator based in the USA postulated an
association not only between childhood vaccination and maternal literacy
at the individual level, but also overall maternal literacy at the
community (district) level [46]. She undertook hierarchical linear
modelling, using the Human Development Profile Index (1994) representing
individual characteristics and the Indian Census (1991) for the
community characteristics; to evaluate within and between social
phenomena. The former provided vaccination data of 5623 infants (1-2
years) and the latter information on literacy rates, wealth, level of
urbanization, etc for 412 districts (rural and urban). Modelling showed
a significant positive relationship between the proportion of literate
females (defined in the Indian census as ability to read and write in
any language) in a district and the likelihood of complete vaccination
of a child. Further modelling controlled for 6 district-level
characteristics representing economic status, access to health-care,
social class, and religion. The positive relationship between district
level of female literacy and complete vaccination of individual children
persisted. The author then undertook modelling after controlling for
literacy status of individual mothers and noted that the positive
relationship between district-level literacy persisted although the
magnitude was somewhat lower. In other words, infants are more likely to
be fully vaccinated if their mothers are literate and they also reside
in an area with overall high female literacy. In the modelling exercise,
the impact of district level female literacy was overcome by higher
educational attainment of individual mothers; suggesting that infants
with highly educated mothers had better vaccination even if the
district-level literacy was not as impressive.
As in other studies, there was a positive
relationship between wealth status and likelihood of complete
vaccination; and significant negative relationship with the proportion
of Muslims and also scheduled tribes in a district. After controlling
for individual factors, modelling suggested that residing in
predominantly Muslim areas increased the likelihood of not getting
completely vaccinated even for non-Muslim infants, those with literate
mothers, and residing in wealthier households. This was in contrast to
caste based disparities; where the effect of residing in an area with
predominantly scheduled tribe households, did not increase the
likelihood of individual non-scheduled tribe children being incompletely
vaccinated. In other words, belonging to scheduled tribe was more
important for incomplete vaccination, than residing in a
disproportionately scheduled tribe area.
Based on these data, the author argued that community
characteristics (especially district-level of female literacy and
wealth) affect childhood vaccination in addition to individual
characteristics.
Effect of Social Factors (Religion, Caste, Women
Empowerment)
The NFHS-3 survey [6] defined the religion of infants
by that of the head of the family. In general, complete vaccination
coverage was higher among Christians and Sikhs; however the rate of
non-vaccination was also higher among these groups. Muslim households
had lower complete vaccination coverage and higher non-vaccination than
Hindu families (Fig. 7). There was no analysis to confirm
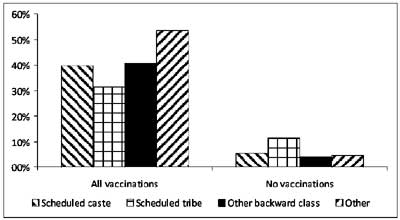
statistical significance. The survey [6] also reported that infants from
general category families had higher vaccination coverage that those
from scheduled caste, scheduled tribe and other backward classes (Fig
8). No statistical analysis as reported.
 |
|
Fig 7 Vaccination coverage by religion
(data from NFHS-3 survey).
|
 |
|
Fig 8 Vaccination coverage by caste
(data from NFHS-3 survey).
|
UNICEF coverage evaluation survey 2010 [13] reported
58.9% complete vaccination rate among infants from scheduled caste
families, 49.8% among scheduled tribe, 60.6% among other backward caste,
and 66.3% among other castes. The non-vaccination rate was 7.8%, 9.9%,
8.6% and 5.5% respectively. Vaccination rate by religion showed complete
vaccination in 61.2% Hindu infants, 55.7% Muslim infants, 78.2% Sikh
infants, 65.6% Christian infants, and 76.6% infants of other religions.
The previous UNICEF survey (2005) [12] reported
complete vaccination coverage of 52.2% and 53.3% among infants from
scheduled caste and scheduled tribe families respectively; it was 57.6%
among other groups. In rural areas complete vaccination rate among
infants from scheduled caste or tribe families was 46.1% compared to
48.3% amongst other infants. The corresponding data for urban areas was
69.4% among scheduled caste or tribe families; and 67.0% amongst other
families. The survey reported higher rate of complete vaccination
amongst infants from Sikh (81.9%) and Christian (67.3%) households
compared to Hindu (55.4%) and Muslim (45.5%) families.
The Department of Family Welfare survey [11],
reported highest proportion of complete vaccination amongst Sikh
families (71.4%), followed by Christian (65.9%), Jain (61.8%), Hindu
(56.9%) and Muslim (47.2%) infants. The survey also reported 54.0%
complete vaccination among infants in scheduled caste families, 51.7%
among scheduled tribe and 58.1% amongst other families.
In the 1999 ICMR survey across 90 districts [3],
there was a relationship between caste and complete vaccination
(scheduled caste 58.9%, scheduled tribe 48.3% and others 67.2%) as well
as no vaccination (scheduled caste 11.3%, scheduled tribe 16.3% and
others 8.0%). However, there did not appear to be significant inequity
based on religion (proportion of fully vaccinated infants was 63.8%
among Hindus, 61.9% among Muslims, 65.1% among Sikhs, and 59.6% among
Christians).
Another survey [27] of over 4000 children in 16
states showed that 60% infants from Hindu households were fully
vaccinated compared to 40% in Muslim households. A comparison of
households with and without empowered females showed complete
immunization in 61% and 46% infants respectively. The definition of
female empowerment was the opportunity to read newspapers, listen to the
radio, or watch television; for at least 1–2 days per week.
A survey in Goa [29] reported that 83.7% infants in
Hindu households were fully vaccinated whereas 2.4% were unimmunized,
compared to 56.0% and 16.0% in Muslim households.
A vaccination coverage survey in West Bengal [25]
reported 68.2% complete vaccination among Hindu general caste, 47.5%
among Hindu scheduled caste/tribe, and 57.1% among Hindu other backward
class. It was 39.8% among Muslims; and 50.0% among people of other
religions. A 30-cluster vaccine coverage survey covering half of Assam’s
districts [26] reported higher complete vaccination among infants from
Hindu households (62.5%) than Muslim households (55.9%). The authors
also reported lower complete vaccination among families belonging to
scheduled caste, schedule tribe and tea garden caste; as compared to
general caste.
A group of researchers undertook house-to-house
visits in 10 small (population <1000) and large (population 1000-22000)
villages in Vikas Nagar area (population approximately 200000) [47].
Hindu households had higher vaccination coverage than Muslim households,
although the investigators suggested that this was more a result of
higher literacy rate and education than religion alone. Incidentally, no
gender-based inequities were observed.
An intervention trial [48] compared health indicators
in 105 villages in Uttar Pradesh, cluster-randomized to receive either
enhanced awareness through public meetings or no intervention. The
investigators included some data on vaccination status by caste. They
noted that the vaccination rate (defined as receipt of one or more
childhood vaccines) in the control group (that did not receive any
intervention) was comparable (46-47%) among families belonging to
scheduled caste as well as mid to high caste. Although this design is
inappropriate to evaluate the impact of caste; the vaccination rates by
caste were similar in the control group population at baseline as well
as after the one-year trial; whereas it had increased significantly in
the intervention group.
A group of scientists in Tamil Nadu compared
vaccination coverage rates determined by the standard 30-cluster survey
method used by the Government of India and a Purposive method [49]. The
basis for this comparison was the difference in the technique used to
obtain the sample in these methods. Sampling with the 30-cluster method
starts close to the village centre and thereby is likely to exclude the
scheduled caste/tribe and other backward class families living at the
periphery or in pockets. The Purposive method reportedly ensures less
exclusion. Although the data showed no significant coverage differences
with the two methods, 30-cluster sampling method gave slightly higher
coverage rates; there was nearly difference 7% for measles vaccine. The
authors suggested that the conventional 30-cluster sampling method may
yield falsely higher vaccination coverage rates on account of exclusion
of socially deprived segments of the population.
Effect of Access to Health-care Services and other
Infrastructure
The ICMR survey (1999) [3] reported complete
vaccination coverage in only 19% infants living in small (population
<500) villages located more than 5 km away from health centers. In
contrast, villages located within 1 km of a health-care center had 56.9%
coverage. However, some villages that were relatively near health
centers also had lower vaccination.
In a study in Udaipur district in Rajasthan [45],
there was a relationship between the vaccination status of 2365 children
(< 5 years old) and the distance of their household from the nearest
primary health-care centre. Complete vaccination rate was 55% for
households <1 km away, 47% for distances 1-2 km, 32% for distance 2-7
km; and 30% for >7 km from health centers. Incidentally less wealthy
families lived farther away from primary health-care facilities than
more wealthy counterparts.
Almost two decades back, a survey was undertaken in
Lucknow’s slum areas [50]. At that time, there were 110 slums accounting
for about 13% of the city’s population. Among these, 40% slums with
about 47% of the slum population were covered by the Urban Basic
Services (UBS) program launched in 1986. The survey compared the
vaccination status of children living in slums with and without UBS
coverage approximately three years after the program inception. Standard
30-cluster sampling with 7 eligible infants (12-23 months) each was
employed. The proportion of fully vaccinated children was 16.2% in UBS
slums compared to 10.9% in non-UBS slums. The respective
proportions of partially-vaccinated infants were 46.2% and 51.5%. There
was no difference in the proportion of non-vaccinated infants (37.6%
each). The drop-out rate between the first and second doses of DPT
vaccine was comparable in the two types of slums; however the drop-out
rate between the second and third doses of DPT was somewhat higher in
non-UBS slums. The measles vaccine coverage in UBS slums was 18.6%
compared to 11.9% in non-UBS slums.
Another group analyzed vaccination status of 4844,
0-4 year old children and categorised it by their usage of public or
private care sector health-care facilities for outpatient curative
services in the preceding fortnight [51]. They included data for only
one child per household and controlled for multiple factors including
demographics, household socioeconomic status, and state of residence.
The likelihood of vaccination was not different among those who used
private or public sector health-care services except for measles
vaccine. They also categorised the data of those who accessed private
sector services by reasons of proximity or reasons of quality; the
latter had a higher proportion of vaccinated infants.
A group of investigators [52] examined NFHS-1 data
and observed a significantly higher rate of complete vaccination among
infants whose mothers had received antenatal care in the first trimester
compared to those who did not (62.4% vs 31.7%).
A vaccine coverage survey in Assam [26] reported a
positive relationship with access to health-care facilities (64.5%
complete vaccination compared to 57.4% among those with no access). The
data also suggested better vaccination status among those residing
within 2 km of health centers.
A door-to-door household comparative survey was
carried out in 1993 in one rural ICDS (Integrated Child Development
Scheme) block and five non-ICDS rural areas in Madhya Pradesh state
[53]. Vaccination data of 709 and 500 children (1-2 years) respectively
was collected. The proportion of vaccinated infants was lower in the
ICDS areas than non-ICDS areas for all vaccines; 80.2% vs 88.8%
for BCG, 79.5% vs 94.4% for three doses of DPT, 88.0% vs
95.3% for three doses of OPV, and 45.7% vs 62.0% for measles
vaccine. These differences are significant especially as nutritional
status of children in both areas was comparable.
A hospital-based study was conducted in a
tertiary-care teaching hospital in Delhi [54]; wherein the vaccination
status of 325 consecutive admitted children in the age range 1-5 years
was evaluated. Maternal report was the primary method of obtaining
vaccination information; additional examination of vaccination cards was
done where possible. Less than one-fifth children were completely
vaccinated; nearly half were partially vaccinated and one-third had not
received any vaccine. The majority of fully vaccinated children had
vaccination cards that could be cross-checked; whereas cards were
available in only a minority of the other children. Most of the children
who were not fully vaccinated had received multiple doses of OPV during
National Immunization days. The authors presented vaccination data by
gender, religion, parental education, and place of delivery; however as
this was a hospital-based study and the demographic profile of admitted
patients was not described, these variables have not been examined
further in this review.
Sahu et al. [55] examined NFHS-2 data to
estimate the impact of individual and community characteristics such as
age, gender and birth order of infants; maternal age, prenatal care,
post-natal care, parental education, institutional delivery, and access
to basic facilities such as health centers, roads and IEC (information,
education and communication) activities. They conducted a two-step
analysis to evaluate the vaccination status based on different subgroups
and individual as well as community characteristics. The data showed
that infants living in communities with all-weather roads, public-sector
health facilities, and exposed to IEC activities had higher complete
vaccination coverage compared to their counterparts.
Effect of Pulse Polio Immunization Program (PPIP)
A group of investigators studied the effect of the
pulse polio immunization program on routine immunization of infants
(12-35 months) residing in rural areas of Bihar, Madhya Pradesh,
Rajasthan and Uttar Pradesh [56]. They evaluated vaccination coverage
before and after the initial years of the pulse polio immunization
program (PPIP) comparing NFHS-1 (1992-93) and NFHS-2 (1998-99) data.
Four outcomes were examined viz.. receipt of first dose of OPV, 3
doses of OPV, at least one dose of any of the non-polio EPI vaccines;
and complete immunization. They reported that the proportion of children
who received the first dose of OPV was 48.1% (95% CI 45.9-50.3%) in 1993
which increased to 72.6% (95% CI 70.6-74.5%) in 1999. Since the coverage
with first dose of DPT during the two periods was not very different;
48.0% (95% CI 45.9%-50.2%) and 49.9% (95% CI 48.0-51.9%) respectively;
the increase in OPV coverage could be attributed to the PPIP. Likewise,
there was no significant change in coverage with at least one dose of
non-polio EPI vaccines; 50.9% (95% CI 48.8-53.1%) and 56.4% (95% CI
54.4-58.4%) in 1993 and 1999 respectively. The complete immunization
coverage in the respective time periods was also similar 17.7% (95% CI
16.2-19.3%) in 1993 and 18.5% (17.2-19.8%) in 1999. Thus there was a
disproportionate increase in OPV coverage between 1992-93 and 1998-99.
The data also showed that although wealth-based inequity declined for
polio vaccination, it increased for other vaccines. Some reduction in
caste- based inequities were observed, but there was no impact on
religion- or residence-based inequities.
The authors offered two possible explanations viz.
that PPIP enhanced knowledge and awareness of polio vaccination but had
no effect on the other vaccination; or the potential increase in routine
vaccination (manifested by increased OPV coverage) was hindered by the
PPIP. It is possible that neither of these extreme positions is
absolutely correct; however the significant conclusion was that although
the pulse polio program resulted in decline in polio cases, it did not
translate into opportunities to increase and sustain routine
immunization.
Maternal Age at Childbirth
The latest UNICEF coverage evaluation survey [13]
reported infant vaccination in relation to maternal age; complete
vaccination was 59.8% in infants with mothers 15-19 years, 65.7% with
20-24 year old mothers, 59.5% for maternal age 25-34 years, 45.5% for
35-44 years, and 56.6% for >44 years. The respective non-vaccination
rates were 6.9%, 5.8%, 7.7%, 17.3%, and 13.8%. The UNICEF 2005 survey
[12] reported that among infants with mothers <25 years of age, complete
vaccination was observed in 56.9%; among mothers 25-34 years old, it was
54.5%; however infants of mothers >35 years had 37.8% complete
vaccination rate.
One research study [57] examined NFHS-3 data and
reported complete vaccination in 41% infants born to adolescent mothers
(15-19 years). Within this group of young mothers, relatively younger
maternal age (less than 18 years) was associated with lower complete
vaccination rate (39.8%) compared to 43.6% among infants of mothers
18-19 years old (OR 1.2, 95 CI 0.94-1.52). Female infants had lower
complete vaccination than males (39.6% vs 42.3%). Infants of
adolescent mothers living in villages had less complete vaccination
(39.1%) compared to those in urban areas (49.9%); OR 0.83, 95% CI
0.62-1.11. Maternal literacy had a direct relationship with infant
vaccination; complete coverage was 24.8% among infants of illiterate
mothers, 47.6% with education below primary level (OR 2.48, 95% CI
1.6-3.84); 49.2% for primary level (OR 2.3, 95% CI 1.65-3.21); 60.5% for
middle level (OR 3.24, 95% CI 2.20- 4.75), and 62.7% for high school
level education (OR 2.52, 95% CI 1.57-4.05). Paternal education also had
an impact; infants of only 31.8% of literate fathers were completely
immunized compared to 36.2% with below primary level education (OR 0.94,
95% CI 0.58-1.52); 43.7% with primary education (OR 1.21, 95% CI
0.84-1.73); 38.7% with middle level (OR 1.01, 95% CI 0.69-1.48); and
53.4% among those with high school level education (OR 1.18, 95% CI
0.79-1.76). There were marginal differences based on religion; 40.8%
infants in Hindu households compared to 43.0% in Muslim families were
fully vaccinated. Among general caste families, complete vaccination
coverage was noted in 48.9% infants, compared to 39.0% among scheduled
caste, 33.4% among scheduled tribe, and 38.9% among other backward
classes; however these differences were not statistically significant.
Infants of mothers with no exposure to media had lower (32.8%)
vaccination coverage compared to 45.2% among mothers with media exposure
(OR 1.15, 95% CI 0.84-1.57). There was a direct relationship between
wealth quintile and complete vaccination status; the coverage was 29.9%
among poorest (OR 1.17, 95% CI 0.79-1.72); 33.5% among poor (OR 1.63,
95% CI 1.09-2.45); 47.1% among middle wealth group, 50.1% among rich (OR
1.68, 95% CI 1.06-2.64) and 64.7% among wealthiest group (OR 3.19, 95%
CI 1.74-5.82). Infants living in nuclear families had lower vaccination
coverage than joint families (38.7% vs 44.5%; OR 0.99, 95% CI
0.76-1.28). Infants with higher birth order had lower vaccination
coverage. One significant finding was that unwanted babies of the
adolescent mothers had very low vaccination coverage compared to wanted
babies (19.1% vs 42.3%; OR 0.36, 95% CI 0.18-0.70). Yet another
interesting finding was that the likelihood of complete vaccination
varied by region; it was 31.9% in northern states, 23.6% in central
states, 49.8% in eastern states, 36.4% in north-eastern states, 50.7% in
western states and 51.8% in southern states.
Household Size
A survey in Goa [29] observed that the proportion of
fully vaccinated infants was related to the size of the household; 98.4%
infants in households with less than 3 members were fully vaccinated,
compared to 85.4% with household size 3-6; and 68.0% with household size
greater than 6.
Discussion
This systematic review has examined the inequities in
childhood vaccination by individual infant factors (gender, birth
order), individual family characteristics (area of residence, maternal
and paternal education status, household economic status, maternal
access to health-care), social characteristics (religion, caste),
community characteristics (access to health-care and other
infrastructure), and state-level differences. The review process had
several strengths including a systematic approach, detailed literature
search from multiple sources, inclusion of publications that actually
measured vaccination coverage directly, and consideration of all types
of study design.
Certain limitations must also be recognized viz.
the inability to access literature databases such as EMBASE, and
administrative databases of institutions and organizations at the state
and national level. No effort was made to pool data through
meta-analysis, as the objective was to explore rather than quantify
factors associated with inequitable vaccination. Despite these
limitations, the review has uncovered several important findings viz.
inequity in childhood vaccination among girls, higher birth order
infants, rural areas and urban slums compared to urban areas,
uneducated/illiterate parents, and poorer socio-economic strata
families. Inequity based on caste and religion has also been
highlighted. An indirect negative impact of the pulse polio immunization
program on routine childhood vaccination has been described; but not
fully substantiated.
It can be argued that most of the inequities
uncovered in this systematic review are intuitively obvious from
experience over several decades. For example, female gender, poverty,
illiteracy etc are the ‘usual’ risk factors for not only health-related
outcomes, but all other human development outcomes. The issue is what
can be done to redress the problems identified. The three NFHS surveys
over a decade and half have consistently reported more-or-less the same
inequities and if anything, a worsening trend over time. However, the
knowledge has not been translated to action(s) to address the problem.
Therefore, it is entirely possible that subsequent surveys will also
show similar findings unless something is done urgently. An obvious
proposal would be targeted campaigns to identify and vaccinate the
groups of infants at highest risk of being unimmunized or incompletely
vaccinated. However, as discussed below, this may not be the right
approach.
This review also shows that some states are "better"
than others in terms of vaccination performance; it also shows that
certain sections of the population have better coverage (for example
wealthiest segment, people with highest level of education etc). However
this should not distract us from the realization that the ‘better’ and
even the ‘best’ are not good enough. For example, the complete
vaccination coverage in the ‘best’ Indian state approaches only 80%;
while this is certainly better than other states, it is inadequate from
the perspective of disease control/eradication. Similarly, higher level
of maternal education is associated with higher infant vaccination.
However, the NFHS-3 data showed that even among mothers with the highest
educational standard (12 or more completed years of education), complete
vaccination coverage was only 75%. Likewise, complete vaccination
coverage in the wealthiest quintile was also only around 75%. Such
observations argue for strategies to target vaccination inadequacies
rather than inequities alone.
It is also important to note that the inequities and
inadequacies observed in the NFHS surveys are not restricted to
vaccination alone but also other child health issues like nutritional
status, respiratory illness, diarrheal disease, access to health-care
services, appropriate management of common childhood diseases etc [4-6,
58,59]. This suggests that merely tackling the ‘vaccination deficit’ to
achieve ‘targets’ could be helpful in the short-term but most likely
fail in the long-term. However vaccination is somewhat different from
other health-care interventions in the sense that it is administered to
otherwise healthy infants; individual choice (to vaccinate or not
vaccinate a particular infant) has an impact on the community; and
successful vaccination requires families to be proactive rather than
reactive. Therefore childhood vaccination requires higher levels of
motivation amongst families and communities; this can only be achieved
through empowerment especially with knowledge and education.
Based on these observations and perceptions, findings
of this review call for action to strengthen the routine immunization
program in a robust manner, rather than execute knee-jerk reactions to
address inequities. A previous systematic review [60] outlined
evidence-based options to improve routine childhood immunization, by
increasing acceptability amongst families and making vaccination a more
pleasant and convenient experience for infants and families. Another
review [61] outlined approaches to strengthen the overall routine
immunization system, focusing on concrete outcomes (targets) such as
reduction in disease burden rather than vaccination coverage (which is
only a surrogate marker).
It should also be noted that childhood vaccination is
only one component of child health and overall societal health.
Favourable health outcomes in the country can only be expected by
overall strengthening of health-care systems and empowerment of people
in general. In other words, a dual approach has to be planned; viz.
a short-term plan to reduce vaccination inadequacy and inequity; and a
long-term strategy to strengthen the overall health-care system.
This systematic review shows that while the NFHS
series comprise the most robust data on absolute inequities, the lack of
statistical treatment and absence of analysis of risk factors
controlling for complementary and confounding factors, make the
interpretation of findings somewhat difficult. For example, there are
numerous factors linked with inequity; but in the absence of calculation
of adjusted odds ratio or relative risk, the precise significance of the
observation remains unclear. It also does not examine the combined
effect of multiple risk factors in a given infant. A significant
observation in this systematic review is that there are small data sets
independent of the NFHS series that have addressed these issues.
Although these are not representative of the country at large, viewed in
conjunction with the NFHS data, they provide directions for action. The
other finding in this review is the wealth of secondary analysis of the
NFHS data (undertaken almost exclusively by researchers abroad) that
permit analysis of the NFHS data in perspective.
Certain other important observations in this
systematic review must also be highlighted. There is clear disparity
between nation-wide ICMR survey data during 1999 [3] and the NFHS-2
survey [5] data over 1998-99. Given that both surveys used robust
sampling strategies to ensure appropriate population representations, it
is unclear why the results are vastly different. The ICMR survey showed
higher total vaccination coverage and also better performance across all
factors evaluated. It even failed to identify significant gender-based
imbalances. Exploration of the reasons behind these differences was
outside the scope of this review. However this emphasizes that careful
appraisal of methodological design (used for collection and calculation
of vaccination data) is critical to a proper understanding of the
situation.
The data from the 2009-10 UNICEF survey [13] are also
a little surprising as it reports nearly 20% higher complete vaccination
rate compared to the NFHS-3 survey [6]. This could represent tremendous
progress in vaccination coverage over the four year period between the
two surveys. On the other hand, it may reflect methodological
differences and/or inconsistencies; in which case the validity of the
data may be questionable. This is especially relevant because the 2005
coverage survey [12] also reported a significantly higher complete
vaccination rate compared to the NFHS survey at around the same time
period.
Another important observation from the NFHS-3 data is
that coverage for individual vaccines (BCG, DPT, OPV) is much higher
than the proportion of "fully vaccinated" infants; suggesting
significant decline in coverage for each subsequent dose of DPT/OPV and
between the third dose of DPT/OPV and measles vaccine; suggesting that
coverage rates decline as infants grow older. Another interesting
observation is that although DPT and OPV doses are administered at the
same age (and therefore ideally at the same vaccination session), there
is a consistent difference between the coverage for the two vaccines.
This raises three possibilities viz. either parents are
selectively opting for oral vaccine, or personnel administering vaccines
are more conservative with the injectable vaccine; or some of the OPV
doses reported by mothers could be related to the numerous pulse polio
vaccination rounds and not the primary immunization series. A fourth
possibility that mothers somehow forgot the DPT doses but remembered OPV
doses is unlikely given that vaccines administered by injection
(especially if associated with high frequency of local and/or systemic
side effects), are expected to be better remembered.
The declining vaccination coverage of higher birth
order infants needs further exploration. It is often explained away
stating that families with more children become less vigilant about
vaccination. However intuitively speaking, the opposite is expected to
be more likely, as experience with caring for first-born infants would
better familiarize mothers as well as other family members with the
vaccination schedule. A possible reason that has not been explored at
all is whether the absence of occurrence of vaccine preventable diseases
in first born infants and the community, fosters complacency (or worse
resistance) towards vaccination.
Conflict of interest: None. Funding:
UNICEF.
|
=Key Messages
• There are limited nation-wide data
exploring inequity in childhood immunization in India; among
these the three National Family Health Surveys are
methodologically the most robust. Data from an apparently
methodologically robust ICMR survey in 1999 was not corroborated
by contemporary NFHS survey data.
• Data from smaller, focused surveys often
yielded conclusions similar to the NFHS data; however in some
cases there were clear differences in the conclusions.
• There is a high level of disparity in
vaccination coverage in different states. The traditionally poor
preforming states have greater inequities; however there is
significant inequity even among better performing states.
• There are considerable inequities in
childhood vaccination by various individual (gender, birth
order), family (area of residence, wealth, parental education),
social (religion, caste), and societal (access to health-care,
community literacy level) characteristics.
• In general, girls fare worse than boys;
there is an almost 5% relative difference between boys and
girls. Higher birth order infants have lower vaccination rate;
the precise reasons for this have not been elucidated.
• Urban infants have higher coverage than
rural infants and those living in urban slums. There is an
almost direct relationship between household wealth and
vaccination rates.
• The vaccination rates are lower among
infants with mothers having no or low literacy, and families
with insufficient empowerment of women. Paternal literacy has an
inconsistent positive relationship with infant vaccination.
• There is a relationship between religion
and caste, and childhood vaccination; however data are limited
to determine whether these are independent influences or
reflections of other inequities.
• Access to health services and other
infrastructure, is associated with better vaccination coverage
of infants.
• The precise impact of specific risk factors
operating singly or in combination cannot be calculated from
this systematic review; however it provides directions for
targeting the most vulnerable sections of the population.
|
References
1. World Health Organization. World Health
Statistics 2011. Available at:
http://www.who.int/entity/gho/publications/world_health_statistics/EN_WHS2011_Full.pdf.
Accessed on 27 December 2011.
2. No authors listed. Multi Year Strategic Plan
2005–2010. Universal Immunization Programme. New Delhi: Department
of Family Welfare, Ministry of Health and Family Welfare Government
of India; 2005.
3. Singh P, Yadav RJ. Immunization status of
children of India. Indian Pediatr. 2000; 37: 1194-99
4. International Institute for Population
Sciences (IIPS). National Family Health Survey (MCH and Family
Planning), 1992-93: India. Mumbai: IIPS; 1995.
5. International Institute for Population
Sciences (IIPS) and ORC Macro. National Family Health Survey
(NFHS-2), 1998-99: India. Mumbai: IIPS; 2000.
6. International Institute for Population
Sciences (IIPS) and Macro International. National Family Health
Survey (NFHS-3), 2005-06: India. Mumbai: IIPS; 2008.
7. Pande RP, Yazbeck AS. What’s in a country
average? Wealth, gender, and regional inequalities in immunization
in India. Soc Sci Med. 2003;57:2075-88.
8. Gaudin S, Yazbeck AS. Immunization in india
1993–1999: Wealth, gender, and regional inequalities revisited. Soc
Sci Med. 2006;62:694-706.
9. Mathew JL, Shah D, Gera T, Gogia S, Mohan P,
Panda R, et al. UNICEF-PHFI Series on Newborn and Child
Health, India: Methodology for Systematic Reviews on Child Health.
Priorities for Advocacy and Action. Indian Pediatr. 2011;48:183-9.
10. Central Bureau of Health Intelligence.
Directorate of Health Services, Ministry of Health and Family
Welfare. National Health profile 2005. Available at: http://www.
whoindia.org/LinkFiles/Health_Information_System_ CBHI_Book.pdf.
Accessed on 27 December 2011.
11. Department of Family Welfare, Ministry of
Health and Family Welfare, Government of India. Coverage Evaluation
Survey – 2002. IPPI, Routine Immunization and Maternal Care.
National Report. Available from: http://202.71.128.172/nihfw/nchrc/sites/default/files/Coverage%20Evaluation%20Survey%20-%202002%20-20IPPI,%20Routine%20Immunization%20and%20Maternal%
20Care%20-%20National%20Report_0_0.pdf. Accessed on 27 December
2011.
12. No authors listed. Coverage Evaluation
Survey. All India Report 2005. Available from:
http://202.71.128.172/nihfw/nchrc/sites/default/files/All%20India%20Report
%202005%20Coverage%20Evaluation%20Survey-1044_2.pdf. Accessed on 27
December 2011.
13. UNICEF. 2009 Coverage Evaluation Survey.
Government of India, Ministry of Health & Family Welfare and UNICEF.
Available from: www.unicef.org/india/health_ 5578.htm and
www.unicef.org/india/National_Fact_ Sheet_CES_2009.pdf. Accessed on
20 January 2012.
14. World Health Organization. WHO-UNICEF
estimates of DTP3 coverage. Available at: http://apps.who.int/immunization_monitoring/en/globalsummary/timeseries/tswucoveragedtp3.htm.
Accessed on 12 December 2011.
15. India: WHO and UNICEF estimates of
immunization coverage: 2010 revision. Available at:http://www.who.int/immunization_monitoring/data/ind.pdf.
Accessed on 12 December 2011.
16. UNICEF and the World Health Organization.
Immunization summary: The 2007 edition A statistical reference
containing data through 2005. Available at:
http:/www.unicef.org/publications/files/Immunization_
Summary_2007.pdf. Accessed on 12 December 2011.
17. UNICEF and WHO summary of national
immunisation coverage: 2011. Available at:
http://www.technet21.org/index.php/forum/announcements/publications/2586-unicef-and-who-summary-of-national-immunisation-coverage-2011.html.
Accessed on 12 December 2011.
18. Childinfo. Monitoring the situation of
children and women. Available at:
http://www.childinfo.org/immunization.html. Accessed on 12 December
2011.
19. Immunization: reducing measles mortality.
Available at: http://www.childinfo.org/files/India_1997_2010.pdf.
Accessed on 12 December 2011.
20. Singh P, Yadav RJ. Immunisation status of
children in BIMARU states. Indian J Pediatr. 2001;68:495-500.
21. Partha D, Bhattacharya BN. Determinants of
child immunization in four less-developed states of north India. J
Child Health Care. 2002;6:34-50.
22. Gatchell M, Thind A, Hagigi F. Informing
state-level health policy in India: The case of childhood
immunizations in Maharashtra and Bihar. Acta Paediatr.
2008;97:124-6.
23. Mohanty SK, Pathak PK. Rich-poor gap in
utilization of reproductive and child health services in India,
1992-2005. J Biosoc Sci. 2009;41:381-98.
24. Corsi DJ, Bassani DG, Kumar R, Awasthi S,
Jotkar R, Kaur N, et al. Gender inequity and age-appropriate
immunization coverage in India from 1992 to 2006. BMC Int Health Hum
Rights. 2009;14 Suppl 1:S3-9.
25. Som S, Pal M, Chakrabarty S, Bharati P.
Socioeconomic impact on child immunisation in the districts of West
Bengal, India. Singapore Med J. 2010;51:406-12.
26. Phukan RK, Barman MP, Mahanta J. Factors
associated with immunization coverage of children in Assam, India:
over the first year of life. J Trop Pediatr. 2009;55:249-52.
27. Borooah VK. Gender bias among children in
India in their diet and immunisation against disease. Soc Sci Med.
2004;58:1719-31.
28. Bhagyalaxmi A, Kedia G, Rawal VS. Study of
incidence of measles and vaccination coverage in Ahmedabad urban
slums. Indian J Public Health. 2007;51:52-3.
29. Dalal A, Silveira MP. Imunization status of
children in Goa. Indian Pediatr. 2005;42:401-2
30. Desai VK, Kapadia SJ, Kumar P, Nirupam S.
Study of measles incidence and vaccination coverage in slums of
Surat city. Indian J Pediatr. 2002;69:1037-40.
31. Srivastava SP, Nayak NP. The disadvantaged
girl child in Bihar: study of health care practices and selected
nutritional indices. Indian Pediatr. 1995;32:911-3.
32. Ghei K, Agarwal S, Subramanyam MA,
Subramanian SV. Association between child immunization and
availability of health infrastructure in slums in India. Arch
Pediatr Adolesc Med. 2010;164:243-9.
33. Pande RP. Selective gender differences in
childhood nutrition and immunization in rural India: the role of
siblings. Demography. 2003;40:395-418.
34. Agarwal S, Bhanot A, Goindi G. Understanding
and addressing childhood immunization coverage in urban slums.
Indian Pediatr. 2005;42:653-63.
35. Nair TN, Varughese E. Immunization coverage
of infants--rural-urban difference in Kerala. Indian Pediatr.
1994;31:139-43.
36. Bhatia V, Swami HM, Rai SR, Gulati S, Verma
A, Parashar A, et al. Immunization status in children. Indian J
Pediatr. 2004;71:313-5.
37. Gupta M, Thakur JS, Kumar R. Reproductive and
child health inequities in Chandigarh Union Territory of India. J
Urban Health. 2008;85:291-9.
38. Mehra M, Dewan S, Aggarwal S, Garg S.
Immunization coverage evaluation surveys in rural Narela zone and
city zone areas of Delhi. Indian Pediatr. 1990; 27:342-6.
39. Chhabra P, Nair P, Gupta A, Sandhir M, Kannan
AT. Immunization in urbanized villages of Delhi. Indian J Pediatr.
2007;74:131-4.
40. Kusuma YS, Kumari R, Pandav CS, Gupta SK.
Migration and immunization: determinants of childhood immunization
uptake among socioeconomically disadvantaged migrants in Delhi,
India. Trop Med Int Health. 2010;15:1326-32.
41. Money MK, Mohan P. Measles immunisation
coverage in urban slums. Indian J Pediatr. 1999;66:505-9.
42. Nath B, Singh JV, Awasthi S, Bhushan V, Kumar
V, Singh SK. A study on determinants of immunization coverage among
12-23 months old children in urban slums of Lucknow district, India.
Indian J Med Sci. 2007;61:598-606.
43. Swain BK, Mishra S. Immunization coverage
among migrant tribal children in slums of Orissa. Indian Pediatr.
2006;43:1011-3.
44. Sharma R, Desai VK, Kavishvar A. Assessment
of immunization status in the slums of surat by 15 clusters multi
indicators cluster survey technique. Indian J Community Med.
2009;34:152-5.
45. Mohan P. Inequities in coverage of preventive
child health interventions: the rural drinking water supply program
and the universal immunization program in Rajasthan, India. Am J
Public Health. 2005;95:241-4.
46. Parashar S. Moving beyond the mother-child
dyad: women's education, child immunization, and the importance of
context in rural India. Soc Sci Med. 2005;61:989-1000.
47. Elliott C, Farmer K. Immunization status of
children under 7 years in the Vikas Nagar area, North India. Child
Care Health Dev. 2006;32:415-21.
48. Pandey P, Sehgal AR, Riboud M, Levine D,
Goyal M. Informing resource-poor populations and the delivery of
entitled health and social services in rural India: a cluster
randomized controlled trial. JAMA. 2007;298:1867-75.
49. Murthy BN, Ezhil R, Venkatasubramanian S,
Ramalingam N, Periannan V, Ganesan R, et al. A comparison of a
30-cluster survey method used in India and a purposive method in the
estimation of immunization coverages in Tamil Nadu. Indian Pediatr.
1995;32:129-35.
50. Chandra R, Srivastava VK, Nirupam S. Impact
of Urban Basic Services on immunization coverage in a slum area of
northern India. Asia Pac J Public Health. 1992-1993;6:153-5.
51. Howard DH, Roy K. Private care and public
health: do vaccination and prenatal care rates differ between users
of private versus public sector care in India? Health Serv Res.
2004;39:2013-26.
52. Choi JY, Lee SH. Choi JY, Lee SH. Does
prenatal care increase access to child immunization? Gender bias
among children in India. Soc Sci Med. 2006;63:107-17.
53. Trivedi S, Chhaparwal BC, Thora S.
Utilization of ICDS scheme in children one to six years of age in a
rural block of central India. Indian Pediatr. 1995;32:47-50.
54. Kumar D, Aggarwal A, Gomber S. Immunization
status of children admitted to a tertiary-care hospital of north
India: reasons for partial immunization or non-immunization. J
Health Popul Nutr. 2010;28:300-4.
55. Sahu D, Pradhan J, Jayachandran V, Khan N.
Why immunization coverage fails to catch up in India? A
community-based analysis. Child Care Health Dev. 2010;36:332-9.
56. Bonu S, Rani M, Baker TD. The impact of the
national polio immunization campaign on levels and equity in
immunization coverage: evidence from rural North India. Soc Sci Med.
2003;57:1807-19.
57. Singh L, Rai RK, Singh PK. Assessing the
utilization of maternal and child health care among married
adolescent women: evidence from India. J Biosoc Sci. 2012;44:1-26.
58. Agarwal S, Taneja S. All slums are not equal:
child health conditions among the urban poor. Indian Pediatr.
2005;42:233-44.
59. Kjellstrom T, Mercado S. Towards action on
social determinants for health equity in urban settings. Environment
and Urbanization. 2008;20:551-74.
60. Mathew JL. Evidence-based options to improve
routine immunization. Indian Pediatr. 2009;46:993-6.
61. Mittal SK, Mathew JL. Expanded program of
immunization in India: time to rethink and revamp. J Pediatr Sci.
2010;5:e43-e54.
62. Joe W, Mishra US, Navaneetham K.
Socio-economic inequalities in child health: Recent evidence from
India. Glob Public Health. 2010;5:493-508.
63. Arokiasamy P, Pradhan J. Measuring wealth-based health inequality
among Indian children: the importance of equity vs efficiency. Health
Policy Plan. 2011;26:429-40.
|


