I. Banerjee, *N. Ghia, †S. Bandopadhyay,
††H.N. Sayed
and
+D. Mukherjee
From Royal Manchester Children’s Hospital, UK;
*Ramakrishna Mission Seva Pratishthan, Kolkata; †National Nutrition
Monitoring Bureau, Kolkata; ††National Institute of Occupational
Health, ICMR, Kolkata; and
+Vivekananda Institute of Medical Sciences, Kolkata, India.
Correspondence to: I. Banerjee, Department of
Pediatric Endocrinology, Royal Manchester
Children’s Hospital, Hospital Road, Pendlebury, Manchester M27 4HA, United
Kingdom.
E mail: [email protected]
Manuscript received: July 9, 2004, Initial review
completed: August 11, 2004;
Revision accepted: September 27, 2004.
Abstract:
We describe a mixed longitudinal analysis of
body mass index (BMI) in a group of Bengali adolescents (age
11-17 years) from a middle income family background and compare
this against existing national and international data. Healthy
school children, comprising of 416 boys and 343 girls were
consented for annual repeat measurements of weight, height and
pubertal staging between the years 1998 and 2001. The LMS method
was used to construct smoothed BMI mean and standard deviation
(SD) curves. Bengali adolescents have lower BMI than affluent
Indian children and are –1 to –2 SD below US children. BMI
increases in adolescence (boys: r = 0.49, p <0.001, girls: r =
0.54, P <0.001) with age but SMR does not have an independent
effect on BMI.
Key words: Adolescents, Body mass index, Mixed
longitudinal study.
Body mass index (BMI) is a measure of
body fat. Though not ideal, it has reasonable correlation(1) with
more objective measures of adiposity (e.g., dual energy X-ray
absorptiometry). A WHO Expert Committee(2) recommends the use of
BMI in the community and the use of the National Center for Health
Statistics (NCHS) references till local references are developed.
BMI centiles lines rise from 6 years onwards
and continue through adole-scence(3). Though cross-sectional
studies support this trend(4,5), there are few supportive
longitudinal studies. BMI in Indian children has been described by
a cross-sectional normative survey(4) of affluent children (11,863
boys, 7694 girls) in 1988-1991. Compared to North American
children(6), Indian children have lower BMI. A further
cross-sectional study(5) of 818 Bengali boys from middle class
families in 1982-1983 showed BMI much below NCHS centiles between
ages 9 and 16 years.
We sought to investigate if BMI in healthy
Bengali middle income adolescents had changed in a decade
following the previous studies. We aimed to perform a longitudinal
observational study, compare our data against existing standards
and construct a smoothed mean (±1, 2 SD) curve from our group of
children.
Subjects and Methods
Healthy children of middle income
socio-economic standing were consented and recruited from an inner
area school in North Kolkata (1200 children between ages 11 to 16
years). This cohort was followed up from 1998 to 2001 and serial
annual measurements were undertaken on a designated day. Age was
recorded in decimal years. Standing height was measured using a
stadiometer by a single trained observer and recorded to the
nearest 0.1 cm. Weight was recorded by a Seca beam balance to the
nearest 0.1 kg. These values were converted to body mass index by
the formula: BMI = weight in kg/(height in metres)2. NCHS BMI
charts (year 2000) were used to calculate BMI standard deviation
scores (SDS). Pubertal staging (Sex Maturity Rating, SMR) was
performed using the Tanner method(7). Breast staging in girls and
genital staging in boys were chosen to represent SMR.
The distribution of BMI in a population depends
on age and tends to be positively skewed. To construct mean
curves, we used the LMS method(8) which summarizes the centiles by
3 smooth curves representing skewness (L curve), the median (M
curve) and coefficient of variation (S curve). This program uses a
penalised maximum likelihood to fit cubic smoothing splines to the
L, M and S values. The choice of the smoothing parameters for the
L, M and S curves was made on the basis of detrended QQ plots.
Data was analyzed by SPSS 11.5 (Chicago,
Illinois) and non-parametric tests used to compare data in two or
more groups. Univariate analysis of variance was used to compare
non-parametric regression slopes of SMR subgroups in BMI versus
age plots. Growth Analyser 2.0 (version 2.0, build 61) software
was used for LMS curve fitting.
Results
We recruited 416 boys and 343 girls aged 11-16
years in 1998. These children were followed up –27.2% boys and
31.7% girls were re-measured every year for the next 4 years. The
number of children (boys, girls) in each age group were as
follows: 11 (123,169), 12 (117, 167), 13 (161, 197), 14 (161,
183), 15 (110, 140), 16 (58, 74), 17 (30, 42). The combined
database provided a mixed longitudinal database of BMI
measurements in the age range 11 to 17 years.
BMI was converted to SD scores using the NCHS
data. The mean (SD) of BMISDS in Bengali children is lowest at
–1.8 (1.8) at 11 years and rises to –1.1 (1.2) by age 17 years.
All BMI values in Bengalis are –1 to –2 SD outside the mean for US
children. Further comparison was made with cross-sectional data of
nationally representative affluent children in the same age range.
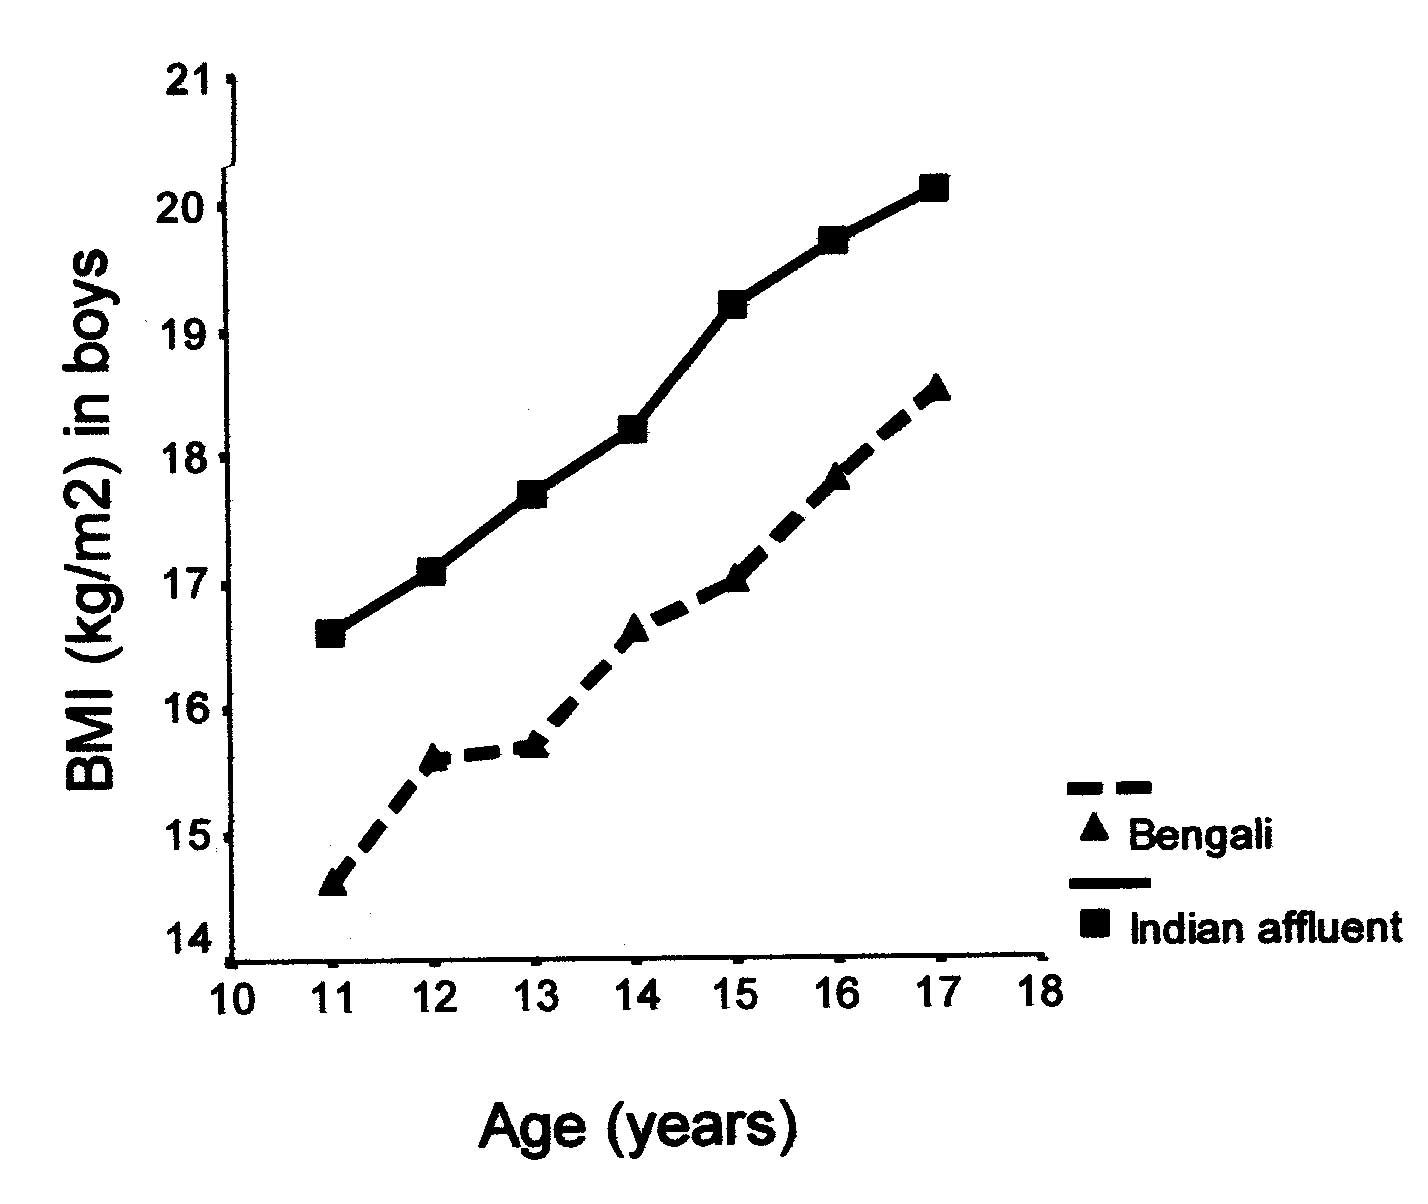
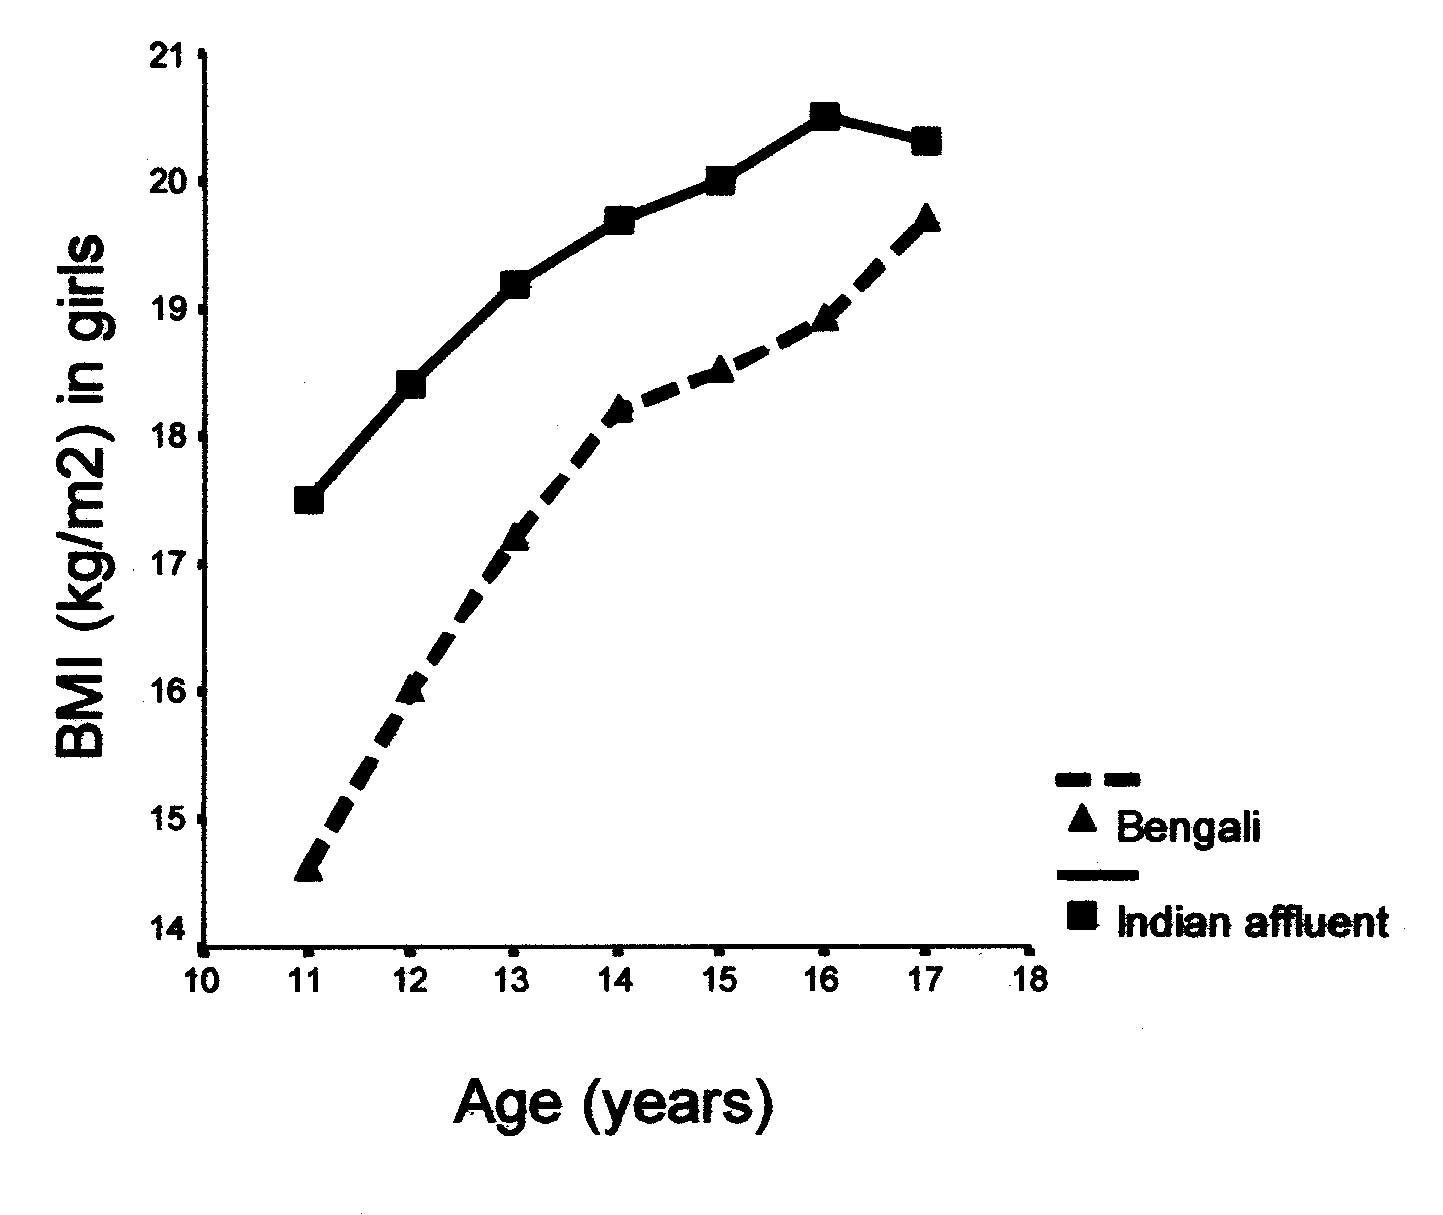
Mean plots (Figs. 1a and 1b) demonstrate higher BMI in Indian
affluent adolescents in all ages. Of the Bengali adolescents,
girls have higher BMI compared to boys in all age groups except at
age 11 years (p = 0.4). There is stepwise rise of BMI with age
[boys (r = 0.49, P <0.001) and girls (r = 0.54, P<0.001)]. To
evaluate if SMR plays an independent role in BMI increment, we
plotted BMI for age in SMR subgroups. Though the number of
children and R2 values were small, significant regression lines
were present in SMR 2, 3, 4 in boys and SMR 2, 4, 5 in girls.
Comparison of regression slopes in these subgroups demonstrated no
independent effect of advancing puberty on increasing BMI.
 |
|
Fig.1a. BMI in middle income Bengali
boys (2001) and Indian affluent boys (1991). |
 |
|
Fig.1b. BMI in middle income Bengali
girls (2001) and Indian affluent girls (1991). |
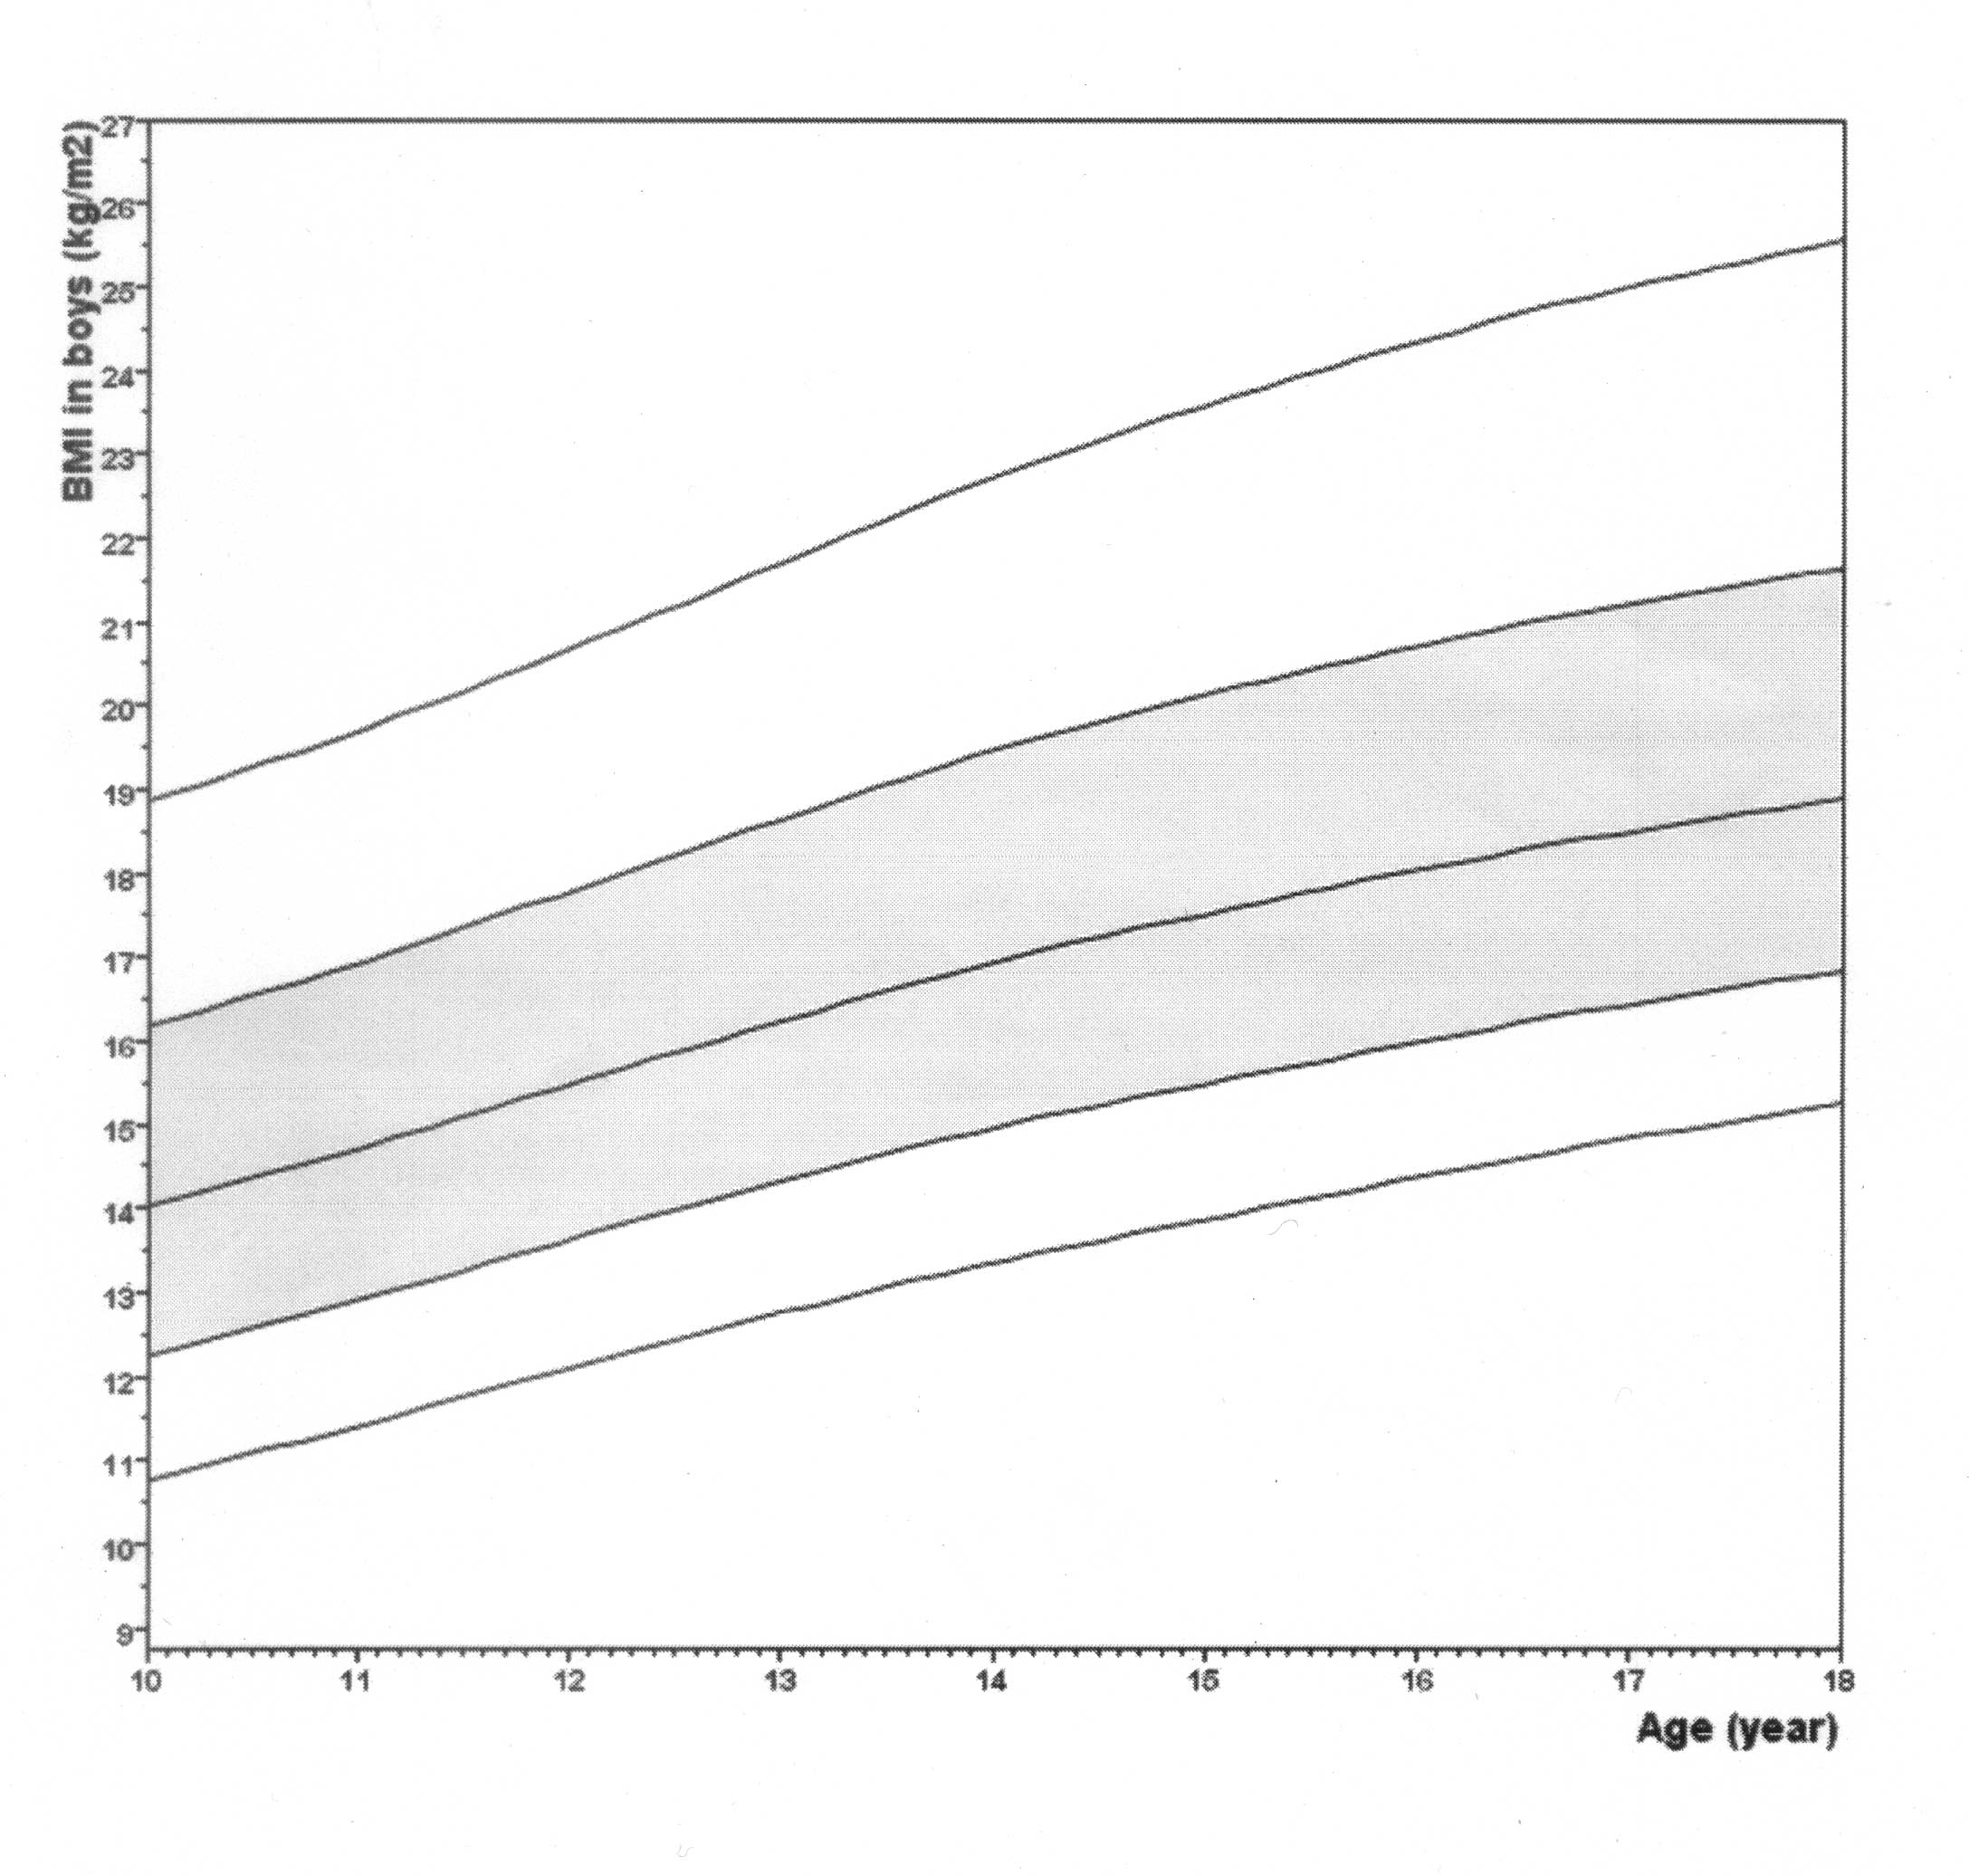
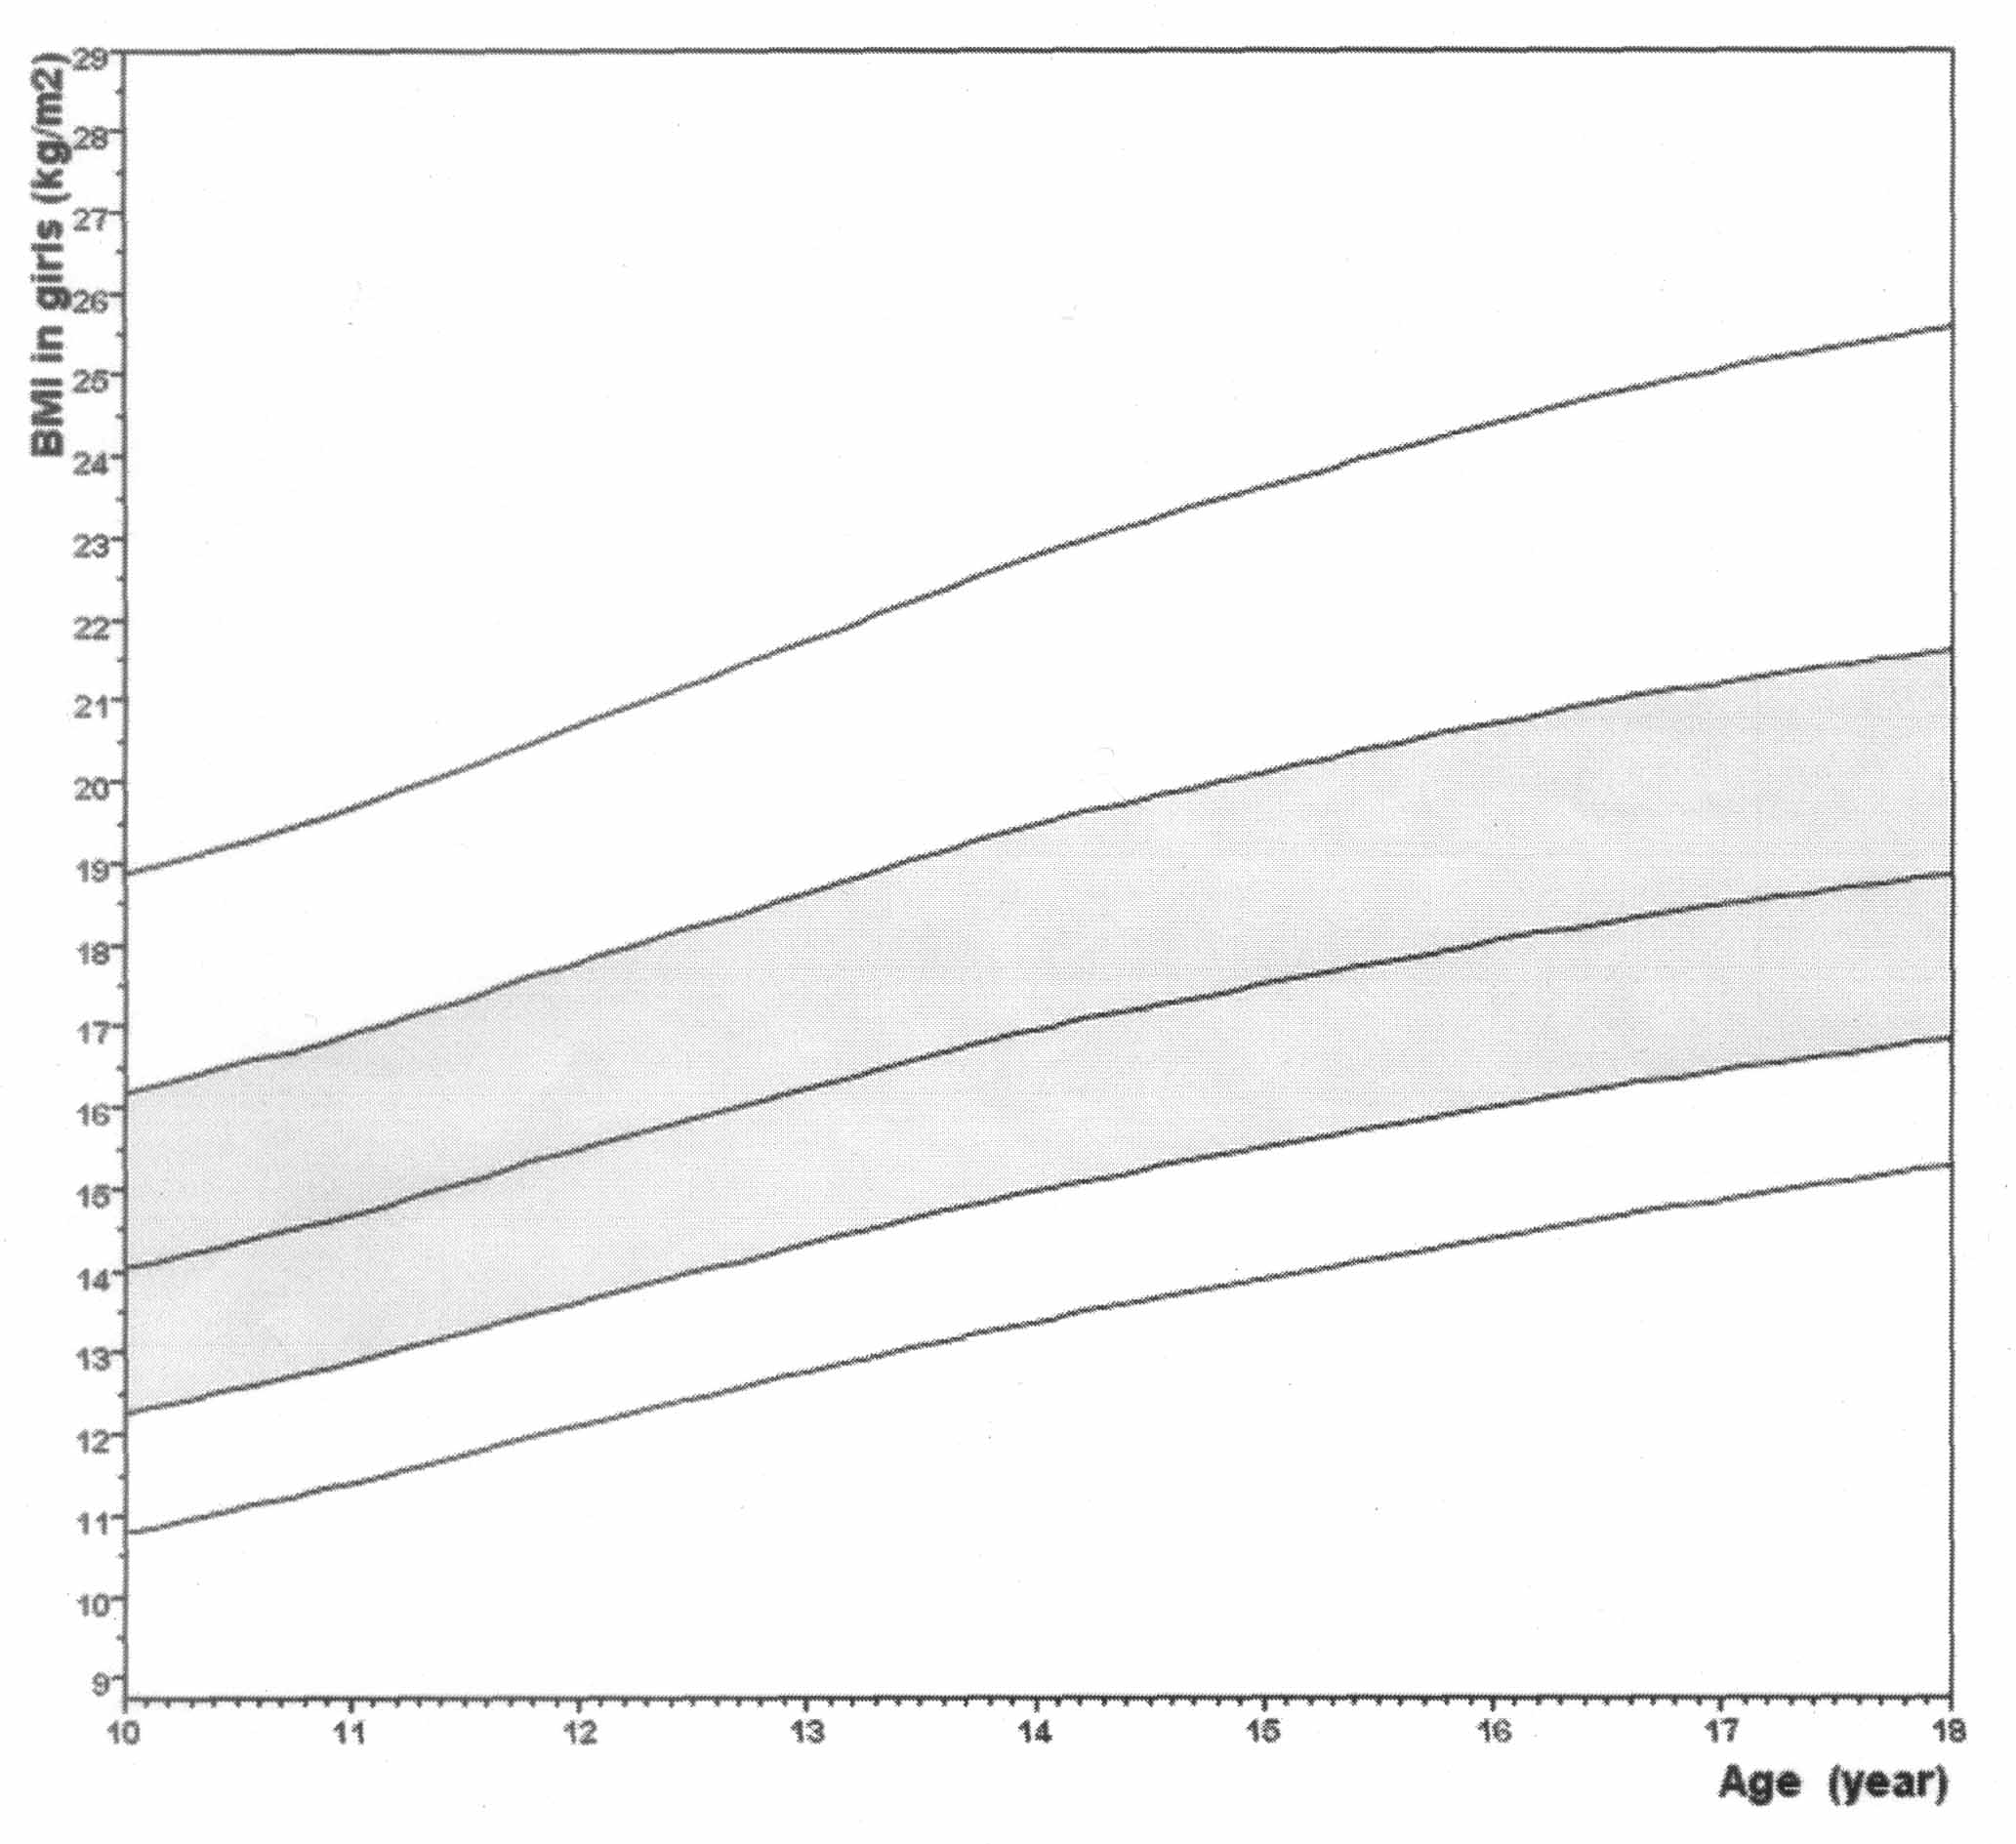
We constructed mean curves (± 1, 2 SD) for BMI
in boys and girls (Figs. 2a and 2b). For boys, the effective
degrees of freedom (edf) were equal to 5 (M), 3 (S) and 2 (L) and
for girls 6, 3 ad 2 respectively. Table I summarises the fitted
LMS curves for BMI by age and sex. L values of 1 indicate
normality and smaller values represent progressively greater
skewness. The M curve is the 0 SD line for BMI. The S curve
defines coefficient of variation (CV) and is rather high at
12-13%.
 |
|
Fig. 2a. BMI smoothed curves in middle
income Bengali boys (2001): mean curve is bounded by ± 1, 2
SD. |
 |
|
Fig. 2b. BMI smoothed curves in
middle income Bengali girls (2001): mean curve is bounded
by ± 1, 2 SD. |
LMS Values for BMI (kg/m2) in Bengali Adolescents
| |
Boys |
Girls |
|
Age (years) |
L |
M |
S |
L |
M |
S |
11.0
|
–0.49
|
14.73
|
0.136
|
–0.51
|
14.71
|
0.135
|
11.5
|
–0.54
|
15.08
|
0.134
|
–0.56
|
15.07
|
0.134
|
12.0
|
–0.60
|
15.56
|
0.133
|
–0.63
|
15.56
|
0.133
|
12.5
|
–0.65
|
15.90
|
0.132
|
–0.69
|
15.90
|
0.132
|
13.0
|
–0.70
|
16.23
|
0.132
|
–0.74
|
16.23
|
0.131
|
13.5
|
–0.75
|
16.57
|
0.131
|
–0.79
|
16.57
|
0.131
|
14.0
|
–0.81
|
16.98
|
0.131
|
–0.86
|
16.99
|
0.131
|
14.5
|
–0.86
|
17.25
|
0.131
|
–0.91
|
17.25
|
0.131
|
15.0
|
–0.92
|
17.58
|
0.130
|
–0.98
|
17.56
|
0.130
|
15.5
|
–0.97
|
17.82
|
0.130
|
–1.04
|
17.81
|
0.129
|
16.0
|
–1.02
|
18.06
|
0.129
|
–1.09
|
18.05
|
0.129
|
16.5
|
–1.06
|
18.28
|
0.128
|
–1.14
|
18.27
|
0.128
|
17.0
|
–1.13
|
18.55
|
0.127
|
–1.21
|
18.53
|
0.126
|
Discussion
There are few studies of anthropometric data in
the adolescent age group. It is well known that BMI rises through
the teenage years(1) but no longitudinal studies in Indian
children demonstrate this. Our study clearly shows the increasing
trend in Bengali boys and girls. Measuring BMI on US centiles (or
Indian affluent children) gives unrealistic evidence of
thinness(6). It is well known that children of Indian parentage
residing in the US have smaller BMI(9) and Bengali middle class
boys fare poorly in comparison to Western counterparts(5). Our
study demonstrates similar deviation and points to the importance
of developing locally based centiles.
We devised mean curves from our group of middle
income Bengali adolescents. The numbers of children in each age
group (11 to 17 years) are not comparable to some of the larger
cross-sectional studies(3). The co-efficient of variation in our
adolescents appear rather high (12-13%) suggesting wider
dispersion of data due to smaller numbers. However these values
are very similar to that of larger data in Dutch children(3) in
the same age range, indicating that variability is a feature of
adolescence itself.
We used one trained observer to measure height,
thereby reducing inter-observer differences. The stadiometer and
beam balance were calibrated before use thereby reducing bias from
instrumental errors. There remains possible bias in selection of
children and staging of puberty. Further, intra-observer
variability and precision estimates were not performed. However,
BMI is a derived number (a ratio) and therefore unlikely to be
altered significantly by minor errors. In fact this is why BMI is
an effective epidemiological tool for use in the community.
Though formal dietary intake was not recorded,
a rough assessment was made at the medical examination and dietary
patterns were found to be similar in all children. All children in
the database were healthy at the time of entry. Though the
possibility of chronic malnutrition and it sequelae remain(10,11),
it is unlikely that the population was "malnourished" enough to
skew the data. It is therefore likely that Bengali children are
genetically determined to have lower BMI and hence the importance
of local data.
A criticism of our study is that we chose
children of middle income and not affluent families. Data based on
affluent children provide normative data against which the
performance of other children is judged. This is important when a
section of the population is significantly malnourished. The
improved socio-economic situation has reduced severe malnutrition
in the community and it is less important to consider affluent
children as the norm. A "middle of the road" approach is therefore
more appropriate, as that practiced in the developed nations like
the United States, United Kingdom and Japan.
On national cross-sectional data, BMI appears
to be similar in the same SMR subgroup. With advancing age and
pubertal hormonal changes, fat (and muscle mass) is deposited to
give rise to higher BMI. It is therefore possible that SMR
subgroups are independent variables in predicting BMI. We however
could not demonstrate an influence of advancing SMR on increasing
BMI. From a practical standpoint, SMR is subjective and prone to
error when performed by non-experienced individuals.
BMI is a derived measurement and does not
provide objective evidence of adiposity. It does not discriminate
between fat mass and lean body mass. It is seen as an abstract
index of nutritional status than as a measure of body
composition(12). Though a reasonable tool for community use(2), we
must exercise caution in laying too great an emphasis on its
interpretation. The real importance of BMI is in documenting
emerging trends with economic prosperity and energy-dense food
intake to correlate with an increase in insulin resistance(13,14).
Acknowledgements
We wish to acknowledge with great respect,
Swami Sarvolokananda Maharaj, Secretary, Ramakrishna Mission Seva
Pratishthan, Vivekananda Institute of Medical Sciences, Kolkata
for providing for a generous grant, logistic support and constant
support for the study. Our sincere thanks go to Dr. A. K. Ray
Chowdhury, Officer-in-Charge, Dr. A. K. Mukherjee, Dr. P. Ganguli
and all the technical staff of ROHC(E) for their cooperation and
help with the study. The pediatricians and residents (during the
study) in the department of Pediatrics, Ramakrishna Mission Seva
Pratishthan, who volunteered to cooperate with this study, deserve
special mention. Finally, we like to thank the Headmaster, the
teachers, the guardians and students of Ramkamal High School, Dum
Dum, Gopalpur, for their active participation without which this
study could not have been possible.
Contributors: IB analysed the data and wrote
the manuscript. NG contributed in data collected and edited the
paper. SB was involved in data collection and drafting. HNS was
the study director for concept, design and execution. DM was the
chief investigator responsible for design, planning and editing.
Funding: Vivekananda Institute of Medical
Sciences Award.
Competing interests: None stated.
|
Key
Messages |
• Boys and girls from Bengali middle income families have lower
BMI than affluent Indian or US children
• Bengali adolescent BMI smoothed mean curves may be useful
tools in the local population
|
|
|
1. Pietrobelli A, Faith MS, Allison DB,
Gallagher D, Chiumello G, Heymsfield SB. Body mass index as
a measure of adiposity among children and adolescents: a
validation. J Pediatr 1998; 132: 204-210.
2. Physical Status: The use and
Interpretation of Anthropometry - Report of a WHO Expert
Committee, Geneva World Health Organiza-tion. 1995; pp.
263-308.
3. Frederiks AM, Van Buuren S, Wit JM,
Verloove-Vanhorick SP. Body index measure-ments in 1996-97
compared with 1980. Arch Dis Child 2000; 82:107-112.
4. Agarwal KN, Saxena A, Bansal AK,
Agarwal DK. Physical growth assessment in adolescence.
Indian Pediatr. 2001 38: 1217-1235.
5. De Onis M, Dasgupta P, Saha S,
Sengupta D, Blossner M. The National Center for Health
Statistics reference and the growth of Indian adolescent
boys. Am J Clin Nutr 2001, 74: 248-253.
6. Rosner B, Prineas R, Loggie J, Daniels
SR. Percentiles for body mass index in US children 5 to 17
years of age. J Pediatr 1998; 132: 211-222.
7. Tanner JM: Growth at Adolescence, 2nd
ed. Oxford, England, Blackwell Scientific Publications,
1962.
8. Cole TJ, Green PJ. Smoothing reference
centile curves: the LMS method and penalised likelihood.
Stat Med 1992; 11: 1305-1319.
9. Rosner B, Prineas R, Loggie J, Daniels
SR. Percentiles for body mass index in US children 5 to 17
years of age. J Pediatr 1998; 132: 211-222.
10. Gupta RK, Mittal RD, Agarwal KN,
Agarwal DK. Muscular sufficiency, Serum protein, enzymes and
bioenergetic studies (31-phosphorus magnetic resonance
spectroscopy) in chronic malnutrition. Acta Pediatr 1994;
83: 327-331.
11. Agarwal KN, Agarwal DK, Upadhyay SK.
Sequelae of early undernutrition on reaction time of rural
children at 11-14 years. Indian J Med Res 1998; 107:98-102.
12. Wells JCK. Measurement: A critique of
the expression of paediatric body composition data. Arch Dis
Child, 2001; 85: 67-72.
13. Yajnik CS. Early life origins of
insulin resistance and type 2 diabetes in India and other
Asian countries. J Nutr 2004; 134: 205-210.
14. Hales CN, Barker DJ. Type 2 (non-insulin-dependent)
diabetes mellitus: the thrifty phenotype hypothesis.
Diabetologia. 1992; 35: 595-601.
.
|
