|
|
|
Indian Pediatr 2018;55: 469-473 |
 |
Cytogenetic Profiles of 472 Indian Children
with Acute Myeloid Leukemia
|
|
Anudishi Tyagi 1,
Raja Pramanik1,
Shilpi Chaudhary1,
Anita Chopra2 and
Sameer Bakhshi1
From Departments of 1Medical Oncology and
2Laboratory Oncology, All India Institute of Medical
Sciences,
New Delhi, India.
Correspondence to: Dr Sameer Bakhshi, Professor of
Pediatric Oncology, Department of Medical Oncology, Dr BRA Institute
Rotary Cancer Hospital, AIIMS, New Delhi, India.
Email: [email protected]
Received: April 24, 2017;
Initial review: June 21, 2017;
Accepted: March 12, 2018.
|
|
Objective: To analyze the
cytogenetic abnormalities of a large cohort of consecutive pediatric
Acute Myeloid Leukemia (AML) patients, treated on a uniform protocol.
Design: Review of case records.
Setting: Pediatric Cancer Center
of tertiary care hospital between June 2003 and June 2016.
Participants: 617 consecutive
de novo pediatric AML patients were screened and 472 patients were
found eligible. Eligibility criteria included non M3 patients,
successful cytogenetic profile and availability of complete records
Main outcome measure: Cytogenetic
profile.
Results: Gum-hypertropy,
chloromas and rate of complete remission were significantly different
between European Leukemia Network classification (ELN) cytogenetic risk
groups (P<0.01). t (8;21) (141, 29.8%), loss of Y
chromosome (61,12.9%) and trisomy 8 (39, 8.3%) were the most common
abnormalities. Among the chromosomal gains, trisomy 8 and trisomy 21
(both P<0.01) were significantly different among the three ELN
risk groups. Among the chromosome losses, monosomy 5, 7 (both P<0.01)
and 9 (P=0.03), loss of X and loss of Y (both P<0.01) were
statistically different amongst three cytogenetic risk groups.
Event-free survival (P<0.01) and overall survival (P<0.01)
were found to be significantly different among the three risk groups.
Conclusions: The higher frequency
of t (8; 21) and its association with chloroma in Indian
pediatric patients is different from other studies around the world.
Keywords: Childhood cancers, Chloroma,
Chromosomal translocation, Karyotype.
|
|
A
cute myeloid leukemia (AML) is a heterogeneous
disease from morphologic, cytogenetic, immunophenotypic, molecular, and
clinical perspectives. AML accounts for 15% to 20% of all childhood
leukemia [1]. Reliable figure for incidence of AML in Indian children is
lacking.
Cytogenetic and molecular data are recognized as the
most valuable prognostic factors in AML both in National Comprehensive
Cancer Network (NCCN) and European Leukemia Net (ELN) risk
stratification models [2,3]. Most of the studies on cytogenetic
profiling of AML are from Western countries [4] and similar data from
the Indian subcontinents is lacking. We conducted this retrospective
study to analyze the cytogenetic abnorma-lities in AML patients at a
single cancer centre in India.
Methods
This is a single center, retrospective, observational
study conducted at a tertiary cancer center in Northern India. Children
with AML who were registered between June 2003 and June 2016 were
included. This study was approved by the Institutional Ethics Committee.
We included all patients aged £18
year with de novo AML. The patients who had acute
promyelocytic leukemia (M3 AML), secondary AML, therapy related AML and
incomplete records were excluded from the study. All patients were
treated with common protocol (3+7 induction + 3 high dose cytarabine).
Allogenic stem cell transplant in first complete remission (CR1) was not
done. However, at relapse, stem cell transplantation was offered in
second remission (CR2). Their medical records were comprehensively
reviewed for the demographics, baseline disease characteristics,
cytogenetic profile, treatment, and outcomes. Cytogenetic analysis was
considered successful if they qualified ISCN guidelines (evaluation of
20 metaphases for normal cytogenetic and 10 metaphase for abnormal
cytogenetic) [5].
The diagnosis of AML was made according to the World
Health Organization (WHO) classification of hematopoietic neoplasm,
which requires identification of 20% or more leukemic blasts in the bone
marrow or blood [6]. ELN classification was used to categorize divide
the patients into three prognostic risk groups; favorable risk,
intermediate risk and adverse risk [2]. Complex karyotype was defined as
any karyotype with at least three chromosome aberrations, regardless of
their type and the individual chromosomes involved, excluding recurrent
cytogenetic abnormalities [7,8]. Conventional cytogenetic analyses were
conducted on baseline bone marrow samples of patients at National
Accreditation Board for testing and calibration laboratories (NABL).
Bone marrow (BM) cells were cultured for 24 hours, then karyotype was
analyzed using the standard G-banding technique. The karyogram were
constructed, and chromosomal abnormalities were reported in accordance
with the International system for human cytogenetic nomenclature (ISCN
2013) [5]. Fms-related tyrosine kinase 3 internal tandem duplication
(FLT3-ITD) and nucleophosmin-1 (NPM1) mutation were performed using
reverse transcriptase polymerase chain reaction (RT-PCR) from RNA
extracted from BM/PB sample obtained at diagnosis from patients [9,10].
CR was defined as bone marrow blast <5%, absolute
neutrophil count >1000/uL, platelet count >100000/uL, no residual
evidence of extramedullary disease and the patient child independent of
transfusion [11]. EFS were measured from the date of diagnosis until
relapse or death. Relapse following CR is defined as reappearance of
leukemic blast in peripheral blood or the finding of >5% blasts in the
bone marrow, not attributable to another cause [11].
Statistical analysis: Differences between groups
were assessed using Student t test for continuous variables and
Pearson chi-square test for categorical variables. Kaplan-Meier curves
were obtained for survival analysis for event free survival (EFS) and
overall survival (OS) and the log rank test was used for comparison. OS
was measured as the time from the date of diagnosis until death or last
follow-up. The censoring date of the study was January 31, 2017. P<0.05
was considered to be statistically significant. Data were analyzed using
the statistical software STATA 11.1 version (Texas; USA).
Results
A total of 617 patients were registered during the
study period; 145 patients were excluded from the study (16 had
incomplete data, 31 were acute promyelocytic leukemia (APML),
cytogenetic assessment was not done for 61 patients and cytogenetic
assessment had failed in 37 patients). 472 (non M3, de novo AML)
patients (320 boys) were eligible for the detailed analysis. The median
(range) age was 10 (0.3, 18) years. Of these, 265 (56.1%) patients were
in the intermediate risk group and 162 (34.3%) patients in the favorable
risk group. There was no significant difference in baseline hemoglobin,
platelet- and leucocyte count between the three risk groups. Gum
hypertrophy was observed in 124 (26.2%) patients; most of these patients
(66.9%) belonged to the intermediate risk group. Chloroma was present in
100 (21.1%) patients, and 54% of these belonged to the favorable risk
category. Gum hypertrophy and chloroma were significantly different
among the cytogenetic risk groups (both P<0.01). Rate of complete
remission (P<0.01), EFS (P<0.01) and OS (P<0.01)
were significantly different among three cytogenetic risk group (Table
I).
TABLE I Baseline Patient Characteristics and Outcomes Among Different AML Cytogenetic Risk Groups
|
Parameter |
Favourable risk
( n=162) |
Intermediate risk
(n=265) |
Adverse risk
(n=45) |
P value |
|
Hemoglobin (g/dL), mean (SD) |
7.7 (2.5) |
7.7 (2.3) |
7.3 (2.5) |
0.54 |
|
Platelet (×1000/µL), mean (SD) |
53.4 (61.5) |
68.6 (117.6) |
57.4 (81.9) |
0.70 |
|
WBC (×1000/µL), mean (SD) |
27.2 (38.5) |
50.5 (71.0) |
46.4 (69.4) |
0.23 |
|
Gum hypertrophy
|
28 (17.3%) |
83 (31.3%) |
13 (26.3%) |
<0.01 |
|
Chloroma
|
54 (33.9%) |
38 (14.3%) |
7 (15.6%) |
<0.01 |
|
Rate of complete remission |
155 (95.7%) |
206 (77.7%) |
34 (75.5%) |
<0.01 |
|
EFS (mo), median (IQR) |
15.4 (8.8-Not achieved) |
11.2 (5.4-27.8) |
8.3 (3.6-91) |
<0.01 |
|
OS (mo), median (IQR)
|
35.4 (12-Not achieved) |
16.9 (7.9-Not achieved) |
9.3 (5.5-Not achieved) |
<0.01 |
|
WBC: White blood cell; SD: Standard deviation; AML: Acute
myeloid leukemia; EFS: Event free survival; OS: Overall
survival. |
The most common cytogenetic abnormality was the loss
of Y chromosome observed in 61 (12.9%) patients. In the cohort of 472
patients, trisomy 8 was most frequent gain; while among the losses, the
loss of Y chromosome was most commonly observed (n=61) (Web
Fig. 1). Among the chromosomal gains, trisomy 8 (P<0.01)
and trisomy 21 (P<0.01) were found to be significantly different
between all these groups. On analyzing the chromosomal losses, monosomy
5 (P<0.01), monosomy 7 (P<0.01), monosomy 9 (P=0.03),
loss of X chromosome (P<0.01) and loss of Y chromosome (P<0.01)
were significantly different in the three cytogenetic risk groups (Table
II).
TABLE II Various Cytogenetic Abnormalities Across ELN Groups
|
Parameter |
n (%)* |
Favourable risk (n=162) |
Intermediate risk (n=265) |
Adverse risk (n=45) |
P value |
|
Any Monosomy |
29 (6.1%) |
8 (4.9%) |
1 (0.4%) |
20 (44.4%) |
<0.01 |
|
Monosomy 5 |
5 (1.0%) |
1 (0.6%) |
0 (0%) |
4 (9.1%) |
<0.01 |
|
Monosomy 7 |
17 (3.6%) |
3 (1.8%) |
0 (0%) |
14 (31.1%) |
<0.01 |
|
Monosomy 9 |
7 (1.5%) |
4 (2.5%) |
1 (0.3%) |
2 (4.5%) |
0.03 |
|
Any Trisomy |
57 (12.1%) |
10 (6.2%) |
34 (12.7%) |
13 (29.5%) |
<0.01 |
|
Trisomy 4 |
16 (3.4%) |
8 (4.9%) |
6 (2.2%) |
2 (4.5%) |
0.49 |
|
Trisomy 8 |
39 (8.3%) |
3 (1.9%) |
26 (9.7%) |
10 (22.7%) |
<0.01 |
|
Trisomy 21 |
17 (3.6%) |
2 (1.2%) |
7 (2.6%) |
8 (18.1%) |
<0.01 |
|
Loss of sex chromosome |
78 (16.5%) |
66 (40.9%) |
10 (3.7%) |
2 (4.5%) |
<0.01 |
|
X chromosome |
17 (3.6%) |
13 (8.1%) |
4 (1.5%) |
0 (0%) |
<0.01 |
|
Y chromosome |
61 (12.9%) |
53 (33.9%) |
6 (2.2%) |
2 (4.5%) |
<0.01 |
|
Other abnormalities |
425 (90.0%) |
161 (100%) |
231 (86.5%) |
33 (75%) |
<0.01 |
|
*Chromosomal abnormalities are redundant and may not add up to
(100%). |
The information on t (8;21) by cytogenetics
was available in all 472 patients. Out of these, 141 (29.9%) patients
were positive for t (8; 21). WBC count (P=0.01), gum
hypertrophy (P<0.01) and chloroma (P<0.01) were
significantly different between patients with and without t
(8;21). Choloromas were more frequently noted in t (8; 21)
positive patients (P<0.01) (Table III). Significant
difference was observed for trisomy 8 (P<0.01), loss of X
chromosome (P<0.01) and loss of Y chromosome (P<0.01)
status between the two groups with or without t (8;21). There was
no significant difference in the EFS however, significant difference was
observed in OS (P=0.04) of the patients with and without t
(8;21) (Table III).
TABLE III Baseline Parameters, Outcomes and Other Cytogenetic Abnormalities With and Without t (8; 21)
|
Parameter
|
t (8;21) Negative (n=331) |
t (8;21) Positive (n=141) |
P value |
|
Hemoglobin (g/dL), mean (SD) |
7.6 (2.3) |
7.7 (2.5) |
0.55 |
|
Platelet (×1000/µL), mean (SD) |
65.5 (118.5) |
54.9 (63.7) |
0.78 |
|
WBC (×1000/µL), mean (SD) |
50.3 (70.3) |
22.9 (30.2) |
0.01 |
|
Gum hypertrophy
|
101 (30.5%) |
23 (16.3%) |
<0.01 |
|
Chloroma
|
46 (13.8%) |
54 (38.2%) |
<0.01 |
|
CR Status
|
263 (79.4%) |
134 (95%) |
<0.01 |
|
EFS (mo), median (IQR) |
11.6 (5.8-39.4) |
12.6 (8.6-37.7) |
0.15 |
|
OS (mo), median (IQR)
|
16.9 (8.2 - Not achieved) |
31.7 (10.9 - Not achieved ) |
0.04 |
|
Trisomy 4, n (%) |
8 (2.4%) |
8 (5.6%) |
0.14 |
|
Monosomy 7, n (%) |
14 (4.2%) |
3 (2.1%) |
0.52 |
|
Trisomy 8, n (%) |
36 (10.8%) |
3 (2.1%) |
<0.01 |
|
Trisomy 21 n (%) |
15 (4.5%) |
1 (0.7%) |
0.06 |
|
Loss of X chromosome, n (%) |
4 (1.2%) |
13 (9.2%) |
<0.01 |
|
Loss of Y Chromosome, n (%) |
8 (2.4%) |
53 (37.6%) |
<0.01 |
|
SD: Standard Deviation; WBC: White Blood cell; CR: Rate of
complete remission; EFS: Event free survival; OS: Overall
survival. |
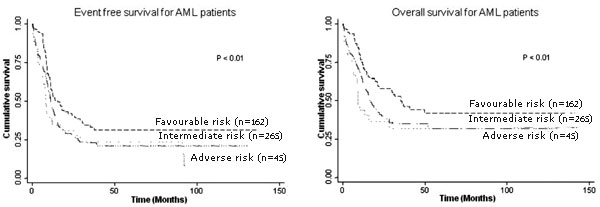
Survival and relapse information for all the 472
patients included in this study was available (Table I).
EFS and OS were statistically significantly different for the three risk
groups identified using the ELN criteria (Fig.1).
 |
|
Fig. 1 Kaplan-Meier survival curves
showing Event-free survival and Overall survival (OS) in three
cytogenetic risk group patients.
|
Discussion
In the current study, cytogenetic abnormalities were
detected in about two-thirds of AML cases. Gum hypertrophy, chloroma and
rate of complete remission were found to be significantly different
between ELN cytogenetic risk groups. Translocation t (8; 21), loss of Y
chromosome and trisomy 8 were the most common cytogenetic abnormalities.
Event-free survival (EFS) and overall survival (OS) were found to be
significantly different among the three risk groups identified using the
ELN criteria.
Our institute is a major referral center for
pediatric AML and caters to a major portion of patients from northern
part of India. As this is not a population-based study, the data
presented here may not be representative of the Indian population. Our
study shows significant difference in overall survival but does not show
any significant difference in event free survival of the patients
differing by t (8;21) status, as we lacked molecular data for all
patients. The data on molecular abnormalities is somewhat fragmented
because of the retrospective nature of the study.
There are only a few population-based studies on AML
patients and most have selection bias (regarding age, treatment protocol
etc). In general, karyotypic pattern and frequency of specific
chromosomal abnormalities were similar to those reported in previous
large series except for few remarkable differences [1,12-18]. The median
age in our analysis was less than other studies that have included both
pediatric and adult patients. Another important finding of this study is
an increased frequency (29.9%) of t (8; 21) in our population.
This compares well with the data published by Amare, et al. [18]
who had reported a similar frequency among their 567 pediatric patients
from a tertiary care cancer center from Western India. Nakase, et al.
[4] have also reported a higher frequency of t (8;21) in the
Japanese patients. However, this is in stark contrast to studies from
other parts of the world [14]. The 21.2% occurrence of chloromas in our
study was significantly higher than the incidence of myeloid sarcoma
reported in literature (2-8%) [3]. Out of these, 33.9% had favourable
risk cytogenetic. The reason for the association of t (8;21) with
chloroma is unknown.
Our study has shown an increased frequency of t (8;
21) and its association with chloroma. Further studies using advanced
molecular tools like Next generation sequencing (NGS) would pave the way
to better understanding of the biology of this disease.
Contributors: AT,RP,SB: contribution to
design, acquisition of data, analysis, interpretation of data, drafting
the manuscript and critical review the intellectual content of the
manuscript; SC,AC: contribution to acquisition of data, interpretation
of data and drafting the manuscript; VS: was the statistician. AT and RP
contributed equally to this work. The final draft was approved by all.
Funding: None; Competing
interest: None stated.
|
What is Already Known?
• Data on cytogenetic profile of pediatric
acute myeloid leukemia patients is scarce.
What This Study Adds?
• Increased frequency of t (8;21) and
significant association of t (8;21) with chloromas are seen in
Northern Indian children with acute myeloid leukemia.
|
References
1. Byrd JC, Mrózek K, Dodge RK, Carroll AJ, Edwards
CG, Arthur DC, et al. Pretreatment cytogenetic abnormalities are
predictive of induction success, cumulative incidence of relapse, and
overall survival in adult patients with de novo acute myeloid leukemia:
Results from Cancer and Leukemia Group B (CALGB 8461). Blood.
2002;100:4325-36.
2. Döhner H, Estey E, Grimwade D, Amadori S,
Appelbaum FR, Büchner T, et al. Diagnosis and management of AML
in adults: 2017 ELN recommendations from an international expert panel.
Blood. 2017;129:424-47.
3. Avni B, Koren-Michowitz M. Myeloid sarcoma:
current approach and therapeutic options. Ther Adv Hematol.
2011;2:309-16.
4. Nakase K, Bradstock K, Sartor M, Gottlieb D, Byth
K, Kita K, et al. Geographic heterogeneity of cellular
characteristics of acute myeloid leukemia: A comparative study of
Australian and Japanese adult cases. Leukemia. 2000;14:163-8.
5. Shaffer LG, McGowan-Jordan J, Schmid M, editors.
An international system for human cytogenetic nomenclature (ISCN).
Basel: Karger; 2013. p. 88-95.
6. Arber DA, Orazi A, Hasserjian R, Thiele J,
Borowitz MJ, Le Beau MM, et al. The 2016 revision to the World
Health Organization (WHO) classification of myeloid neoplasms and acute
leukemia. Blood. 2016;127:2391-405.
7. Mrózek K, Marcucci G, Nicolet D, Maharry KS,
Becker H, Whitman SP, et al. Prognostic significance of the
European leukemia net standardized system for reporting cytogenetic and
molecular alterations in adults with acute myeloid leukemia. J Clin
Oncol. 2012;30:4515-23.
8. Mrózek K. Cytogenetic, molecular genetic and
clinical characteristics of acute myeloid leukemia with a complex
karyotype. Semin Oncol. 2008;35:365-77.
9. Sharawat S.K, Raina V, Kumar L, Sharma A, Bakhshi
R, Vishnubhatla S, et al. High fms-like tyrosine kinase-3 (FLT3)
receptor surface expression predicts poor outcome in FLT3 internal
tandem duplication (ITD) negative patients in adult acute myeloid
leukaemia: A prospective pilot study from India. Indian J Med Res.
2016;143:11-6.
10. Chopra A, Soni S, Pati H, Kumar D, Diwedi R,
Verma D, et al. Nucleophosmin mutation analysis in acute myeloid
leukaemia: Immunohistochemistry as a surrogate for molecular techniques.
Indian J Med Res. 2016;143:763-68.
11. O’Donnell MR, Tallman MS, Abboud CN, Altman JK,
Appelbaum FR, Arber DA, et al. Acute Myeloid Leukemia, Version
3.2017, NCCN Clinical Practice Guidelines in Oncology. J Natl Compr Canc
Netw. 2017;15:926-57.
12. Grimwade D, Walker H, Harrison G, Oliver F,
Chatters S, Harrison CJ, et al. The predictive value of
hierarchical cytogenetic classification in older adults with acute
myeloid leukemia (AML): Analysis of 1065 patients entered into the
United Kingdom Medical Research Council AML11 trial. Blood.
2001;98:1312-20.
13. Enjeti AK, Tien SL, Sivaswaren CR. Cytogenetic
abnormalities in de novo acute myeloid leukemia in adults: Relation to
morphology, age, sex and ethnicity-a single center study from Singapore.
Hematol J. 2004;5:419-25.
14. Bacher U, Kern W, Schnittger S, Hiddemann W,
Schoch C, Haferlach T. Further correlations of morphology according to
FAB and WHO classification to cytogenetics in de novo acute myeloid
leukemia: A study on 2,235 patients. Ann Hematol. 2005;84:785-91.
15. Cheng Y, Wang Y, Wang H, Chen Z, Lou J, Xu H,
et al. Cytogenetic profile of de novo acute myeloid leukemia: A
study based on 1432 patients in a single institution of China. Leukemia.
2009;23:1801-6.
16. So CC, Wan TS, Chow JL, Hui KC, Choi WW, Lam CC,
et al. A single-center cytogenetic study of 629 Chinese patients
with de novo acute myeloid leukemia-evidence of major ethnic differences
and a high prevalence of acute promyelocytic leukemia in Chinese
patients. Cancer Genet. 2011;204:430-8.
17. Li X, Li X, Xie W, Hu Y, Li J, Du W, et al.
Comprehensive profile of cytogenetics in 2308 Chinese children and
adults with de novo acute myeloid leukemia. Blood Cells Mol Dis.
2012;49:107-13.
18. Amare PK, Jain H, Kabre S, Deshpande Y, Pawar P,
Banavali S, et al. Cytogenetic profile in 7209 Indian patients
with de novo Acute Leukemia: A single center study from India. J Cancer
Ther. 2016;7:530-44.
|
|
|
 |
|
