|
|
|
Indian Pediatr 2009;46: 477-489 |
 |
Cross-sectional Growth Curves for Height,
Weight and Body Mass Index for Affluent Indian Children, 2007 |
|
VV Khadilkar, AV Khadilkar, TJ Cole and MG Sayyad
From Growth and Paediatric Endocrine Research Unit,
Hirabai Cowasji Jehangir Medical Research Institute,
Jehangir Hospital, 32, Sassoon Road, Pune, India.
Correspondence to: Dr Vaman Khadilkar, Consultant
Paediatric Endocrinologist, Hirabai Cowasji Jehangir Medical Research
Institute, Jehangir Hospital, 32, Sassoon Road, Pune 411 001. E-mail:
[email protected]
Manuscript received: October 10, 2008;
Initial review: November 4, 2008;
Accepted: March 12, 2009.
|
|
Abstract
Background: The assessment of growth is crucial
in child care and reference data are central to growth monitoring. As
the pattern of growth of a population changes with time it is
recommended that references be updated regularly.
Objective: To produce contemporary growth curves
for Indian children from 5-18 years for height, weight and BMI.
Design: Cross-sectional.
Setting: Multicentric, School based.
Participants: 19834 children were measured from 10 affluent schools from
five major geographical regions of India. Data were analyzed on 18666
children (10496 boys and 8170 girls) using the LMS method and smoothed
percentiles 2007 were produced.
Results: Compared to the 1989 data, median height
at 18 years was 0.6 cm greater for boys but unchanged for girls, while
the 97th height percentile had increased by 1.7 cm for boys and 2 cm for
girls. Boys and girls were heavier and taller at almost all ages. The
study also showed that boys and girls were taller at a younger age.
Conclusions: Contemporary cross sectional
reference percentile curves for height, weight and body mass index for
the assessment of physical growth of present day Indian children are
presented.
Key Words: Body Mass Index, Growth, Height, India, Weight.
|
|
T
he assessment of growth by
objective anthropometric methods (weight, length/ height and body mass
index) is crucial in child care to assess the nutritional status and for
the identification of growth failure. Reference data are central to growth
monitoring and they help doctors and policymakers to diagnose under
nutrition, overweight and obesity, and other growth-related conditions.
The pattern of growth of a population of any age
changes with time and hence it is recommended that references should be
updated regularly(1). The 1977 National Center for Health Statistics (NCHS)
growth curves for US children were revised in 2000, while the UK curves,
first published in 1966, were revised in 1990(2-5).
Nationwide growth surveys have been performed every 10 years in Mainland
China since 1975(6). Reference values for children in Hong Kong first
published in the 1960’s, were updated in 1985, and were updated again in
1993(7).
India is in a phase of nutritional transition and thus
it is vital to update growth references regularly(8). The currently
available growth reference curves in use in India are based
on the data collected by Agarwal, et al.(9,10) in 1989 which
were published in 1992 and 1994 and were then adopted by the Indian
Academy of Pediatrics for growth monitoring in 2007(9-11). These data are
now 17 years old and there are doubts as to whether they are
representative of the growth of present day Indian children. The
populations of developed countries can generally be considered to have
achieved their full genetic growth potential, so there are no longer
important socioeconomic gradients in growth, and a random sample of the
population can be used for constructing growth curves(12). However, in a
developing country such as India, children belonging to affluent families
in urban areas have fewer constraints on growth than other children, thus
making it necessary to measure these children for the purpose of reference
curves(13).
The WHO has encouraged all countries and regions
throughout the world to adopt the new WHO growth standards for children
under 5 years of age published in April 2006, where the data collected
were multi-country (including India) and community-based (Multicentre
Growth Reference Study-MGRS)(14). Therefore, this current study excludes
children under the age of 5 years. This study was planned to design new
reference curves for height, weight and body mass index for affluent urban
Indian children aged 5-18 years.
Methods
The study was initiated, coordinated and the data
analyzed at the Hirabai Cowasji Jehangir Medical Research Institute, Pune
in collaboration with the UCL Institute of Child Health, London. The study
was approved by the Ethical Committee of the Hirabai Cowasji Jehangir
Medical Research Institute, Pune.
Selection of sites: The Indian Academy of
Pediatrics divides India into 5 zones, i.e. North, South, East, West, and
Central. Ten study sites were selected from these regions (Delhi,
Chandigarh, Chennai, Bangalore, Kolkata, Mumbai, Pune, Baroda, Hyderabad
and Raipur). Investigators were identified at these sites and were
provided with details about the study. The study staff identified the
nutritionally well-off areas in their cities and made a list of schools
catering to children of socioeconomically well-off families. The
nutritionally well off areas were identified based on per capita income of
cities (from IAP zones). Within the specified cities, affluent areas (i.e.
areas without slum clusters, low income housing schemes and those with
high land prices as published by Government agencies (Ministry of Urban
Development, Lands Division) were selected(15). Three schools were
selected from those chosen by generating random numbers. The yearly fees
of the selected schools were around Rs 10000 (Indian per capita income
2007-2008, Rs 2021/month)(16). Principals of the schools were approached
and briefed about the study. Permission and informed consent were obtained
from 2 schools each in east, north, central and south zones and at 3
schools in the west. Thus, a total of 11 schools were studied all over
India.
Data collection: Data collection lasted from
June 2007 to January 2008. At each site, the measuring team consisted of
two observers, a doctor, a nurse and two data recorders. At most centers,
the measurements were coordinated with the routine school medical
examination to minimize disturbance to regular classes. All sites used
similar measuring equipments, which were calibrated daily. Standing height
was measured using a portable stadiometer (Leicester Height Meter, Child
Growth Foundation, UK, range 60-207cm). The child stood in socks on the
flat base of the stadiometer with the back of the head, shoulder blades,
buttocks and heels touching the vertical rod, and head in the Frankfurt
plane. Gentle traction was applied to the mandibular process and the
headboard lowered. The reading was taken to the last completed mm,
avoiding parallax, and two such readings were averaged for analysis.
Weight was measured using portable electronic weighing scales (Salter,
India) accurate to 100 g. Children not wishing to take part were excluded,
while children with major medical illnesses likely to affect growth were
measured but excluded from analysis. Data were coded to maintain
anonymity.
Training: Measurements were performed by 17
graduate observers acquainted with the cities and local language. They
were trained as per study protocol, and given written instructions about
the calibration of instruments, measurement techniques, and data entry
formats. They were tested for height inter and intra observer variability,
using 20 children and 12 stadiometers, each observer measuring four
children four times. Inter-observer and intra-observer coefficients of
variation were both <0.01(1%) and there were no significant differences
between observers.
Data entry: On completion of the survey at
each site, the data were sent to Pune for entry. Data were entered using
Microsoft Excel 2003 for Windows, and errors were trapped using range
checks. A total of 19834 children were measured. Queries about
inconsistent data were checked against the original data collection forms,
and obviously erroneous measurements were excluded (1.1%, n=221).
Subjects aged <5 years or >18 years were also excluded (n=922), as
were data where the Z score exceeded ± 5SD (n=25) (17). Body mass
index (BMI) was calculated as weight in Kg/height in meters 2.
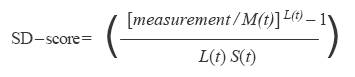
Data analysis: The cleaned data were then
analyzed using the LMS method, which constructs growth reference
percentiles adjusted for skewness(18). Each growth reference is summarized
by 3 smooth curves plotted against age representing the median (M), the
coefficient of variation (S) and the skewness (L) of the measurement
distribution(19). The L, M and S curves convert measurements to exact SD
scores using the formula:
where measurement is the child’s measurement (height or
weight) and L(t), M(t) and S(t) are values read from the smooth curves for
the child’s age t and sex. The models were checked for goodness of
fit using the detrended Q-Q plot, Q Tests and worm plots(20).
Results
Of the 19834 children measured, measurements for 18666
were analyzed (10496 boys and 8170 girls) where 5184 (3218 boys, 1966
girls) 3000 (1678 boys, 1322 girls), 698 (696 boys, 1002 girls) 6920 (3837
boys, 3083 girls) and 1864 (1067 boys, 797 girls) children were from the
North, South, East, West and Central zones, respectively. The differences
between zones were not significant (P value: boys height 0.755,
boys weight 0.722, boys BMI 0.48, P value: girls height 0.95, girls
weight 0.14, girls BMI 0.11).
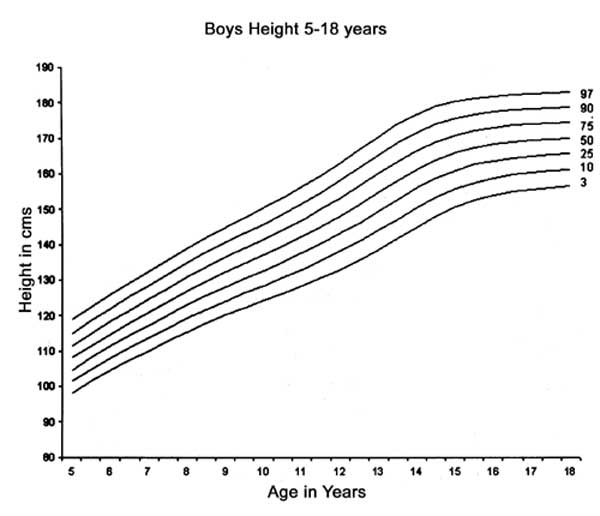
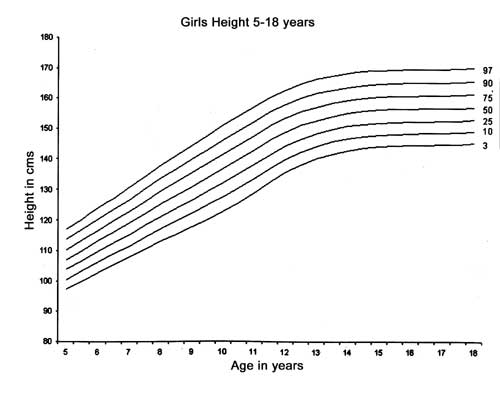
Height, Weight and BMI
Figure 1 and Fig. 2
show the smoothened height curves for Indian boys and girls in the study,
using 3rd, 10th, 25th, 50th, 75th, 90th and 97th percentiles,
respectively. Equivalent height percentile values are shown in Table
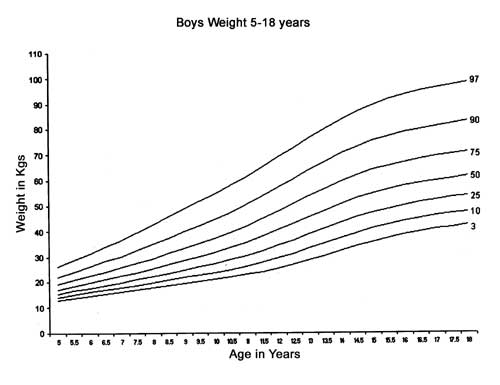
I and Table II, respectively. Figure 3
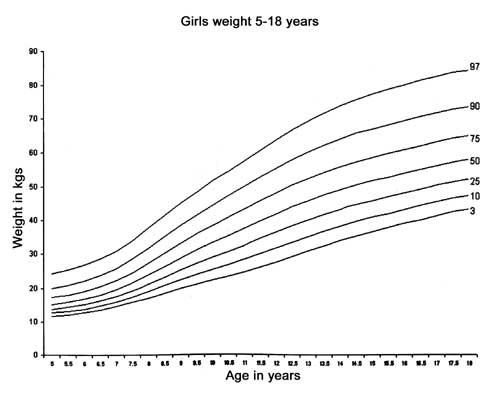
and Fig. 4 show the smoothened weight curves for
Indian boys and girls using 3rd, 10th, 25th, 50th, 75th , 90th and 97th
percentiles, respectively. Equivalent weight percentile values are shown
in Table III and Table IV, respectively. The
secular trend of increasing height and weight are observed from these
figures and tables.
 |
|
Fig. 1 Reference curves for height
percentiles for Indian boys using the conventional 3rd, 10th, 25th,
50th, 75th, 90th and 97th percentiles. |
 |
|
Fig. 2 Reference curves for height
percentiles for Indian girls using the conventional 3rd, 10th, 25th,
50th, 75th, 90th and 97th percentiles. |
 |
|
Fig. 3 Reference curves for weight
percentiles for Indian boys using the conventional 3rd, 10th, 25th,
50th, 75th, 90th and 97th percentiles. |
 |
|
Fig. 4 Reference curves for weight
percentiles for Indian girls using the conventional 3rd, 10th, 25th,
50th, 75th, 90th and 97th percentiles. |
 Table I


Height Percentiles for Indian Boys
| Age (y) |
3 |
10 |
25 |
50 |
75 |
90 |
97 |
| 5 |
98.3 |
101.4 |
104.7 |
108.1 |
111.6 |
115.2 |
118.9 |
| 5.5 |
101.5 |
104.8 |
108.1 |
111.6 |
115.1 |
118.7 |
122.5 |
| 6 |
104.7 |
108.0 |
111.4 |
114.9 |
118.5 |
122.2 |
125.9 |
| 6.5 |
107.5 |
110.9 |
114.4 |
118.0 |
121.6 |
125.4 |
129.2 |
| 7 |
110.1 |
113.7 |
117.2 |
120.9 |
124.6 |
128.4 |
132.3 |
| 7.5 |
112.7 |
116.4 |
120.1 |
123.9 |
127.7 |
131.6 |
135.6 |
| 8 |
115.4 |
119.1 |
123.0 |
126.9 |
130.8 |
134.8 |
138.9 |
| 8.5 |
117.9 |
121.8 |
125.7 |
129.8 |
133.8 |
137.9 |
142.1 |
| 9 |
120.1 |
124.2 |
128.3 |
132.4 |
136.6 |
140.8 |
145.0 |
| 9.5 |
122.2 |
126.4 |
130.6 |
134.9 |
139.1 |
143.4 |
147.7 |
| 10 |
124.3 |
128.6 |
132.9 |
137.2 |
141.6 |
146.0 |
150.4 |
| 10.5 |
126.3 |
130.7 |
135.2 |
139.7 |
144.2 |
148.7 |
153.2 |
| 11 |
128.4 |
133.1 |
137.7 |
142.4 |
147.0 |
151.7 |
156.3 |
| 11.5 |
130.8 |
135.6 |
140.5 |
145.3 |
150.2 |
155.0 |
159.8 |
| 12 |
133.1 |
138.2 |
143.3 |
148.3 |
153.4 |
158.4 |
163.4 |
| 12.5 |
135.6 |
140.9 |
146.2 |
151.5 |
156.7 |
161.8 |
167.0 |
| 13 |
138.5 |
144.0 |
149.4 |
154.8 |
160.1 |
165.4 |
170.6 |
| 13.5 |
141.7 |
147.3 |
152.8 |
158.2 |
163.6 |
168.9 |
174.1 |
| 14 |
145.1 |
150.6 |
156.0 |
161.4 |
166.7 |
171.9 |
177.0 |
| 14.5 |
148.2 |
153.6 |
158.9 |
164.1 |
169.2 |
174.2 |
179.1 |
| 15 |
150.8 |
156.0 |
161.1 |
166.1 |
171.0 |
175.8 |
180.6 |
| 15.5 |
152.8 |
157.8 |
162.7 |
167.5 |
172.3 |
176.9 |
181.5 |
| 16 |
154.1 |
159.0 |
163.8 |
168.5 |
173.1 |
177.7 |
182.1 |
| 16.5 |
155.1 |
159.9 |
164.6 |
169.2 |
173.7 |
178.2 |
182.6 |
| 17 |
155.8 |
160.5 |
165.1 |
169.7 |
174.2 |
178.5 |
182.9 |
| 17.5 |
156.3 |
160.9 |
165.5 |
170.0 |
174.5 |
178.8 |
183.1 |
| 18 |
156.7 |
161.3 |
165.9 |
170.4 |
174.7 |
179.0 |
183.3 |
Table II


Height Percentiles for Indian Girls
| Age (y) |
3 |
10 |
25 |
50 |
75 |
90 |
97 |
| 5 |
97.2 |
100.4 |
103.7 |
107.0 |
110.3 |
113.7 |
117.1 |
| 5.5 |
100.0 |
103.3 |
106.7 |
110.1 |
113.5 |
117.0 |
120.5 |
| 6 |
102.7 |
106.1 |
109.6 |
113.1 |
116.7 |
120.2 |
123.9 |
| 6.5 |
105.3 |
108.9 |
112.5 |
116.1 |
119.7 |
123.5 |
127.2 |
| 7 |
107.8 |
111.5 |
115.2 |
119.0 |
122.8 |
126.7 |
130.6 |
| 7.5 |
110.5 |
114.3 |
118.3 |
122.2 |
126.2 |
130.2 |
134.3 |
| 8 |
113.1 |
117.1 |
121.2 |
125.4 |
129.5 |
133.7 |
138.0 |
| 8.5 |
115.5 |
119.7 |
124.0 |
128.3 |
132.6 |
137.0 |
141.3 |
| 9 |
117.9 |
122.3 |
126.7 |
131.2 |
135.6 |
140.1 |
144.6 |
| 9.5 |
120.4 |
125.0 |
129.5 |
134.1 |
138.7 |
143.3 |
148.0 |
| 10 |
123.1 |
127.7 |
132.4 |
137.1 |
141.8 |
146.5 |
151.2 |
| 10.5 |
125.9 |
130.6 |
135.4 |
140.1 |
144.9 |
149.6 |
154.4 |
| 11 |
129.1 |
133.8 |
138.5 |
143.2 |
148.0 |
152.7 |
157.5 |
| 11.5 |
132.6 |
137.2 |
141.8 |
146.4 |
151.1 |
155.8 |
160.5 |
| 12 |
135.7 |
140.1 |
144.6 |
149.1 |
153.7 |
158.3 |
163.0 |
| 12.5 |
138.3 |
142.6 |
146.9 |
151.3 |
155.8 |
160.3 |
165.0 |
| 13 |
140.3 |
144.4 |
148.7 |
153.0 |
157.4 |
161.9 |
166.5 |
| 13.5 |
141.8 |
145.9 |
150.0 |
154.3 |
158.6 |
163.0 |
167.6 |
| 14 |
143.0 |
147.0 |
151.0 |
155.2 |
159.5 |
164.0 |
168.5 |
| 14.5 |
143.8 |
147.7 |
151.8 |
155.9 |
160.2 |
164.6 |
169.1 |
| 15 |
144.3 |
148.2 |
152.2 |
156.3 |
160.6 |
165.0 |
169.5 |
| 15.5 |
144.6 |
148.5 |
152.5 |
156.6 |
160.9 |
165.2 |
169.8 |
| 16 |
144.8 |
148.6 |
152.6 |
156.8 |
161.0 |
165.4 |
169.9 |
| 16.5 |
144.9 |
148.7 |
152.7 |
156.8 |
161.1 |
165.5 |
170.0 |
| 17 |
144.9 |
148.8 |
152.8 |
156.9 |
161.1 |
165.5 |
170.0 |
| 17.5 |
145.1 |
149.0 |
153.0 |
157.1 |
161.3 |
165.7 |
170.2 |
| 18 |
145.4 |
149.2 |
153.2 |
157.3 |
161.5 |
165.9 |
170.4 |
Table III


Weight Percentiles for Indian Boys
| Age (y) |
3 |
10 |
25 |
50 |
75 |
90 |
97 |
| 5 |
12.9 |
14.0 |
15.4 |
17.1 |
19.2 |
22.0 |
26.1 |
| 5.5 |
13.8 |
15.0 |
16.5 |
18.4 |
20.8 |
24.1 |
28.6 |
| 6 |
14.7 |
16.0 |
17.7 |
19.8 |
22.5 |
26.1 |
31.3 |
| 6.5 |
15.5 |
17.0 |
18.8 |
21.1 |
24.1 |
28.2 |
33.9 |
| 7 |
16.2 |
17.9 |
19.9 |
22.5 |
25.8 |
30.3 |
36.6 |
| 7.5 |
17.0 |
18.8 |
21.1 |
23.9 |
27.5 |
32.4 |
39.4 |
| 8 |
17.9 |
19.9 |
22.3 |
25.4 |
29.4 |
34.9 |
42.5 |
| 8.5 |
18.7 |
20.9 |
23.6 |
27.0 |
31.5 |
37.4 |
45.8 |
| 9 |
19.5 |
21.9 |
24.9 |
28.6 |
33.4 |
39.9 |
48.8 |
| 9.5 |
20.3 |
22.9 |
26.1 |
30.1 |
35.3 |
42.2 |
51.8 |
| 10 |
21.1 |
23.9 |
27.3 |
31.7 |
37.3 |
44.7 |
54.8 |
| 10.5 |
21.9 |
25.0 |
28.8 |
33.5 |
39.5 |
47.4 |
57.9 |
| 11 |
22.9 |
26.3 |
30.4 |
35.6 |
42.1 |
50.4 |
61.4 |
| 11.5 |
24.2 |
27.9 |
32.4 |
38.0 |
45.0 |
53.8 |
65.3 |
| 12 |
25.5 |
29.5 |
34.4 |
40.5 |
47.9 |
57.2 |
69.1 |
| 12.5 |
26.9 |
31.3 |
36.6 |
43.0 |
50.9 |
60.6 |
72.8 |
| 13 |
28.5 |
33.2 |
38.8 |
45.6 |
53.8 |
64.0 |
76.5 |
| 13.5 |
30.3 |
35.2 |
41.0 |
48.1 |
56.7 |
67.2 |
80.2 |
| 14 |
32.2 |
37.2 |
43.3 |
50.6 |
59.4 |
70.2 |
83.6 |
| 14.5 |
34.1 |
39.2 |
45.4 |
52.8 |
61.8 |
73.0 |
86.8 |
| 15 |
35.8 |
41.0 |
47.2 |
54.7 |
63.9 |
75.3 |
89.4 |
| 15.5 |
37.3 |
42.5 |
48.8 |
56.3 |
65.6 |
77.1 |
91.6 |
| 16 |
38.6 |
43.8 |
50.1 |
57.7 |
67.0 |
78.7 |
93.4 |
| 16.5 |
39.7 |
44.9 |
51.2 |
58.8 |
68.2 |
79.9 |
94.9 |
| 17 |
40.7 |
45.9 |
52.1 |
59.8 |
69.2 |
81.0 |
96.2 |
| 17.5 |
41.6 |
46.8 |
53.1 |
60.7 |
70.1 |
82.0 |
97.3 |
| 18 |
42.5 |
47.7 |
53.9 |
61.5 |
71.0 |
82.9 |
98.3 |
Table IV


Weight Percentiles for Indian Girls
| Age (y) |
3 |
10 |
25 |
50 |
75 |
90 |
97 |
| 5 |
12.4 |
13.4 |
14.7 |
16.3 |
18.3 |
20.9 |
24.7 |
| 5.5 |
13.1 |
14.2 |
15.6 |
17.3 |
19.5 |
22.5 |
26.7 |
| 6 |
13.8 |
15.0 |
16.6 |
18.5 |
21.0 |
24.3 |
29.0 |
| 6.5 |
14.6 |
16.0 |
17.7 |
19.9 |
22.7 |
26.4 |
31.7 |
| 7 |
15.3 |
16.9 |
18.9 |
21.3 |
24.4 |
28.6 |
34.4 |
| 7.5 |
16.1 |
17.9 |
20.1 |
22.8 |
26.3 |
31.0 |
37.5 |
| 8 |
16.9 |
18.9 |
21.4 |
24.4 |
28.3 |
33.5 |
40.7 |
| 8.5 |
17.7 |
19.9 |
22.7 |
26.1 |
30.4 |
36.1 |
43.8 |
| 9 |
18.6 |
21.0 |
24.1 |
27.8 |
32.6 |
38.8 |
47.0 |
| 9.5 |
19.4 |
22.2 |
25.6 |
29.7 |
34.9 |
41.5 |
50.1 |
| 10 |
20.4 |
23.5 |
27.2 |
31.7 |
37.3 |
44.4 |
53.3 |
| 10.5 |
21.5 |
24.9 |
28.9 |
33.9 |
39.9 |
47.3 |
56.5 |
| 11 |
22.9 |
26.6 |
31.0 |
36.3 |
42.7 |
50.5 |
59.9 |
| 11.5 |
24.6 |
28.5 |
33.2 |
38.8 |
45.5 |
53.7 |
63.6 |
| 12 |
26.3 |
30.4 |
35.3 |
41.1 |
48.1 |
56.6 |
67.0 |
| 12.5 |
28.1 |
32.2 |
37.2 |
43.1 |
50.3 |
59.2 |
70.1 |
| 13 |
29.8 |
33.9 |
38.9 |
44.9 |
52.3 |
61.4 |
72.7 |
| 13.5 |
31.3 |
35.5 |
40.4 |
46.4 |
53.9 |
63.2 |
75.0 |
| 14 |
32.7 |
36.8 |
41.7 |
47.7 |
55.2 |
64.7 |
76.9 |
| 14.5 |
33.8 |
37.8 |
42.7 |
48.7 |
56.2 |
65.8 |
78.4 |
| 15 |
34.6 |
38.6 |
43.4 |
49.4 |
56.9 |
66.6 |
79.4 |
| 15.5 |
35.1 |
39.1 |
43.9 |
49.9 |
57.4 |
67.1 |
80.1 |
| 16 |
35.6 |
39.5 |
44.4 |
50.3 |
57.8 |
67.6 |
80.7 |
| 16.5 |
36.0 |
40.0 |
44.8 |
50.7 |
58.2 |
68.1 |
81.3 |
| 17 |
36.4 |
40.3 |
45.1 |
51.1 |
58.6 |
68.5 |
81.8 |
| 17.5 |
36.8 |
40.7 |
45.5 |
51.4 |
58.9 |
68.8 |
82.3 |
| 18 |
37.0 |
41.0 |
45.7 |
51.7 |
59.2 |
69.1 |
82.6 |
Figures
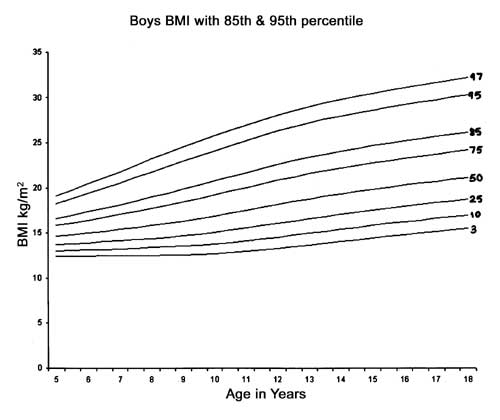
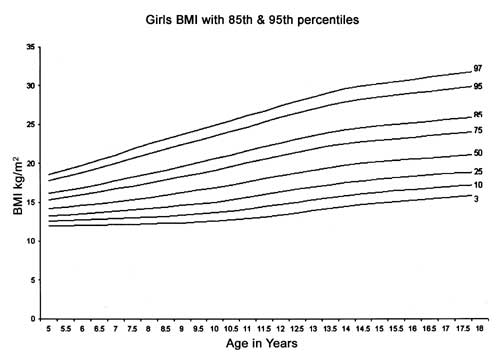
5, 6 and Table V, VI
show the BMI percentiles for Indian boys and girls including the 75th,
85th and 95th percentiles. The gap between the 3rd and 97th percentiles
was wider indicating much greater variability.
 |
|
Fig. 5 Reference curves for BMI for Indian
boys 2007 using the 3rd, 10th, 25th, 50th, 75th, 85th and 95th
percentiles. 75th centile is suggested as cut-off . |
 |
|
Fig. 6 Reference curves for BMI for Indian
girls using the 3rd, 10th, 25th, 50th, 75th, 85th and 95th
percentiles. 75th centile is suggested as cut-off. |
Table V


BMI Percentiles for Indian Boys
| Age (y) |
3 |
10 |
25 |
50 |
75 |
85 |
95 |
| 5 |
12.4 |
13.0 |
13.7 |
14.6 |
15.8 |
16.6 |
18.3 |
| 5.5 |
12.4 |
13.1 |
13.8 |
14.8 |
16.1 |
17.0 |
18.8 |
| 6 |
12.5 |
13.1 |
13.9 |
15.0 |
16.4 |
17.3 |
19.4 |
| 6.5 |
12.5 |
13.2 |
14.0 |
15.2 |
16.7 |
17.7 |
20.0 |
| 7 |
12.5 |
13.2 |
14.1 |
15.4 |
17.0 |
18.1 |
20.6 |
| 7.5 |
12.5 |
13.3 |
14.3 |
15.6 |
17.4 |
18.5 |
21.2 |
| 8 |
12.5 |
13.4 |
14.4 |
15.8 |
17.7 |
19.0 |
21.8 |
| 8.5 |
12.6 |
13.5 |
14.6 |
16.1 |
18.1 |
19.4 |
22.4 |
| 9 |
12.6 |
13.6 |
14.7 |
16.3 |
18.4 |
19.9 |
23.0 |
| 9.5 |
12.7 |
13.7 |
14.9 |
16.6 |
18.8 |
20.3 |
23.6 |
| 10 |
12.7 |
13.8 |
15.1 |
16.9 |
19.2 |
20.8 |
24.1 |
| 10.5 |
12.8 |
14.0 |
15.3 |
17.2 |
19.6 |
21.2 |
24.7 |
| 11 |
13.0 |
14.1 |
15.6 |
17.5 |
20.0 |
21.7 |
25.3 |
| 11.5 |
13.1 |
14.3 |
15.8 |
17.8 |
20.4 |
22.2 |
25.8 |
| 12 |
13.3 |
14.6 |
16.1 |
18.2 |
20.8 |
22.6 |
26.3 |
| 12.5 |
13.5 |
14.8 |
16.3 |
18.5 |
21.2 |
23.0 |
26.8 |
| 13 |
13.7 |
15.0 |
16.6 |
18.8 |
21.6 |
23.4 |
27.2 |
| 13.5 |
13.8 |
15.2 |
16.8 |
19.1 |
21.9 |
23.8 |
27.6 |
| 14 |
14.0 |
15.4 |
17.1 |
19.3 |
22.2 |
24.1 |
28.0 |
| 14.5 |
14.2 |
15.6 |
17.3 |
19.6 |
22.5 |
24.4 |
28.3 |
| 15 |
14.4 |
15.8 |
17.5 |
19.8 |
22.7 |
24.7 |
28.6 |
| 15.5 |
14.6 |
16.0 |
17.7 |
20.1 |
23.0 |
24.9 |
28.9 |
| 16 |
14.8 |
16.2 |
18.0 |
20.3 |
23.3 |
25.2 |
29.2 |
| 16.5 |
15.0 |
16.4 |
18.2 |
20.5 |
23.5 |
25.4 |
29.5 |
| 17 |
15.2 |
16.6 |
18.4 |
20.7 |
23.7 |
25.7 |
29.8 |
| 17.5 |
15.4 |
16.8 |
18.6 |
20.9 |
23.9 |
25.9 |
30.0 |
| 18 |
15.5 |
17.0 |
18.7 |
21.1 |
24.2 |
26.2 |
30.3 |
Table VI


BMI Percentiles for Indian Girls
| Age (y) |
3 |
10 |
25 |
50 |
75 |
85 |
95 |
| 5 |
11.9 |
12.5 |
13.2 |
14.2 |
15.4 |
16.1 |
17.8 |
| 5.5 |
12.0 |
12.6 |
13.4 |
14.4 |
15.7 |
16.5 |
18.3 |
| 6 |
12.0 |
12.7 |
13.5 |
14.6 |
16.0 |
16.9 |
18.8 |
| 6.5 |
12.1 |
12.8 |
13.7 |
14.8 |
16.3 |
17.3 |
19.4 |
| 7 |
12.1 |
12.9 |
13.8 |
15.1 |
16.7 |
17.8 |
20.0 |
| 7.5 |
12.2 |
13.0 |
14.0 |
15.3 |
17.1 |
18.2 |
20.6 |
| 8 |
12.2 |
13.1 |
14.2 |
15.6 |
17.5 |
18.7 |
21.2 |
| 8.5 |
12.3 |
13.2 |
14.4 |
15.9 |
17.9 |
19.1 |
21.8 |
| 9 |
12.3 |
13.3 |
14.6 |
16.2 |
18.3 |
19.6 |
22.4 |
| 9.5 |
12.4 |
13.5 |
14.8 |
16.5 |
18.7 |
20.1 |
23.0 |
| 10 |
12.5 |
13.7 |
15.0 |
16.9 |
19.1 |
20.6 |
23.5 |
| 10.5 |
12.7 |
13.9 |
15.3 |
17.2 |
19.6 |
21.1 |
24.1 |
| 11 |
12.9 |
14.1 |
15.6 |
17.6 |
20.1 |
21.6 |
24.7 |
| 11.5 |
13.1 |
14.4 |
15.9 |
18.0 |
20.5 |
22.1 |
25.3 |
| 12 |
13.4 |
14.7 |
16.3 |
18.4 |
21.0 |
22.6 |
25.9 |
| 12.5 |
13.6 |
15.0 |
16.6 |
18.8 |
21.4 |
23.1 |
26.5 |
| 13 |
13.9 |
15.3 |
16.9 |
19.1 |
21.8 |
23.6 |
27.0 |
| 13.5 |
14.2 |
15.6 |
17.2 |
19.5 |
22.2 |
24.0 |
27.5 |
| 14 |
14.4 |
15.8 |
17.5 |
19.7 |
22.5 |
24.3 |
27.9 |
| 14.5 |
14.7 |
16.1 |
17.7 |
20.0 |
22.8 |
24.6 |
28.3 |
| 15 |
14.9 |
16.3 |
17.9 |
20.2 |
23.0 |
24.8 |
28.5 |
| 15.5 |
15.1 |
16.4 |
18.1 |
20.3 |
23.2 |
25.0 |
28.8 |
| 16 |
15.2 |
16.6 |
18.2 |
20.5 |
23.3 |
25.2 |
29.0 |
| 16.5 |
15.4 |
16.8 |
18.4 |
20.6 |
23.5 |
25.3 |
29.2 |
| 17 |
15.6 |
16.9 |
18.6 |
20.8 |
23.7 |
25.5 |
29.5 |
| 17.5 |
15.7 |
17.1 |
18.7 |
21.0 |
23.8 |
25.7 |
29.7 |
| 18 |
15.9 |
17.2 |
18.9 |
21.1 |
24.0 |
25.9 |
29.9 |
Comparison of 2007 and 1989 Data
Table VII shows the comparison between 2007 and
1989 data for height, weight and BMI for boys and girls. The 50th
percentile for boy’s height was greater than that of the 1989 data at all
ages. The 97th percentile at 18 years was 1.7 cm greater than in 1989. The
50th percentile for girls’ height was greater than in 1989 at most ages,
the greatest difference being 3.1 cm at 12 years. The median final height
was similar to 1989, but the 97th percentile was 2.4 cm greater,
indicating increased variability.
The 50th percentile for boys’ weight was greater than
in 1989 at all ages except 5 years, maximum 6.5 kg at 14 years reducing to
2.9 kg at 18 years. At 18 years the 97th percentile was 14.7 kg, higher
than in 1989. The 50th percentile for girls weight was lower than the 1989
percentiles up to 6.5 years and higher afterwards, maximum 8.0 kg at 17
years. Unlike in boys, there was no reduction in difference in weight
approaching adulthood. Compared with the 1989 data, average difference in
the 97th percentile was similar to the 50th percentile (6.8 kg and 4.7 kg,
respectively) which was in stark contrast to the data on boys, where the
difference was much greater (12.8 kg and 4.1 kg, respectively).
In boys, the median BMI values were higher at almost
all ages compared with the 1989 data. The difference in the 95th
percentile in the two datasets was 2.3 at 18 years. In girls the median
BMI values were higher at almost all ages, the maximum difference being
1.1 kg/m2 at 18 years.
Discussion
Cross sectional reference percentiles curves based on
data collected in 2007-2008 for height, weight and body mass index for
affluent urban Indian boys and girls age 5-18 years are presented. As
compared to the 1989 data, boys and girls were taller at a younger age.
The increment in the 97th height percentile since 1989 (1.7 cm in boys and
2 cm in girls) is similar to that observed in Britain from 1965 to 1990, a
time gap of 25 years as against 18 years in the present study (5). Secular
trend in height is therefore observed in Indian children, although it is
not very marked.
On comparison with the 1989 data, boys and girls were
also heavier at all ages. The 97th percentile for boys’ weight was much
higher suggesting that boys are getting heavier, especially in the upper
percentiles. Since the 3rd percentile in boys was comparable to the 1989
data, it suggests that the gap between the obese and thin boys is growing,
and the whole population has not moved up. This effect was less marked in
girls, with the 3rd percentile also moving upwards with increasing age.
Our study thus confirms the alarming trend of increased childhood obesity
in urban upper socioeconomic class children shown by several studies in
recent years(21-23).
Various authors have argued that the growth of children
of higher socioeconomic status is similar throughout the world,
irrespective of ethnic back-ground(24,25). Environmental rather
than genetic differences are believed to be the principal determinants of
disparities in physical growth(26). Hence, in developing countries, it is
important to use unified curves based on subjects with minimum nutritional
constraints and full access to health care(12,13), as applies to the
affluent Indian children studied here. These data, thus, reflect true
height potential and the new curves for height of boys and girls may,
therefore, be considered as a standard(14).
It is now well recognized that there is a global
epidemic of obesity affecting all ages(27). As per the recommendations of
the IAP National Task Force for Childhood Prevention of Adult Diseases,
all Indian children >10 years of age are to be considered to be
overweight if BMI >85th percentile for age or weight >120% of the 50th
percentile weight for height by National standards(28). The other approach
recom-mended is the one suggested by the ITFO definition for overweight
and obesity worldwide(29). However, in the present study, 85th and 95th
percentile values for BMI at 18 years are above 25 and 30, respectively,
suggesting that if we use 85th and 95th percentiles as cut-offs for
defining overweight and obese using current data, we are accepting higher
BMI (overweight children) as "normal" at all ages. On comparison with the
US (NCHS 2000) and UK (1990) data, the 75th percentile for the current
data was very close to the US and UK 85th percentile on BMI charts,
especially after 7 years in boys and 9 years in girls. Boys on the 75th
percentile in our study had a mean BMI of 24.2 and girls had a mean BMI of
24 at 18 years, this value is just under the adult cut-off for
overweight(29).Thus the weight and BMI curves published in this paper may
be considered as a reference and are not proposed as standards. The
authors, thus, suggest that the 75th percentile value on the current BMI
curves may be used as a cutoff for screening for overweight boys and
girls. However, it is important to keep in mind that BMI is a screening
test (whatever statistical cut-off points are chosen) and must be followed
by a more detailed evaluation to assess risk and plan intervention(30).
Given the fact that India is a large country with a
diverse genetic pool, there is the question whether regional charts should
be constructed(31). Thus, to assess inter-regional differences, we used
the method suggested by the WHO MGRS (standardized site effects) and found
that there were no significant differences in height and weight(14). Also,
regional charts would be very difficult to use in case of intermarriages
and at a time when inter-regional migrations are very prevalent in India.
The LMS method was used for analysis as this is the most widely accepted
method for percentile construc-tion(3,5,32,33). It also allows the
calculation of Z-scores, which are useful in population-based
research and surveillance to provide summary statistics (The LMS values
needed to calculate Z-scores are available on request).
This study has some drawbacks. It was a cross sectional
study and so provides no information on longitudinal growth. Tanner
staging was not performed as the authors considered it ethically
incorrect, and reference may be made to other publications(34). The
measurement scales used in this study were different to those used by
Agarwal, et al. Though an attempt was made to study equal numbers
of children in all the IAP zones, the numbers in the five zones still
differ, however the differences in heights and weights have been shown to
be statistically insignificant as per weighted analysis. The sample does
not include affluent children from small towns and rural areas as it was
logistically not possible to do so.
Acknowledgments
Our sincere thanks to HCJMRI and Eli Lilly India for
funding this study.
Participating Investigators: Sanwar Agrawal,
Director, Ekta Institute of Child Health, Raipur; Archana Dayal Arya,
Consultant Pediatric Endocrinologist, Sir Ganga Ram Hospital, New Delhi;
Anil Bhansali, Prof. and Head, Department of Endocrinology, PGIMER,
Chandigarh; Shaila Bhattacharya, Consultant Pediatric
Endocrinologist, Manipal Hospital, Bangalore; Rajesh Chokhani,
Consultant Pediatrician, Health care for children, Mumbai; Subhankar
Chowdhury, Head of Dept of Endocrinology and Metabolism, IPGMER and
SSKM Hospital, Kolkata; Vaishali Ghelani Consultant Pediatrician,
Girgaon, Mumbai; Jayashree Gopal, Senior Consultant Endocrinologist
and Diabetologist, Apollo Hospitals, Chennai; Jayanthy Ramesh,
Consultant Pediatric Endocrinologist, Hyderabad; Mona Shah,
Consultant Endocrinologist, Baroda.
Contributors: Study was planned by AVK, VVK, TJC
and MGS. AVK organized the data collection. Data were analyzed and the
manuscript was prepared by all authors. VVK will act as guarantor of the
study.
Funding: Eli Lilly India and the HCJMRI Jehangir
Hospital, Pune.
Competing interests: None stated.
|
What is Already Known?
• Previous Nationally representative growth
curves were created from data collected between 1989-1991.
What This Study Adds?
• Growth curves are provided for Indian children
from data collected in 2007-2008 using LMS method which provides
smoothened percentile reference curves. |
References
1. Buckler JMH. Growth disorders in Children. 1st ed.
London: BMJ Publishing Group; 1994.
2. Hamill PV, Drizd TA, Johnson CL, Reed RB, Roche AF.
NCHS growth curves for children birth-18 years, United States. Vital
Health Stat 1977; 11: 1-74.
3. Kuczmarski RJ, Ogden CL, Guo SS, Grummer-Strawn LM,
Flegal KM, Mei Z, et al. 2000 CDC Growth Charts for the United
States: methods and development. Vital Health Stat 2002; 246: 1-190.
4. Tanner JM, Whitehouse RH, Takaishi M. Standards from
birth to maturity for height, weight, height velocity, and weight
velocity: British children, 1965. Arch Dis Child 1966; 41: 454-471.
5. Freeman JV, Cole TJ, Chinn S, Jones PR, White EM,
Preece MA. Cross sectional stature and weight reference curves for the UK,
1990. Arch Dis Child 199l; 73: 17-24.
6. Li H, Leung SS, Lam PK, Zhang X, Chen XX, Wang SL.
Height and weight percentile curves of Beijing children and adolescents
0-18 years, 1995. Ann Hum Biol 1999; 26: 457-471.
7. Leung SS, Lau JT, Tse LY, Oppenheimer SJ.
Weight-for-age and weight-for-height references for Hong Kong children
from birth to 18 years. J Paediatr Child Health 1996; 32: 103-109.
8. Rao S. Nutritional status of the Indian population.
J Biosci 2001; 26: 481-489.
9. Agarwal DK, Agarwal KN, Upadhyay SK, Mittal R,
Prakash R, Rai S. Physical and sexual growth pattern of affluent Indian
children from 5-18 years of age. Indian Pediatr 1992; 29: 1203-1282.
10. Agarwal DK, Agarwal KN. Physical growth in Indian
affluent children (Birth – 6 years). Indian Pediatr 1994; 31: 377-413.
11. Khadilkar VV, Khadilkar AV, Choudhury P, Agarwal KN,
Ugra D, Shah NK. IAP growth monitoring guidelines for children from birth
to 18 years. Indian Pediatr 2007; 44: 187-197.
12. Bhandari N, Bahl R, Taneja S, de Onis M, Bhan MK.
Growth performance of affluent Indian children is similar to that in
developed countries. Bull World Health Organ 2002; 80: 189-195.
13. Agarwal KN, Agarwal DK, Benkappa DG, Gupta PC,
Khatua SP. Growth performance of affluent Indian children (under fives).
New Delhi: Nutrition Foundation of India; 1991.
14. WHO Multicentre Growth Reference Study Group.
Assessment of differences in linear growth among populations in the WHO
Multicentre Growth Reference Study. Acta Paediatr Suppl 2006; 450: 56-65.
15. Ministry of Urban Development (Lands Division),
Government of India. Letter No. J-220 11/1/91-LD.
16. Press Information Bureau Government of India (based
on press note advance estimates of national income, 2007-08 on 7 February,
2008). Available from URL: http://pib.nic.in/archieve/others/2007/feb07/r2007020702.pdf.
Accessed on 30 Nov, 2008.
17. Cole TJ, Freeman JV, Preece MA. British 1990 Growth
reference centiles for weight, height, body mass index and head
circumference fitted by maximum penalized likelihood. Stat Med 1998; 17:
407-429.
18. Van’t Hof MA, Wit JM, Roede MJ. A method to
construct age references for skewed skinfold data, using Box-Cox
transformations to normality. Hum Biol 1985; 57: 131-139.
19. Cole TJ, Green PJ. Smoothing reference centile
curves: the LMS method and penalized likelihood. Stat Med 1992; 11:
1305-1319.
20. Van Buuren S, Fredriks, M. Worm plot: a simple
diagnostic device for modeling growth reference curves. Stat Med 2001; 20,
1259-1277.
21. Kaur S, Kapil U. Prevalence of overweight and
obesity in school children in Delhi. Indian Pediatr 2008; 45: 330-331.
22. Khadilkar VV, Khadilkar AV. Prevalence of obesity
in affluent school boys in Pune. Indian Pediatr 2004; 41: 857-858.
23. Agarwal T, Bhatia RC, Singh D, Sobti PC. Prevalence
of obesity and overweight in affluent adolescents from Ludhiana, Punjab.
Indian Pediatr 2008; 45: 500-552.
24. Graitcer PL, Gentry EM. Measuring children: One
reference for all. Lancet 1981; 2: 297–299.
25. Habicht JP, Martorell R, Yarbrough C, Malina RM,
Klein RE. Height and weight standards for preschool children: How relevant
are ethnic differences in growth potential? Lancet 1974; 1: 611–615.
26. Garza C, de Onis M. Rationale for developing a new
international growth reference. Food Nutr Bull 2004; 25: S5-14.
27. Sokol RJ. The chronic disease of childhood obesity:
the sleeping giant has awakened. J Pediatr 2000; 136: 711–713.
28. Bhatia V. IAP National Task Force for Childhood
Prevention of Adult Diseases. IAP National Task Force for Childhood
Prevention of Adult Diseases: insulin resistance and Type 2 diabetes
mellitus in childhood. Indian Pediatr 2004; 41: 443 -457.
29. International Obesity Task Force. Obesity:
preventing and managing the global epidemic. Report of WHO consultation on
obesity, Geneva, 3-5 June 1998. Geneva: WHO; 1998.
30. Hall DMB, Cole TJ. What use is the BMI? Arch Dis
Child 2006; 91: 283-286.
31. Thakor HG, Kumar P, Desai VK, Srivastava RK.
Physical growth standards for urban adolescents (10-15 Years) from South
Gujarat. Indian J Comm Med 2000; 25: 4-6.
32. Davies P. Growth charts for use in Australia. J
Paediatr Child Health 2007; 43: 4-5.
33. Fenton TR, Sauve RS. Using the LMS method to
calculate z-scores for the Fenton preterm infant growth chart. Eur J Clin
Nutr 2007; 61: 1380-1385.
34. Agarwal KN, Saxena A, Bansal AK, Agarwal DK. Physical growth
assessment in adolescence. Indian Pediatr 2001; 38: 1217-1235.
|
|
|
 |
|