|
|
|
Indian Pediatr 2018;55: 561-567 |
 |
Study of Family Clustering and PNPLA3
Gene Polymorphism in Pediatric Non Alcoholic Fatty Liver Disease
|
|
Vikrant Sood 1,
Rajeev Khanna1,
Dinesh Rawat1,
Shvetank Sharma2,
Seema Alam1 and
Shiv Kumar Sarin3
From Departments of 1Pediatric Hepatology,
2Molecular and Cellular Medicine, and 3Hepatology;
Institute of Liver and Biliary Sciences, Vasant Kunj, New Delhi, India
Correspondence to: Dr Seema Alam, Professor and Head,
Department of Pediatric Hepatology, Institute of Liver and Biliary
Sciences, D-1, Vasant Kunj, New Delhi 110 070, India.
Email: [email protected]
Received: June 13, 2017;
Initial review: December 26, 2017;
Accepted: April 06, 2018.
|
|
Objectives: To find association of pediatric NAFLD with metabolic
risk factors, and Patatin-like phospholipase domain-containing
protein 3 (PNPLA3) gene polymorphism.
Design: Cross-sectional study
Setting: Pediatric Hepatology
unit of a tertiary care hospital
Participants: Overweight/obese
children (<18 years) with (69 patients) or without (30 patients) NAFLD (ultrasonography
based), and their parents.
Intervention: Metabolic
screening, PNPLA3 gene polymorphism, and transient elastography
Outcome measure: Association of
pediatric NAFLD with parental metabolic risk factors and PNPLA3
gene polymorphism.
Results: In the NAFLD group,
there was high parental incidence of metabolic diseases, fatty liver
(80%) and low high-density lipoproteins levels (84%). Family history of
NAFLD (in any parent), higher alanine aminotransferase levels and higher
total cholesterol levels in the child independently predicted
possibility of NAFLD, but similar results could not be replicated for
PNPLA3 gene polymorphism. Controlled attenuation parameter
measurement (by transient elastography) had high sensitivity and
specificity to diagnose steatosis.
Conclusion: There is high
familial incidence of metabolic diseases in children with NAFLD.
Controlled attenuation parameter can be useful as a non-invasive
modality to screen fatty liver in children.
Keywords: Metabolic syndrome, Obesity, Transient Elastography.
|
|
N
onalcoholic fatty liver disease (NAFLD) is a
spectrum characterized by hepatic fat accumulation which ranges from
simple steatosis to non-alcoholic steatohepatitis (NASH) and cirrhosis
[1]. NAFLD is potentially one of the most common causes of liver disease
worldwide both in adults and children [2-4]. Considering its ever
increasing and epidemic proportions, its timely identification and
optimum management should be a priority in the present times [5].
It is established that NAFLD is multi-factorial with
a substantial genetic component. Familial and genetic factors (metabolic
syndrome and Patatin-like phospholipase domain-containing protein 3
or PNPLA3 gene polymorphism) are a major determinant of whether
an individual will have NAFLD or not [6-10]. Thus, children with family
history of NAFLD should be considered at high risk for NAFLD and vice
versa. Several studies have shown that single-nucleotide
polymorphisms (SNPs), especially in PNPLA3 gene (coding for a
protein adiponutrin which plays a role in hepatic triglyceride
hydrolysis) may influence hepatic steatosis and its progression in both
adult and pediatric populations [11-14]. Thus, this PNPLA3 gene
polymorphism could be used as a genetic marker for assessing risk of
early hepatic damage thus providing a window of opportunity to intervene
at a pre-symptomatic stage, especially in children with additive
familial risk factors.
Since no data on family clustering and PNPLA3
polymorphism in pediatric population is available from Indian
subcontinent, where metabolic risk factors are highly prevalent [15],
this study was planned with an aim to study parental metabolic disorders
and PNPLA3 polymorphism as possible risk factors for Pediatric
NAFLD in overweight/obese children.
Methods
This prospective observational study was undertaken
in the departments of Hepatology and Pediatric Hepatology in a tertiary
care institute. The study was approved by the Institutional Review
Board. The patients were enrolled after informed consent and assent was
obtained from the parent(s) and patients. The duration of the study was
from Ist October 2014 to 31 st
December 2016. Inclusion criteria included: (i) all
overweight/obese children (aged 8-18 years, overweight defined as a body
mass index or BMI ³85th percentile
to <95th percentile, and
obesity defined as a BMI ³95th
percentile, for children and teens of the same age and sex) and their
parents, and (ii) adults (along with their spouses) suffering
from diabetes mellitus (DM), obesity, dyslipidemia, metabolic syndrome
or NAFLD having overweight/obese progeny (aged 8-18 years). Exclusion
criteria included (i) history suggestive of acute hepatitis in
last 6 months, (ii) abnormal thyroid profile, (iii) Wilson
disease (³1 of
following- low ceruloplasmin/increased urinary copper/Kayser Fleischer
ring +ve), (iv) hepatitis B/C infection, (v) concomitant
liver diseases, (vi) severe malnutrition, (vii) ongoing
total parenteral nutrition/jejunal-ileal bypass, (viii) alcohol
intake of more than 20g/week, (ix) syndromic obesity, (x)
medication use like steroids, estrogens, Amiodarone, Methotrexate,
Tamoxifen and antitubercular therapy.
All patients (i.e., including atleast the
index child and both parents) underwent screening evaluation including
detailed family history, baseline evaluation – vitals, anthropometry
(body mass index, waist circumference, waist- hip ratio) and metabolic
screen (liver function tests, fasting lipid profile, fasting blood
sugar, serum insulin, and HbA1C), ultrasonography (USG) of abdomen,
PNPLA3 I148M polymorphism (nonsynonymous rs738409 SNP), transient
elastography (TE) (for liver stiffness measure-ment (LSM); and
controlled attenuation parameter (CAP) measurements for steatosis
assessment) and liver biopsy (in NAFLD children, as applicable) (Web
Annexure 1). Diagnosis of NAFLD was based on ultrasonography of
abdomen.
Detailed nutritional counseling was conducted in
consultation with trained nutritionist to target weight loss of 5-10 %.
Hobby development to burn calories in terms of any sports, whatever
preferred and available. An individualized diet chart and exercise
regimen (including sports and games) were prepared and explained to the
whole family. Healthy dietary habits including reduced intake of
saturated fats/fructose or sugar rich products and increased intake of
polyunsaturated fats and fibres was emphasized. Vitamin E capsules 400
IU once daily was prescribed if elevation of transaminases was
persistent despite adequate dietary compliance and weight loss after 3
months.
Statistical analysis: The mean differences
between the groups were tested by independent sample t-test. The chi
square (or Fisher’s exact) test was used to compare differences between
the groups for categorical variables. Variables affecting Family
Clustering were analyzed using univariate and multivariate analysis.
Data was analyzed by using SPSS 22 version. Probability of Y (Outcome,
for e.g, Pediatric NAFLD) is predicted by: Probability (Y) = 1/1
+ e – (b0 + b1X1 + b2X2...)
where P(Y) is the probability of Y occurring, e
is the base of natural logarithms, X1/X2/X3 etc are predictor
variables, bo/b1/b2 etc are Beta Coefficients [16].
Results
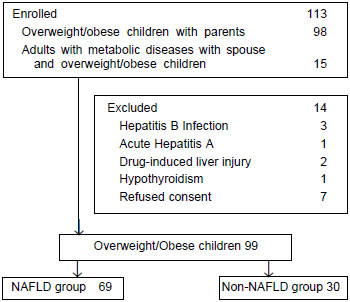
A total of 99 overweight and obese children were
included in the study, with 69 subjects in NAFLD group (Fig. 1).
In the NAFLD group, there were 59 boys (85.5%) with median age of 13.1
years, while in the non- NAFLD group, there were 21 boys (70%) with a
median age of 11.1 years. There was high incidence of metabolic diseases
in the families having children with NAFLD where more than 3/4 th
of the families had atleast one parent with either fatty liver (80%) or
low HDL levels (84 %). Similarly there was high incidence (>2/3rd
of families) of insulin resistance, hypertension
and high triglycerides in atleast one parent in the NAFLD group. In the
NAFLD group, homozygosity (GG status) and heterozygosity (CG
status) for PNPLA3 polymorphism was seen in 24 (34.8%) and 23
(33.3%) overweight/obese children respectively. In the non-NAFLD group,
only 1 subject had homozygous mutation, while heterozygous status was
found in 8 (26.7%).
 |
|
Fig. 1 Flowchart depicting patient
selection in the study. (*NAFLD diagnosis based on
ultrasonographic evidence of fatty liver).
|
Analysis of presence or absence of family history of
metabolic risk factors (NAFLD, hypertension, insulin resistance/IR, type
2 diabetes mellitus, dyslipidemia and presence of metabolic syndrome) in
the parents showed that presence of NAFLD in any one parent (OR 3.9, 95%
CI 1.5 to 10.6; P=0.008) or both parents (OR 6.7, 95 % CI 1.4 to
30.6; P=0.009) and presence of insulin resistance in any parent
(OR 3.6, 95 % CI 1.1 to 12.0; P= 0.009) or both parents (P=0.01)
was significantly associated with occurrence of NAFLD in the progeny
(Table I). Amongst the clinical parameters, presence of
acanthosis and higher mean BMI significantly differentiated NAFLD from
non- NAFLD group (Table II). In the laboratory features,
presence of higher mean serum aspartate aminotransferase (AST) levels,
higher mean serum alanine aminotransferase (ALT) levels, higher mean
uric acid levels, higher mean cholesterol levels, high mean fasting
insulin levels, higher Homeostasis model assessment of insulin
resistance-1 (HOMA-1) index, higher HOMA-2 index and lower Quantitative
insulin sensitivity check index (QUICKI), presence of insulin resistance
and presence of homozygosity of PNPLA3 polymorphism predicted
occurrence of fatty liver disease in children (Table II).
TABLE I Comparison of Demographic Features of the NAFLD versus Non-NAFLD Group
|
Parameter |
NAFLD group (n= 69) |
Non-NAFLD group (n= 30) |
Effect Size (95 % CI)# |
P value |
|
Age (y)* |
13.4 (2.9) |
12.2 (2.9) |
1.2 (- 5.2, 2.9) |
0.170 |
|
Males gender |
59 (85.5 %) |
21 (70 %) |
0.4 (0.1, 1.2) |
0.130 |
|
Family history (abdominal obesity) |
|
Any parent |
69 (100%) |
30 (100%) |
NC |
NC |
|
Both parents |
58 (86%) |
21 (70%) |
1.8 (0.6, 5.4) |
0.360 |
|
NAFLD |
|
Any parent
|
55 (79.7%) |
12 (40%) |
3.9 (1.5, 10.6) |
0.008 |
|
Both parents |
26 (37.7%) |
02 (6.7%) |
6.7 (1.4, 30.6) |
0.009 |
|
Hypertension |
|
Any parent
|
49 (71%) |
17 (56.7%) |
1.0 (0.4, 2.8) |
1.000 |
|
Both parents |
17 (24.6%) |
03 (10%) |
2.3 (0.6, 8.6) |
0.260 |
|
Insulin resistance |
|
Any parent |
45 (65.2%) |
08 (26.7%) |
3.6 (1.1, 12.0) |
0.009 |
|
Both parents |
15 (21.7%) |
0 |
NC |
0.010 |
|
Diabetes mellitus |
|
Any parent |
30 (43.5%) |
09 (30%) |
1.3 (0.5, 3.3) |
0.640 |
|
Both parents |
07 (10.1%) |
02 (6.7%) |
1.2 (0.2, 6.4) |
1.000 |
|
High triglycerides |
|
Any parent
|
43 (62.3%) |
15 (50%) |
0.9 (0.4, 2.6) |
1.000 |
|
Both parents |
12 (17.4%) |
01 (3.3%) |
4.8 (0.6, 39.4) |
0.170 |
|
Low HDL |
|
Any parent |
58 (84.1%) |
18 (60%) |
1.8 (0.6, 5.4)
|
0.360 |
|
Both parents |
28 (40.6%) |
07 (23.3%) |
1.7 (0.6, 4.5)
|
0.460 |
|
Metabolic syndrome |
|
Any parent |
36 (52.2%) |
14 (46.7%) |
0.8 (0.3, 2.0)
|
0.642 |
|
Both parents |
19 (27.5%) |
08 (26.7%) |
0.8 (0.3, 2.1) |
0.609 |
|
Values in Number (%) or *mean (SD); #Mean
Difference (95 % CI-Lower Limit,Upper Limit) for comparison of
means and OR (95% CI-Lower Limit,Upper Limit) for comparison of
proportions, NAFLD: Non-alcoholic fatty liver disease; NC: Not
computable, HDL: High Density Lipoprotein.
|
TABLE II Comparison of Clinical and Laboratory Features of NAFLD Versus Non-NAFLD Group
|
Parameter |
NAFLD group |
Non-NAFLD
|
|
(n=69) |
group (n=30) |
|
Weight (kg) |
65.6 (15.8) |
56.3 (20.7) |
|
BMI* (kg/m2) |
26.7 (3.6) |
24.5 (4.2) |
|
Waist circumference (WC, cm)
|
87.6 (8.6) |
85.1 (10.2) |
|
Waist/Hip ratio |
0.9 (0.05) |
0.9 (0.04) |
|
Obesity (BMI based) (%) |
58 |
53.3 |
|
Abdominal obesity (WC based) (%) |
78.3 |
83.3 |
|
Acanthosis* (%) |
52.2
|
13.3 |
|
Pre-hypertension (%) |
24.6 |
6.7 |
|
Hypertension (%) |
11.6 |
0
|
|
Serum AST* (IU/L) |
57.2 (48.9) |
34.2 (14.1) |
|
Serum ALT* (IU/L) |
89.1 (78.6) |
28.4 (8.4) |
|
Serum uric acid* (mg/dL)
|
5.7 (1.5) |
4.7 (0.95) |
|
Total cholesterol* (mg/dL)
|
162.9 (38.1) |
135.0 (35.7) |
|
Serum triglycerides (mg/dL) |
138.5 (43.3) |
136.3 (75.7) |
|
Serum HDL (mg/dL) |
36.3 (9.1) |
38.2 (10.7) |
|
FBS (mg/dL) |
92.9 (27.2) |
87.2 (7.2) |
|
Serum insulin* (mIU/mL) |
11.2 (5.3) |
7.9 (3.6) |
|
HOMA 1 Index* |
2.6 (1.5) |
1.7 (0.8) |
|
HOMA 2 Index* |
1.5 (0.7)
|
0.9 (0.3) |
|
QUICKI* |
0.3 (0.02) |
0.3 (0.012) |
|
IR (HOMA-1 >2.5)* (%) |
34.8 |
10 |
|
LSM (K Pa or Kilopascals) |
5.3 (1.6) |
4.9 (1.2) |
|
CAP (db/m)*
|
285.3 (26.6) |
225.3 (30.9) |
|
Homozygous PNPLA3 polymorphism* (%) |
34.8 |
3.3 |
|
Values in mean (SD) unless specified; *P<0.05; NAFLD:
Non-alcoholic fatty liver disease, BMI: Body mass index, ALT:
Alanine Aminotransferase; AST: Aspartate Aminotransferase; HDL:
High Density Lipoprotein; FBS: Fasting blood sugar; HOMA-IR:
Homeostasis model assessment of Insulin Resistance, LSM: Liver
stiffness measurement; CAP: Controlled attenuation parameter;
QUICKI: Quantitative insulin sensitivity check index; PNPLA3:
Patatin-like phospholipase 3. |
Only 11 of the total NAFLD group gave consent for
liver biopsy. The results showed simple steatosis in 5 and presence of
NASH (with NAS score ³5)
in 6 children. In the 6 patients with NASH, 1 patient had stage 3
fibrosis, 3 patients had stage 2 fibrosis while 2 patients showed stage
1 fibrosis. Due to limited number of subjects, no statistical analysis
could be performed.
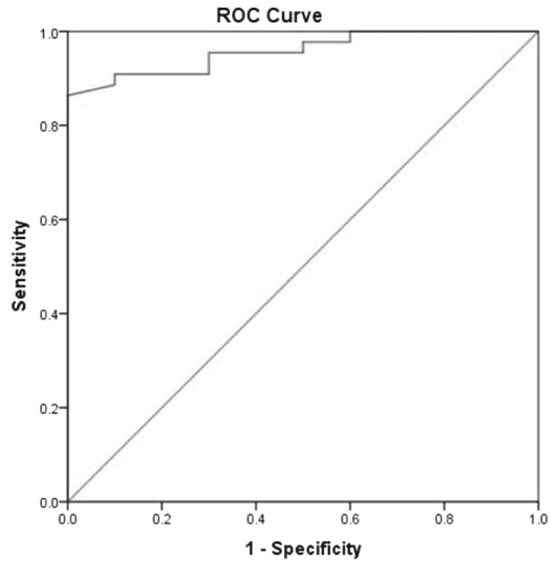
On comparing transient elastography features (LSM and
CAP), higher controlled attenuation parameter (CAP) values significantly
differentiated NAFLD from non NAFLD group while there was no significant
difference on LSM between two groups (Table II). At a
cut-off of 259.5 dB/m, CAP could predict presence of NAFLD in children
with 88.4 % sensitivity and 100 % specificity and AUROC of 0.965 (95 %
CI 0.931 to 1.000) (Fig. 2).
 |
|
Fig. 2 Receiver operating
characteristic (ROC) curve for Controlled Attenuation Parameter
(by transient elastography) for NAFLD prediction.
|
Multivariate binary logistic regression analysis
showed that family history of NAFLD (in any parent), higher ALT levels
and higher total cholesterol levels may independently predict presence
of NAFLD (Table III). Only ALT levels reached significance
on calculating area under receiver operating characteristic (AUROC)
curve, where in an overweight/obese child, ALT levels > 31.5 IU/L
predicted presence of NAFLD with 80.6% sensitivity and 60.9% specificity
with an AUROC of 0.825 (95 % CI 0.743 to 0.908).
TABLE III Results of Multivariate Analysis (NAFLD versus Non NAFLD)
|
Parameter |
P
|
Adj OR (95% CI)
|
|
*Family history of NAFLD |
0.004 |
18.81 (2.55, 138.94) |
|
Alanine aminotransferase |
0.014 |
1.08 (1.02, 1.15) |
|
Total cholesterol |
0.012 |
1.05 (1.01, 1.08) |
|
*(Any parent); NAFLD: Non-alcoholic fatty liver disease;
HDL-C: High Density Lipoprotein Cholesterol. |
Based on the logistic regression model of Pediatric
NAFLD in overweight/obese children, probability of developing Pediatric
NAFLD was derived by the equation: P (Y) = 1/1 + e
– [-7.088 + (2.935 × Family History
of NAFLD in any parent) + (0.075 × ALT) + (0.045 × Cholesterol)]
where ‘Family History of NAFLD in any parent’
is 0 or 1 when absent or present, respectively. The above equation leads
us to a probability of developing NAFLD in overweight/obese children as
92.4 % based on the sample data.
Discussion
In this study, we found that family history of NAFLD
(in any parent), higher ALT levels and higher total cholesterol levels
in children may independently predict presence of NAFLD. Homozygosity
for PNPLA3 polymorphism did not have an independent effect on
NAFLD causation. Also, CAP measurement by TE, had high sensitivity and
specificity to predict steatosis in children.
This study is limited by small sample size as well as
with lack of biopsy proven NAFLD in majority of the patients, since we
had based diagnosis of NAFLD on ultrasonography only. This was based on
the universal acceptance of USG as the first line screening modality for
pediatric NAFLD including parental preference, considering its
non-invasive nature.
There is limited literature stressing the
significance of familial clustering of NAFLD [6-10]. This study revealed
high familial incidence of metabolic diseases. Similar results were
found in another study [9], where fatty liver was present in 17% of
siblings and 37% of parents of non-NAFLD group against siblings (59%)
and parents (78%) of NAFLD (biopsy-proven) group [9]. Thus, children
with family history of NAFLD may be considered at higher risk for NAFLD.
Presence of insulin resistance and diabetes mellitus in first degree
relatives as a predictor of NAFLD was seen in another familial
aggregation analysis [8]. Thus, overweight/obese children with parental
history of NAFLD may constitute a high-risk group for early targeted
interventions to prevent future development of NAFLD.
rs738409 SNP in gene PNPLA3 is associated with
hepatic steatosis in adult and pediatric populations [11-14]. In the
present study, independent effect of homozygosity for PNPLA3
polymorphism on NAFLD causation could not be confirmed on logistic
regression analysis. This may be due to the fact that NAFLD is a
multifactorial disease, where environmental (dietary habits, physical
activity), genetic (PNPLA3 polymorphism) and metabolic risk
factors play a role in tandem to affect its causation. Thus, a single
risk factor like PNPLA3 polymorphism alone, may not affect the
NAFLD causation in an individual child.
Higher ALT levels and higher total cholesterol levels
also independently predicted pediatric NAFLD in the present study. In
the present study, each 10 unit increase in ALT (in IU/L) and each 20
unit increase in total cholesterol (in mg/dL) increased the risk of
pediatric NAFLD by approximately 1.5 times and 2 times, respectively. In
previous studies, serum ALT had been used as a screening tool for NAFLD
in children [17-20]. In the present study, 28.9 % children with NAFLD
had normal ALT values. We had used the adult cut off values ( ³40
IU/L) for defining normal ALT values to allow comparison with available
literature. If we use the proposed normal ‘pediatric’ ALT values (i.e
25.8 U/L in boys and 22.1 U/L in girls), frequency of abnormal ALT
increased from 71% to 88.4% (61 out of 69 children) [21]. Thus, though
ALT independently predicted NAFLD, this limitation highlights the
importance of not depending upon ALT alone to diagnose NAFLD since we
may miss upto 12-29 % children. Similarly, Schwimmer, et al. [22]
had also found that children with NAFLD had significantly higher serum
total cholesterol, fasting glucose, insulin, low density lipoprotein
(LDL), and triglycerides (TG) levels and significantly lower HDL than
those without NAFLD. Huang, et al. [23] had also shown that
higher body mass index (BMI) and ALT levels were significant independent
predictors of pediatric NAFLD.
Though the present study had limited histological
data, it still suggested that NAFLD in children may, like adult
counterparts, also progress to advanced hepatic fibrosis stages. This
implies that it is imperative to carefully follow pediatric NAFLD
patients for disease progression and that benign prognosis should not be
automatically ascribed to them.
The present study also found measurement of CAP, by
TE, as a useful parameter to predict steatosis. TE is a technique where
shear wave velocity is correlated with the stiffness or elasticity of
the underlying liver. One of its parameter, CAP, has been recently
validated as a non-invasive tool that can detect and quantify steatosis
in adults [24], though pediatric literature is still limited [25,26]. If
CAP can be further validated in prospective pediatric studies, it may
prove to be an ideal non-invasive and painless alternative to liver
biopsy to predict steatosis and prognosticate NAFLD cases.
We conclude that there is high familial incidence of
metabolic diseases in the NAFLD population. Presence of family history
of NAFLD (in any parent), and abnormal laboratory profile (higher ALT
and higher total cholesterol levels) in an overweight/obese child can
predict presence of NAFLD. Homozygosity for PNPLA3 polymorphism
in children could have a potential to be an independent predictor of
pediatric NAFLD, but could not be proven in the present study. CAP can
be useful as a non invasive modality to screen fatty liver in children.
Large multicenter biopsy-proven studies among pediatric NAFLD can
strengthen the evidence.
Contributors: VS, RK, DS: contributed in
compiling clinical and laboratory information and writing the initial
draft; SS: supervised the genetic testing; SA, SKS: conceptualised the
study, and supervised the editing and revision; VS: finally drafted the
article. All authors are in agreement with the content of the
manuscript.
Funding: None; Competing interest: None
stated.
Acknowledgments: Ms Uma Kanal, Ms Shefali Sharma
and Ms Anuradha Sharma, from Department of Nutrition, Institute of Liver
and Biliary Sciences, New Delhi for their support in nutritional
rehabilitation of the patients.
|
What Is Already Known?
•
Familial/genetic factors are
known risk factors for development of nonalcoholic fatty liver
disease (NAFLD).
What This Study Adds?
•
Presence of family history of NAFLD and abnormal laboratory
profile (high alanine aminotransferase and cholesterol levels)
in an overweight/obese child can predict presence of NAFLD.
•
Homozygosity for PNPLA3 polymorphism may not have an
independent effect on NAFLD causation.
|
References
1. Lazo M, Clark JM. The epidemiology of nonalcoholic
fatty liver disease: A global perspective. Semin Liver Dis.
2008;28:339-50.
2. Day CP. Non-alcoholic fatty liver disease: a
massive problem. Clin Med. 2011;11:176-8.
3. Matthiessen J, Velsing Groth M, Fagt S, Biltoft-Jensen
A, Stockmarr A, Andersen JS, et al. Prevalence and trends in
overweight and obesity among children and adolescents in Denmark. Scand
J Public Health. 2008;36:153-60.
4. Ji CY, Cooperative Study on Childhood Obesity:
Working Group on Obesity in China (WGOC): The prevalence of childhood
overweight/obesity and the epidemic changes in 1985-2000 for Chinese
school-age children and adolescents. Obes Rev. 2008;9:78-81.
5. Feldstein AE, Charatcharoenwitthaya P, Treeprasertsuk
S, Benson JT, Enders FB, Angulo P. The natural history of non-alcoholic
fatty liver disease in children: a follow-up study for up to 20 years.
Gut. 2009;58:1538-44.
6. Struben VM, Hespenheide EE, Caldwell SH.
Nonalcoholic steatohepatitis and cryptogenic cirrhosis within kindreds.
Am J Med. 2000;108:9-13.
7. Willner IR, Waters B, Patil SR, Reuben A, Morelli
J, Riely CA. Ninety patients with non- alcoholic steatohepatitis:
insulin resistance, familial tendency, and severity of disease. Am J
Gastroenterol. 2001;96:2957-61.
8. Abdelmalek MF, Liu C, Shuster J, Nelson DR, Asal
NR. Familial aggregation of insulin resistance in first-degree relatives
of patients with nonalcoholic fatty liver disease. Clin Gastroenterol
Hepatol. 2006;4:1162-9.
9. Schwimmer JB, Celedon MA, Lavine JE, Salem R,
Campbell N, Schork NJ, et al. Heritability of non-alcoholic fatty
liver disease. Gastroenterology. 2009;136:1585-92.
10. Loomba R, Abraham M, Unalp A, Wilson L, Lavine
J, Doo E, et al. and the Nonalcoholic Steatohepatitis Clinical
Research Network. Association between diabetes, family history of
diabetes, and risk of nonalcoholic steatohepatitis and fibrosis.
Hepatology. 2012; 56:943-51.
11. Krawczyk M, Portincasa P, Lammert F.
PNPLA3-Associated Steatohepatitis: Toward a Gene-Based Classification of
Fatty Liver Disease. Semin Liver Dis. 2013;33:369-79.
12. Bhatt SP, Nigam P, Misra A, Guleria R, Pandey
RM, Pasha MA, et al. Genetic variation in the patatin-like
phospholipase domain-containing protein-3 (PNPLA-3) gene in Asian
Indians with nonalcoholic fatty liver disease. Metab Syndr Relat Disord.
2013;11:329-35.
13. Valenti L, Alisi A, Galmozzi E, Bartuli A, Del
Menico B, Alterio A, et al. I148M patatin-like phospholipase
domain-containing 3 gene variant and severity of pediatric non-alcoholic
fatty liver disease. Hepatology. 2010;4:1274-80.
14. Lin YC, Chang PF, Hu FC, Yang WS, Chang MH, Ni
YH. A common variant in the PNPLA3 gene is a risk factor for
non-alcoholic fatty liver disease in obese Taiwanese children. J Pediatr.
2011;158:740-4.
15. Misra A, Khurana L. The metabolic syndrome in
South Asians: epidemiology, determinants, and prevention. Metab Syndr
Relat Disord. 2009;7:497-514.
16. Field, Andy. Discovering Statistics Using SPSS,
3rd ed. London: SAGE Publications; 2009.
17. Fraser A, Longnecker MP, Lawlor DA. Prevalence of
elevated alanine aminotransferase among US adolescents and associated
factors: NHANES 1999-2004. Gastroenter-ology. 2007;133:1814-20.
18. Wiegand S, Keller KM, Röbl M, L’Allemand D, Reinehr
T, Widhalm K, et al; APV-Study Group and the German Competence
Network Adipositas. Obese boys at increased risk for nonalcoholic liver
disease: evaluation of 16,390 overweight or obese children and
adolescents. Int J Obes. 2010;34:1468-74.
19. Welsh JA, Karpen S, Vos MB. Increasing prevalence
of nonalcoholic fatty liver disease among United States adolescents,
1988-1994 to 2007-2010. J Pediatr. 2013;162):496-500.
20. Yang HR, Yi DY, Choi HS. Comparison between
pediatric health promotion center and pediatric obesity clinic in
detecting metabolic syndrome and nonalcoholic fatty liver disease in
children. J Korean Med Sci. 2014;29:1672-7.
21. Schwimmer JB, Dunn W, Norman GJ, Pardee PE,
Middleton MS, Kerkar N, et al. SAFETY study: Alanine amino
transferase cutoff values are set too high for reliable detection of
pediatric chronic liver disease. Gastroenter-ology 2010;138:1357-64.
22. Schwimmer JB, Zepeda A, Newton KP, Xanthakos SA,
Behling C, Hallinan EK, et al; Nonalcoholic Steatohepatitis
Clinical Research Network. Longitudinal assessment of high blood
pressure in children with nonalcoholic fatty liver disease. PLoS
One. 2014; 9;e112569.
23. Huang SC, Yang YJ. Serum retinol-binding protein
4 is independently associated with pediatric NAFLD and fasting
triglyceride level. J Pediatr Gastroenterol Nutr. 2013; 56:145-50.
24. Chan WK, Nik Mustapha NR, Mahadeva S. Controlled
attenuation parameter for the detection and quantification of hepatic
steatosis in nonalcoholic fatty liver disease. J Gastroenterol
Hepatol. 2014;29:1470-6.
25. Desai NK, Harney S, Raza R, Al-Ibraheemi A,
Shillingford N, Mitchell PD, et al. Comparison of
Controlled Attenuation Parameter and Liver Biopsy to Assess Hepatic
Steatosis in Pediatric Patients. J Pediatr. 2016;173:160-4.
26. Cho Y, Tokuhara D, Morikawa H, Kuwae Y, Hayashi
E, Hirose M, et al. Transient Elastography-Based Liver Profiles
in a Hospital-Based Pediatric Population in Japan. PLoS
One. 2015;10:e0137239.
|
|
|
 |
|
