|
|
|
Indian Pediatr 2011;48: 549-551 |
 |
Foot Length As A Marker of Pubertal Onset |
|
S Mitra, M Samanta, M Sarkar and S Chatterjee
From Department of Pediatrics, Medical College, 88,
College Street, Kolkata 700 073, India.
Correspondence to: Dr Souvik Mitra, 618, Block "O", New
Alipore, Kolkata 700 053, India.
Email: souvik4sphs@yahoo.com
Received: March 15, 2010;
Initial review: April 9, 2010;
Accepted: November 15, 2010.
Published Online: 2011 February, 28.
PII: S09747559INPE1000216-2
|
|
Abstract
This observational study was conducted on 973 healthy
children between 8 and 16 years to evaluate the relation between changes
in foot length and pubertal maturation. The right foot length of study
children was recorded and SMR staging was done. The difference in mean
foot length was statistically significant between SMR 1 and 2 (P<0.0001).
No significant difference in the mean foot lengths was found thereafter.
Smoothed standard deviation curves were constructed for foot length as a
function of SMR stage using the LMS method. Foot length was found to
rise sharply in SMR 2, which coincides with the onset of puberty.
Key words: Foot length, India, Normogram, Puberty, SMR
staging.
|
|
A
dolescence is the period of rapid
change in terms of physical and sexual development. More than 20% growth
in stature and up to 40-50% of adult body weight is acquired during this
period [1]. But there exists substantial individual variation in this
physiological process. In this study we explored the relation of foot
length change with pubertal onset and progress based on the physiological
fact that these changes during adolescence are more strongly correlated
with pubertal maturation than chronological age [2].
Methods
This was a cross-sectional observational study
correlating the foot lengths in males and females with their SMR stages.
Our target population was healthy children in the age
group of 8-16 years, belonging to the middle income socio-economic status
defined by the Wealth Index Scale [3]. Among the schools in Central
Kolkata meeting our socio-economic status criteria, one boys’ and one
girls’ school were randomly selected. Ethical clearance was obtained from
the Institutional Ethics Committee of the study institution. The
information regarding age was confirmed from the school register.
A pilot study was conducted with 20 boys and 20 girls
in each age group over one month. On the basis of its results, assuming a
significance level of 0.05 and a maximum consent refusal to be 50%, the
estimated sample size with a power of 95% was a minimum of 90 for each age
group. With 18 age groups, the estimated sample size was 1620. We
approached 1641 healthy children in the age group of 8–16 years during the
study period of 18 months (June 2008-November 2009). 41% of the subjects
refused an SMR examination. 973 children (489 males) formed the final
sample.
Age was recorded in decimal years. Right foot length
measurement was taken one time using Brannock Foot Device. The subjects
were made to stand barefoot with equal weight on both feet, placing their
right heel in the heel cup. Foot length was recorded by looking straight
down over the longest toe. Sexual development was assessed by inspection
of pubic hair in both sexes along with examination of breast in girls, and
penis and testes in boys. Interpretation was based on Tanner’s stages of
sexual maturity [4]. Onset of puberty was defined as Tanner breast stage 2
or pubic hair stage 2 [5]. All parameters were evaluated by the same team
of workers that comprised of five junior residents from the department.
Inter-observer variations in assessment of SMR stages and measurement of
foot length were assessed from a subset of the population using kappa
statistics. Excellent inter-observer agreement was observed for all the
parameters evaluated (kappa ratios being 0.79 for SMR staging, and 0.89
for foot length).
Data was analyzed using SPSS version 17.0. Stu-dent’s
t test was applied for analysis of all quantitative data sets. A
P value less than 0.05 was considered to be significant. Reference
standard deviation curves for foot length as functions of SMR stages were
constructed using the LMS method of Cole and Green [7]. Growth Analyser
3.5 (build 197, Dutch Growth Foundation) was used for LMS curve fitting.
Results
489 males and 484 females were analyzed during the
study period. The number of children (boys, girls) in each age group was
as follows: 8 years (55,52), 9 years (52,56), 10 years (55,57), 11 years
(57,53), 12 years (54,60), 13 years (54,57), 14 years (53,50), 15 years
(55,50) and 16 years (54,59). SMR staging was done in all the subjects and
the data was rearranged and grouped according to their SMR stages in males
and females.
Table I


Mean Difference of Foot Length (cm) With SMR Stage in Both Sexes
|
SMR stages |
Male |
Female |
| SMR 1 |
|
Subjects (n) |
252 |
173 |
|
Mean |
17.41 |
17.79 |
|
SD |
1.855 |
1.219 |
|
95% CI |
17.18-17.64 |
17.61-17.98 |
| SMR 2 |
|
Subjects (n) |
68 |
103 |
|
Mean |
19.14 |
19.12 |
|
SD |
1.058 |
0.719 |
|
95% CI |
18.89 -19.4 |
18.98-9.26 |
| SMR 3 |
|
Subjects (n) |
46 |
63 |
|
Mean |
19.27 |
19.06 |
|
SD |
0.880 |
0.759 |
|
95% CI |
19.01-19.53 |
18.87-19.25 |
| SMR 4 |
|
Subjects (n) |
80 |
83 |
|
Mean |
19.3 |
19.18 |
|
SD |
0.782 |
0.794 |
|
95% CI |
19.14 -19.46 |
19-19.36 |
| SMR 5 |
|
Subjects (n) |
45 |
60 |
|
Mean |
19.46 |
19.45 |
|
SD |
0.867 |
0.705 |
|
95% CI |
19.18-19.75 |
19.27-19.63 |
Statistical difference between the foot length means of the

SMR stages 1 and 2 was <0.0001 for both males and females,

and >0.05 for all other stages;

SD: Standard Deviation; CI: Confidence Interval.
|
The difference in mean foot length was statistically
significant between SMR 1 and 2 in both sexes (P<0.0001). No
significant differences in the mean foot lengths were found thereafter (Table
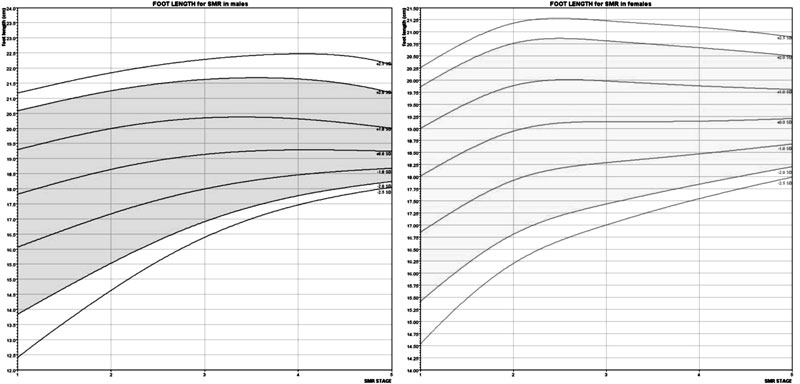
I). Smoothed standard deviation (SD) curves for foot length as a
function of SMR stage in males and females are presented (Fig 1).
|
FOOT LENGTH
for SMR in males |
FOOT LENGTH for SMR
in Females |
 |
|
Fig.1 SD curves showing foot length as a function of SMR
stage in males and females (mean curve is bounded by ± 1, 2,
2.5 SD).
|
Discussion
The foot length in this study was found to rise sharply
in SMR stage 2, which coincides with the onset of puberty [5]. Variation
in foot lengths in the subsequent SMR stages was found to be
insignificant.
Pubertal growth and physical development occur due to
activation of the hypothalamic-pituitary- gonadal axis in late childhood.
For both sexes, growth acceleration begins in early adolescence, but peak
growth velocities are not reached until SMR 3-4 [5]. It is well known that
physical growth during puberty begins distally, with enlargement of the
hands and feet, followed by the arms and legs and finally the trunk and
chest [8]. We found foot length reached adult values at the onset of
puberty. This observation is significant because it occurs before the
start of pubertal height spurt. Hence it is one of the earliest, most
easily demonstrable physical growth change during puberty.
It is often easier for the parents and children to
recall a change in footwear rather than remembering the onset of breast
development or appearance of pubic hair, hence providing a rough idea
regarding the onset of puberty in clinical settings [2]. Foot length has
previously also been shown to be an effective early marker of puberty [2].
Single one time foot length measurement cannot be used as a marker of
pubertal onset. However, if taken serially in a pre-pubertal child, a
sudden sharp rise in foot length may indicate onset of puberty.
Acknowledgments: We thank the team of junior
residents involved in the anthropometric measurements and SMR staging
during the study period. We thank the staff and students of Metropolitan
Institution (Main) and Bhagabati Balika Bidyalaya, Central Kolkata for
their active participation.
Contributors: SM planned and designed the
study along with MS. MSa supervised the data collection. SM analysed the
data and drafted the manuscript along with MSa. SC critically evaluated
the manuscript.
Funding : None.
Competing interests: None stated.
|
What This Study Adds?
• Change in foot length is one of the earliest and the most
easily demonstrable physical growth change during puberty. |
References
1. Agarwal KN, Saxena A, Bansal AK, Agarwal DK.
Physical growth assessment in adolescence. Indian Pediatr.
2001;38:1217-35.
2. Ford KR, Khoury JC, Biro FM. Early markers of
pubertal onset: height and foot size. J Adolesc Health. 2009;44: 500-1.
3. Patel AB, Prabhu AS, Dibley MJ, Kulkarni LR. A tool
for rapid socioeconomic assessment. Indian J Pediatr. 2007;74:349-52
4. Tanner JM. Growth and Adolescence, 2nd ed. Oxford,
England: Blackwell Scientific Publications; 1962.
5. Marcell AV. Adolescence. In: Kliegman RM,
Behrman RE, Jenson HB, Stanton BF (eds). Nelson Textbook of Pediatrics,
18th edn. Vol 1,Philadelphia: Saunders; 2007; p. 60-5.
6. Cole TJ, Green PJ. Smoothing reference centile
curves: the LMS method and penalized likelihood. Stat Med.
1992;11:1305-19.
7. van Buuren S, Fredriks M. Worm plot: a simple
diagnostic device for modelling growth reference curves. Stat Med.
2001;20:1259-77.
8. Gupte S, Sahni AK. Adolescence. In: Gupte S
(ed) The Short Textbook of Pediatrics, 10th edn. New Delhi: Jaypee
Brothers; 2004. p. 55-63.
|
|
|
 |
|
