|
|
|
Indian Pediatr 2015;52:
47-55 |
 |
Revised IAP Growth Charts for Height, Weight
and Body Mass Index for 5- to 18-year-old Indian Children
|
|
Vaman Khadilkar, Sangeeta Yadav, KK Agrawal, Suchit Tamboli, Monidipa
Banerjee,
*Alice Cherian,
#Jagdish P Goyal,
$Anuradha Khadilkar,
^V Kumaravel,
@V Mohan, **D
Narayanappa,
##I Ray and
Vijay Yewale
From Indian Academy of Pediatrics Growth Charts Committee;
*Department of Pediatrics, Lakeshore Hospital, Kochi, Kerala;
#Department of Pediatrics, AIIMS, Rishikesh, Uttarakhand;$Hirabai
Cowasji Jehangir Medical Research Institute, Jehangir Hospital, Pune;
^Alpha Hospital and Research Centre, Institute of Diabetes and
Endocrinology, Madurai; @Diabetes Research,
Dr. Mohan’s Diabetes Speciality Centre, Chennai; **Department of
Pediatrics, JSS Medical College, JSS Univeristy, Mysuru; and
##Department of Human Physiology, Ramakrishna Mahavidyalaya, Tripura;
India.
Correspondence to: Dr Vaman Khadilkar, Convener, IAP Growth Chart
Committee, Consultant Pediatric Endocrinologist, Hirabai Cowasji
Jehangir Medical Research Institute, Jehangir Hospital, Pune, India.
Email:
[email protected]
|
Justification: The need to revise Indian Academy of Pediatrics (IAP)
growth charts for 5- to 18-year-old Indian children and adolescents was
felt as India is in nutrition transition and previous IAP charts are
based on data which are over two decades old.
Process: The Growth Chart Committee was formed by
IAP in January 2014 to design revised growth charts. Consultative
meeting was held in November 2014 in Mumbai. Studies performed on Indian
children’s growth, nutritional assessment and anthropometry from upper
and middle socioeconomic classes in last decade were identified.
Committee contacted 13 study groups; total number of children in the age
group of 5 to 18 years were 87022 (54086 boys). Data from fourteen
cities (Agartala, Ahmadabad, Chandigarh, Chennai, Delhi, Hyderabad,
Kochi, Kolkata, Madurai, Mumbai, Mysore, Pune, Raipur and Surat) in
India were collated. Data of children with weight for height Z scores >2
SD were removed from analyses. Data on 33148 children (18170 males,
14978 females) were used to construct growth charts using Cole’s LMS
method.
Objectives: To construct revised IAP growth
charts for 5-18 year old Indian children based on collated national data
from published studies performed on apparently healthy children and
adolescents in the last 10 years.
Recommendations: The IAP growth chart committee
recommends these revised growth charts for height, weight and body mass
index (BMI) for assessment of growth of 5-18 year old Indian children to
replace the previous IAP charts; rest of the recommendations for
monitoring height and weight remain as per the IAP guidelines published
in 2007. To define overweight and obesity in children from 5-18 years of
age, adult equivalent of 23 and 27 cut-offs presented in BMI charts may
be used. IAP recommends use of WHO standards for growth assessment of
children below 5 years of age.
Keywords: Adolescent, Child, Growth charts, India,
Recommendation.
|
|
In 2007, the Indian academy of Pediatrics (IAP) growth monitoring
guideline committee designed growth charts for Indian children from
birth to 18 years of age [1]. The growth references used in these
guidelines were based on the then available multicentric data that was
collected in 1989 on affluent Indian children, which is now more than 20
years old [2,3]. The pattern of growth of a population changes with time
and hence it is recommended that references should be updated regularly
so that they reflect current growth patterns of children and are
representative of secular trends [4]. As the current IAP growth
reference curves are based on data collected more than 2 decades ago,
they may not be suitable for use any more, especially in an economically
upwardly mobile country like India, where major changes in nutrition
status of children have been witnessed. Recent studies from India on
overweight and obesity in children have shown that not only is there a
rise in the incidence of overweight and obesity but adiposity rebound is
seen at a younger age [5]. The pattern of growth in children has thus
changed and hence we urgently need to update Indian growth charts.
In 2006, the World Health Organization (WHO)
published the first growth standards as prescriptive charts for children
under the age of 5 years to be used as a single uniform global standard;
IAP and Government of India have adopted these standards for use in
Indian children under 5 years of age. These standards are aspirational
models which define how under-five children of the world should grow
rather than how they actually grow. Many countries have since then
changed their growth charts for under-five children as per the WHO
Multicentre Growth Reference Study [6].
For children between 5-18 years of age, WHO has
stated that it would not be possible to have prescriptive growth
standards because environmental variables in this age group cannot be
controlled for; hence, charts by the WHO for 5-18 year old children are
based on statistical reconstruction of 1977 National Centre for Health
Statistics data and are called growth references and not standards [7].
However, growth patterns differ amongst different populations,
especially in children above the age of 5 years, as nutritional,
environmental and genetic factors, and timing of puberty seem to play a
major role not only in the attainment of final height but also in the
characteristics of the growth curve. Hence, it is necessary to have
country-specific growth charts to monitor growth of children between
5-18 years.
There are several recent reports on growth data of
affluent Indian children, multicentric as well as regional, that can
potentially be used as reference data; however, there is no national
consensus on which charts to use [8]. While these studies have made an
attempt to address the issue of monitoring growth in Indian children; to
date, no unified charts have been constructed. Further, childhood
obesity is a growing problem in urban India and hence there is a worry
about "normalizing" obese children if growth charts are prepared on
these contemporary data sets. Since a lot of children around the world
are showing a rising trend of increasing weight, no population is
perfect on whom ideal weight charts can be constructed. Hence, a
statistical approach has been suggested by experts, including the WHO
[6,9]. WHO has described a method to eliminate unhealthy weights from
populations by removing children who have weight to height z scores
above +2 SD. This method eliminates children with unhealthy weights
especially at the upper percentiles reducing the effect of obesity which
is common in children of today, thus effectively dealing with the issue
of "normalizing" obese children’s weight.
Growth is an integral part of childhood and growth
monitoring is critical for the assessment of health and disease in an
individual child and the community as a whole. Since growth is an
indicator of a child’s health and nutrition, updated population-specific
reference growth charts are needed [10]. Taken together, there is an
urgent need to construct unified growth charts, adjusted for weight, for
assessing the growth of contemporary Indian children from 5-18 years to
be used together with the WHO standards (0-5 years). With this aim, the
IAP Growth Chart Committee (Annexure I) constructed
revised IAP growth references for 5-18 year old Indian children based on
collated national data from published studies from last 10 years,
performed on apparently healthy 87022 children and adolescents.
Comparisons of collated data with previous Indian and contemporary
International studies are also presented.
Methods
A growth chart committee was formed by the IAP in
January 2014 to design new growth charts for Indian children older than
5 years so that they are based on contemporary data that represents the
growth of modern- day Indian children. A consultative committee
scrutinized the methodology, results and scientific content of the
manuscript in November 2014 in Mumbai when data compilation, analysis
and results became available. Studies performed on children’s growth,
nutritional assessment and anthropometry published in various Indexed
journals in the last decade were indentified through internet based
search engines viz. Google, Pubmed and Embase. The criteria used
for selecting studies were as follows: Studies presenting anthropometric
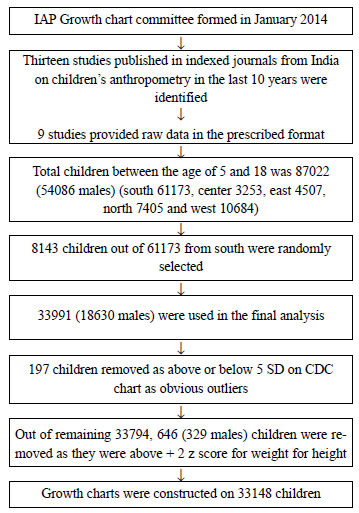
data on apparently healthy Indian children between the age of 5 to 18 (Fig.
1) from the upper and middle socioeconomic classes were included
where height, weight and age were available for every child. Studies
performed on children of lower socioeconomic class (data on them may not
represent the optimal growth potential of children due to
under-nutrition) and where authors refused/ could not share data were
excluded.
 |
|
Fig. 1
Flow chart of data acquisition and analysis.
|
Using these criteria, it was found that three studies
were performed to construct growth percentiles [11-13], one was
primarily designed to construct waist circumference percentiles [14]
but, height, weight and age were available for each child. Other studies
were performed to assess incidence of underweight, over-weight and
obesity in school-going children [15-20]. One study was primarily aimed
at comparing available growth charts in India while studying
anthropometry on normal Indian school-going children [21]. The committee
contacted 13 study groups who had published their data in indexed
journals from 2004 onwards and requested data from apparently healthy
children from upper and middle socio economic class. Out of 13 study
groups that were contacted through electronic communication, phone calls
and personal meetings, authors of nine studies were able to provide raw
data on their study subjects (Table I).
TABLE I Published Sources of Raw Data
|
Study title |
Journal |
Year of publication |
Total children |
|
Cross-sectional Growth Curves for Height, Weight and Body
|
|
|
|
|
Mass Index for Affluent Indian Children, 2007[11] |
Indian Pediatrics |
2009 |
18666 |
|
Mysore Childhood Obesity Study[16] |
Indian Pediatrics |
2009 |
43152 |
|
Determinants of Overweight and Obesity in Affluent Adolescent |
Indian Journal of
|
2011 |
5664 |
|
in Surat City, South Gujarat Region, India [17] |
Community Medicine
|
|
|
|
Body Mass Index Cut-offs for Screening for Childhood
|
Indian Pediatrics |
2012 |
18666 |
|
Overweight and Obesity in Indian Children[12] |
|
|
|
|
Prevalence of Obesity and Overweight in Urban School Children in
Kerala, India[18]
|
Indian Pediatrics |
2012 |
1634 |
|
An anthropometric study on the children of Tripura:
|
International Journal of
|
2013 |
9498 |
|
Nutritional and health coverage and redefining WHO percentile
cut-off points[20] |
Scientific and Research
Publications
|
|
|
|
Are the current Indian growth charts really representative?
|
Indian Journal of Endo-
|
|
|
|
Analysis of anthropometric assessment of school children in a
South Indian district[21] |
crinology and Metabolism |
2014 |
19668 |
|
Prevalence of Overweight and Obesity Among School Children and
Adolescents in Chennai[19] |
Indian Pediatrics |
2014 |
18955 |
|
Waist Circumference Percentiles in 2-18 Year Old Indian
Children[14] |
American Journal of Pediatrics |
2014 |
10842 |
Researchers were asked to provide raw data, including
age, height, weight, socioeconomic class, region and gender in a
pre-designed Microsoft excel template 2007. These raw data were then
joined to form a single dataset. Total number of children from upper and
middle class from 5 to 18 years was 87022 (54086 males). Data from
fourteen cities (Agartala, Ahmadabad, Chandigarh, Chennai, Delhi,
Hyderabad, Kochi, Kolkata, Madurai, Mumbai, Mysore, Pune, Raipur and
Surat) were collated. To make the regional distribution more uniform,
8143 children out of 61173 from Southern India were randomly selected by
generating random numbers in age-wise groups thus selecting
approximately comparable number of children in each age group. Data from
a total of 33991 (18630 males), were used in the final analysis. Using
CDC standards, children above and below 5 SD scores for height, weight
and body mass index (BMI) were removed as obvious outliers [22].
Fourteen children were removed as height SD score was below -5.0 SD and
2 removed as height SD was above +5. Thirty-nine children were removed
as weight SD scores were below -5 SD; no child was above +5 SD for
weight. One hundred and forty-two children with BMI SD below -5SD were
removed; no child had BMI SD above +5.
Method used to remove children with unhealthy
weights: In case of cross sectional data WHO recommends removing
observations that are above +2SD of the study population for weight for
height as unhealthy overweight [6]. Weight for height z scores were
computed using Cole’s LMS method. Children who were above +2 SD scores
were removed from analysis. A total of 646 children (329 males) were
removed from analysis. We examined (using one way ANOVA) gender- and age
group-wise regional differences, which showed that while there were
significant differences in younger age groups amongst regions, there
were no differences in height and weight SD scores post-puberty at 17
and 18 years between the five zones.
Cole’s LMS method was then used to compute growth
curves for height, weight and BMI using LMS method. LMS method
constructs growth reference percentiles adjusted for skewness [23]. Each
growth reference is summarized by three smooth curves plotted against
age representing the median (M), the coefficient of variation (S) and
the skewness (L) of the measurement distribution. For height and weight
3rd, 10th, 25th, 50th, 75th, 90th and 97th percentiles were generated.
Body mass index (BMI) was calculated as weight in Kg/height in meters
square. For the BMI; however, using International Obesity Task Force
(IOTF) approach 3rd, 5th, 10th, 25th, 50th, 23 adult equivalent (as
overweight cut-off), and 27 adult equivalent (as obesity cut-off)
percentiles were generated as per recent recommen-dations for Asian
Indian overweight and obesity cut offs [24,25]. The 3rd percentile was
used to define thinness [26].
Results
Data on 33148 children were used in the construction
of growth charts. Region wise distribution was 7227 (4514 boys, 2713
girls), 7835 (4263 boys, 3572 girls), 4408 (2131 boys, 2277 girls),
10474 (5473 boys, 5001 girls), 3204 (1789 boys, 1415 girls) from North,
South, East, West and Central zones, respectively. Of the studies
excluded, growth percentile data for comparison were available in only
one study and the difference in median height in boys and girls at 18
years on comparison with current study results was <1 cm [13].
 |
|
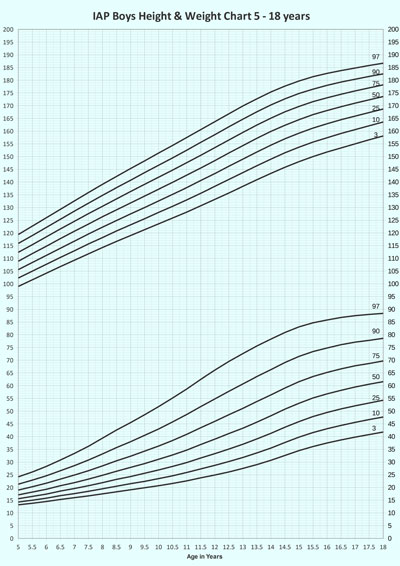
Fig. 2 Height and weight charts
for boys.
|
TABLE II Height (cm) Centiles and Standard Deviation for Boys
|
Age |
3 |
10 |
25 |
50 |
75 |
90 |
97 |
SD |
|
5.0 |
99.0 |
102.3 |
105.6 |
108.9 |
112.4 |
115.9 |
119.4 |
5.7 |
|
5.5 |
101.6 |
105.0 |
108.4 |
111.9 |
115.4 |
119.0 |
122.7 |
5.3 |
|
6.0 |
104.2 |
107.7 |
111.2 |
114.8 |
118.5 |
122.2 |
126.0 |
5.6 |
|
6.5 |
106.8 |
110.4 |
114.0 |
117.8 |
121.6 |
125.4 |
129.3 |
5.5 |
|
7.0 |
109.3 |
113.0 |
116.8 |
120.7 |
124.6 |
128.6 |
132.6 |
5.9 |
|
7.5 |
111.8 |
115.7 |
119.6 |
123.5 |
127.6 |
131.7 |
135.9 |
5.7 |
|
8.0 |
114.3 |
118.2 |
122.3 |
126.4 |
130.5 |
134.8 |
139.1 |
6.3 |
|
8.5 |
116.7 |
120.8 |
124.9 |
129.1 |
133.4 |
137.8 |
142.2 |
6.1 |
|
9.0 |
119.0 |
123.2 |
127.5 |
131.8 |
136.3 |
140.7 |
145.3 |
6.4 |
|
9.5 |
121.3 |
125.6 |
130.0 |
134.5 |
139.1 |
143.7 |
148.3 |
6.4 |
|
10.0 |
123.6 |
128.1 |
132.6 |
137.2 |
141.9 |
146.6 |
151.4 |
6.8 |
|
10.5 |
125.9 |
130.5 |
135.2 |
139.9 |
144.7 |
149.5 |
154.4 |
6.5 |
|
11.0 |
128.2 |
133.0 |
137.8 |
142.7 |
147.6 |
152.5 |
157.5 |
7.6 |
|
11.5 |
130.7 |
135.6 |
140.6 |
145.5 |
150.5 |
155.6 |
160.6 |
7.3 |
|
12.0 |
133.2 |
138.3 |
143.3 |
148.4 |
153.5 |
158.6 |
163.7 |
8.1 |
|
12.5 |
135.7 |
141.0 |
146.2 |
151.4 |
156.5 |
161.7 |
166.8 |
7.9 |
|
13.0 |
138.3 |
143.7 |
149.0 |
154.3 |
159.5 |
164.7 |
169.9 |
9.0 |
|
13.5 |
140.9 |
146.4 |
151.8 |
157.2 |
162.4 |
167.6 |
172.7 |
8.4 |
|
14.0 |
143.4 |
149.0 |
154.5 |
159.9 |
165.1 |
170.3 |
175.4 |
9.0 |
|
14.5 |
145.8 |
151.5 |
157.0 |
162.3 |
167.6 |
172.7 |
177.7 |
7.8 |
|
15.0 |
148.0 |
153.7 |
159.2 |
164.5 |
169.7 |
174.8 |
179.7 |
7.9 |
|
15.5 |
150.0 |
155.7 |
161.2 |
166.5 |
171.6 |
176.5 |
181.4 |
6.6 |
|
16.0 |
151.8 |
157.4 |
162.9 |
168.1 |
173.1 |
178.0 |
182.7 |
7.2 |
|
16.5 |
153.4 |
159.1 |
164.5 |
169.6 |
174.5 |
179.3 |
183.8 |
6.7 |
|
17.0 |
155.0 |
160.6 |
165.9 |
171.0 |
175.8 |
180.4 |
184.8 |
6.9 |
|
17.5 |
156.6 |
162.1 |
167.3 |
172.3 |
177.0 |
181.5 |
185.8 |
6.1 |
|
18.0 |
158.1 |
163.6 |
168.7 |
173.6 |
178.2 |
182.5 |
186.7 |
6.9 |
TABLE III Weight (Kg) Centiles and Standard Deviation for Boys
|
Age |
3 |
10 |
25 |
50 |
75 |
90 |
97 |
SD |
|
5.0 |
13.2 |
14.3 |
15.6 |
17.1 |
19.0 |
21.3 |
24.2 |
3.2 |
|
5.5 |
13.8 |
15.0 |
16.5 |
18.2 |
20.3 |
22.9 |
26.1 |
2.9 |
|
6.0 |
14.5 |
15.8 |
17.4 |
19.3 |
21.7 |
24.6 |
28.3 |
3.6 |
|
6.5 |
15.3 |
16.8 |
18.6 |
20.7 |
23.3 |
26.6 |
30.8 |
3.8 |
|
7.0 |
16.0 |
17.6 |
19.6 |
21.9 |
24.9 |
28.6 |
33.4 |
4.2 |
|
7.5 |
16.7 |
18.5 |
20.7 |
23.3 |
26.6 |
30.8 |
36.2 |
4.9 |
|
8.0 |
17.5 |
19.5 |
21.9 |
24.8 |
28.5 |
33.2 |
39.4 |
5.7 |
|
8.5 |
18.3 |
20.5 |
23.2 |
26.4 |
30.5 |
35.7 |
42.6 |
6.5 |
|
9.0 |
19.1 |
21.5 |
24.3 |
27.9 |
32.3 |
38.0 |
45.5 |
6.3 |
|
9.5 |
19.9 |
22.4 |
25.6 |
29.4 |
34.3 |
40.5 |
48.6 |
7.0 |
|
10.0 |
20.7 |
23.5 |
26.9 |
31.1 |
36.3 |
43.0 |
51.8 |
7.9 |
|
10.5 |
21.6 |
24.6 |
28.3 |
32.8 |
38.5 |
45.8 |
55.2 |
8.3 |
|
11.0 |
22.6 |
25.9 |
29.8 |
34.7 |
40.9 |
48.7 |
58.7 |
8.9 |
|
11.5 |
23.8 |
27.3 |
31.6 |
36.9 |
43.5 |
51.8 |
62.5 |
9.3 |
|
12.0 |
24.9 |
28.7 |
33.3 |
39.0 |
46.0 |
54.8 |
66.1 |
10.0 |
|
12.5 |
26.1 |
30.2 |
35.1 |
41.2 |
48.6 |
57.8 |
69.5 |
10.6 |
|
13.0 |
27.5 |
31.8 |
37.0 |
43.3 |
51.1 |
60.7 |
72.6 |
11.3 |
|
13.5 |
29.0 |
33.6 |
39.1 |
45.7 |
53.8 |
63.6 |
75.6 |
11.4 |
|
14.0 |
30.7 |
35.5 |
41.3 |
48.2 |
56.4 |
66.3 |
78.3 |
12.1 |
|
14.5 |
32.6 |
37.7 |
43.7 |
50.8 |
59.1 |
69.1 |
80.9 |
11.6 |
|
15.0 |
34.5 |
39.8 |
45.9 |
53.1 |
61.6 |
71.5 |
83.1 |
12.1 |
|
15.5 |
36.1 |
41.6 |
47.9 |
55.2 |
63.6 |
73.4 |
84.7 |
11.2 |
|
16.0 |
37.5 |
43.1 |
49.5 |
56.8 |
65.2 |
74.8 |
85.8 |
12.2 |
|
16.5 |
38.7 |
44.4 |
50.9 |
58.2 |
66.6 |
76.1 |
86.8 |
12.6 |
|
17.0 |
39.8 |
45.6 |
52.1 |
59.5 |
67.8 |
77.1 |
87.5 |
12.3 |
|
17.5 |
40.8 |
46.7 |
53.2 |
60.6 |
68.7 |
77.8 |
88.0 |
12.3 |
|
18.0 |
41.8 |
47.7 |
54.3 |
61.6 |
69.7 |
78.6 |
88.4 |
11.3 |
 |
|
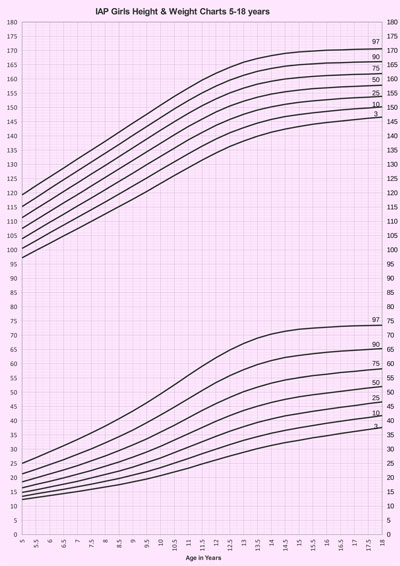
Fig. 3 Height and weight charts
for girls.
|
TABLE IV Height (cm) Centiles and Standard Deviations for Girls
|
Age |
3 |
10 |
25 |
50 |
75 |
90 |
97 |
SD |
|
5.0 |
97.2 |
100.5 |
103.9 |
107.5 |
111.3 |
115.2 |
119.3 |
5.4
|
|
5.5 |
99.8 |
103.2 |
106.8 |
110.5 |
114.4 |
118.3 |
122.5 |
5.7
|
|
6.0 |
102.3 |
106.0 |
109.7 |
113.5 |
117.4 |
121.5 |
125.6 |
5.8
|
|
6.5 |
104.9 |
108.7 |
112.5 |
116.5 |
120.5 |
124.6 |
128.7 |
5.5
|
|
7.0 |
107.4 |
111.4 |
115.4 |
119.4 |
123.5 |
127.7 |
131.9 |
6.1
|
|
7.5 |
110.0 |
114.1 |
118.2 |
122.4 |
126.6 |
130.8 |
135.0 |
6.0
|
|
8.0 |
112.6 |
116.8 |
121.1 |
125.4 |
129.6 |
133.9 |
138.1 |
6.2
|
|
8.5 |
115.2 |
119.6 |
124.0 |
128.4 |
132.7 |
137.0 |
141.3 |
6.8
|
|
9.0 |
117.8 |
122.4 |
126.9 |
131.4 |
135.8 |
140.2 |
144.5 |
6.9
|
|
9.5 |
120.5 |
125.2 |
129.9 |
134.4 |
138.9 |
143.3 |
147.6 |
6.6
|
|
10.0 |
123.3 |
128.1 |
132.8 |
137.4 |
142.0 |
146.4 |
150.8 |
7.8
|
|
10.5 |
126.1 |
130.9 |
135.7 |
140.4 |
145.0 |
149.5 |
153.9 |
7.3
|
|
11.0 |
128.8 |
133.7 |
138.6 |
143.3 |
147.9 |
152.4 |
156.8 |
7.9
|
|
11.5 |
131.5 |
136.4 |
141.2 |
145.9 |
150.6 |
155.1 |
159.6 |
7.1
|
|
12.0 |
134.0 |
138.9 |
143.7 |
148.4 |
153.0 |
157.5 |
162.0 |
7.0
|
|
12.5 |
136.3 |
141.1 |
145.8 |
150.5 |
155.1 |
159.6 |
164.1 |
6.7
|
|
13.0 |
138.2 |
142.9 |
147.6 |
152.2 |
156.8 |
161.3 |
165.9 |
6.9
|
|
13.5 |
139.9 |
144.5 |
149.1 |
153.6 |
158.2 |
162.7 |
167.2 |
6.0
|
|
14.0 |
141.3 |
145.8 |
150.2 |
154.7 |
159.2 |
163.7 |
168.2 |
6.6
|
|
14.5 |
142.4 |
146.8 |
151.1 |
155.5 |
160.0 |
164.5 |
169.0 |
5.9
|
|
15.0 |
143.3 |
147.5 |
151.8 |
156.1 |
160.5 |
165.0 |
169.5 |
6.6
|
|
15.5 |
144.1 |
148.1 |
152.3 |
156.6 |
160.9 |
165.3 |
169.8 |
5.9
|
|
16.0 |
144.7 |
148.6 |
152.7 |
156.9 |
161.2 |
165.6 |
170.1 |
6.1
|
|
16.5 |
145.2 |
149.1 |
153.1 |
157.2 |
161.4 |
165.7 |
170.2 |
6.4
|
|
17.0 |
145.7 |
149.5 |
153.4 |
157.4 |
161.6 |
165.9 |
170.4 |
6.5
|
|
17.5 |
146.2 |
149.8 |
153.6 |
157.6 |
161.7 |
166.0 |
170.5 |
6.7
|
|
18.0 |
146.6 |
150.2 |
153.9 |
157.8 |
161.9 |
166.1 |
170.6 |
6.6
|
TABLE V Weight (Kg) Centiles and Standard Deviations for Girls
|
Age |
3 |
10 |
25 |
50 |
75 |
90 |
97 |
SD |
|
5.0 |
12.3 |
13.4 |
14.8 |
16.4 |
18.5 |
21.3 |
25.0 |
2.5
|
|
5.5 |
13.0 |
14.3 |
15.7 |
17.6 |
19.9 |
22.9 |
27.0 |
3.5
|
|
6.0 |
13.7 |
15.1 |
16.7 |
18.7 |
21.3 |
24.6 |
29.1 |
3.4
|
|
6.5 |
14.4 |
15.9 |
17.7 |
19.9 |
22.7 |
26.3 |
31.2 |
4.1
|
|
7.0 |
15.1 |
16.8 |
18.7 |
21.2 |
24.2 |
28.2 |
33.4 |
4.4
|
|
7.5 |
15.9 |
17.7 |
19.9 |
22.5 |
25.9 |
30.1 |
35.7 |
4.8
|
|
8.0 |
16.7 |
18.7 |
21.1 |
24.0 |
27.6 |
32.2 |
38.1 |
5.2
|
|
8.5 |
17.5 |
19.7 |
22.3 |
25.5 |
29.5 |
34.4 |
40.7 |
6.4
|
|
9.0 |
18.5 |
20.9 |
23.7 |
27.2 |
31.5 |
36.7 |
43.4 |
6.4
|
|
9.5 |
19.5 |
22.1 |
25.3 |
29.0 |
33.6 |
39.3 |
46.3 |
6.9
|
|
10.0 |
20.7 |
23.5 |
26.9 |
31.0 |
36.0 |
42.0 |
49.4 |
7.7
|
|
10.5 |
22.0 |
25.1 |
28.8 |
33.2 |
38.4 |
44.8 |
52.6 |
8.3
|
|
11.0 |
23.3 |
26.7 |
30.7 |
35.4 |
41.0 |
47.7 |
55.9 |
8.5
|
|
11.5 |
24.8 |
28.4 |
32.6 |
37.6 |
43.6 |
50.6 |
59.1 |
9.1
|
|
12.0 |
26.2 |
30.0 |
34.5 |
39.8 |
46.0 |
53.4 |
62.1 |
9.0
|
|
12.5 |
27.6 |
31.6 |
36.3 |
41.8 |
48.2 |
55.8 |
64.8 |
9.7
|
|
13.0 |
28.9 |
33.1 |
37.9 |
43.6 |
50.2 |
57.9 |
67.1 |
9.4
|
|
13.5 |
30.2 |
34.4 |
39.4 |
45.1 |
51.8 |
59.7 |
69.0 |
9.8
|
|
14.0 |
31.3 |
35.6 |
40.6 |
46.4 |
53.2 |
61.1 |
70.4 |
9.6
|
|
14.5 |
32.3 |
36.6 |
41.7 |
47.5 |
54.3 |
62.2 |
71.4 |
9.4
|
|
15.0 |
33.1 |
37.5 |
42.5 |
48.4 |
55.1 |
62.9 |
72.1 |
9.6
|
|
15.5 |
34.0 |
38.3 |
43.3 |
49.1 |
55.8 |
63.5 |
72.5 |
8.7
|
|
16.0 |
34.7 |
39.1 |
44.0 |
49.7 |
56.3 |
64.0 |
72.8 |
8.7
|
|
16.5 |
35.5 |
39.8 |
44.7 |
50.3 |
56.9 |
64.4 |
73.1 |
9.2
|
|
17.0 |
36.2 |
40.5 |
45.3 |
50.9 |
57.3 |
64.7 |
73.3 |
8.8
|
|
17.5 |
36.9 |
41.1 |
46.0 |
51.5 |
57.8 |
65.0 |
73.4 |
9.5
|
|
18.0 |
37.6 |
41.8 |
46.6 |
52.0 |
58.2 |
65.3 |
73.5 |
10.2 |
 |
|
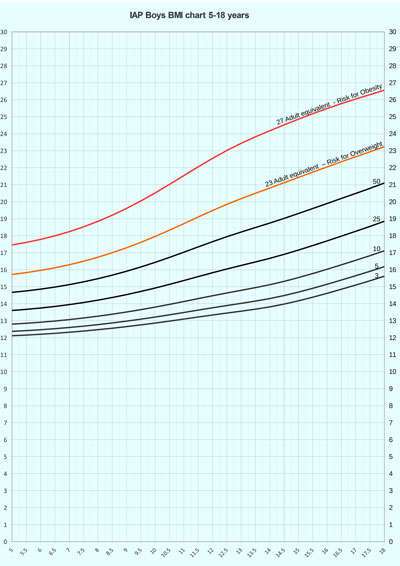
Fig. 4 Body mass index charts
for boys.
|
TABLE VI Body Mass Index Percentiles and Standard Deviations for Boys
|
Age
|
3 |
5 |
10 |
25 |
50 |
23 |
27 |
SD
|
|
|
|
|
|
|
Eq(71) |
Eq(90) |
|
|
5.0 |
12.1 |
12.4 |
12.8 |
13.6 |
14.7 |
15.7 |
17.5 |
1.6 |
|
5.5 |
12.2 |
12.4 |
12.9 |
13.7 |
14.8 |
15.8 |
17.6 |
1.5 |
|
6.0 |
12.2 |
12.5 |
12.9 |
13.7 |
14.9 |
16.0 |
17.8 |
1.8 |
|
6.5 |
12.3 |
12.5 |
13.0 |
13.8 |
15.0 |
16.1 |
18.0 |
1.8 |
|
7.0 |
12.3 |
12.6 |
13.1 |
13.9 |
15.1 |
16.3 |
18.2 |
1.9 |
|
7.5 |
12.4 |
12.7 |
13.2 |
14.1 |
15.3 |
16.5 |
18.5 |
2.2 |
|
8.0 |
12.5 |
12.8 |
13.3 |
14.2 |
15.5 |
16.7 |
18.8 |
2.5 |
|
8.5 |
12.6 |
12.9 |
13.4 |
14.4 |
15.7 |
17.0 |
19.2 |
2.8 |
|
9.0 |
12.7 |
13.0 |
13.5 |
14.5 |
15.9 |
17.3 |
19.6 |
2.6 |
|
9.5 |
12.8 |
13.1 |
13.7 |
14.7 |
16.2 |
17.6 |
20.1 |
2.8 |
|
10.0 |
12.9 |
13.2 |
13.8 |
14.9 |
16.4 |
18.0 |
20.5 |
3.1 |
|
10.5 |
13.0 |
13.3 |
14.0 |
15.1 |
16.7 |
18.3 |
21.0 |
3.2 |
|
11.0 |
13.1 |
13.5 |
14.1 |
15.4 |
17.0 |
18.7 |
21.5 |
3.2 |
|
11.5 |
13.2 |
13.6 |
14.3 |
15.6 |
17.3 |
19.1 |
22.1 |
3.3 |
|
12.0 |
13.3 |
13.8 |
14.5 |
15.8 |
17.7 |
19.5 |
22.6 |
3.4 |
|
12.5 |
13.5 |
13.9 |
14.6 |
16.0 |
17.9 |
19.8 |
23.0 |
3.6 |
|
13.0 |
13.6 |
14.0 |
14.8 |
16.3 |
18.2 |
20.2 |
23.4 |
3.5 |
|
13.5 |
13.7 |
14.2 |
14.9 |
16.5 |
18.5 |
20.5 |
23.8 |
3.7 |
|
14.0 |
13.8 |
14.3 |
15.1 |
16.7 |
18.7 |
20.8 |
24.2 |
3.7 |
|
14.5 |
14.0 |
14.5 |
15.3 |
16.9 |
19.0 |
21.1 |
24.5 |
3.5 |
|
15.0 |
14.2 |
14.7 |
15.5 |
17.2 |
19.3 |
21.4 |
24.9 |
3.7 |
|
15.5 |
14.4 |
14.9 |
15.8 |
17.4 |
19.6 |
21.7 |
25.2 |
3.4 |
|
16.0 |
14.6 |
15.1 |
16.0 |
17.7 |
19.9 |
22.0 |
25.5 |
3.7 |
|
16.5 |
14.9 |
15.4 |
16.3 |
18.0 |
20.2 |
22.4 |
25.8 |
3.8 |
|
17.0 |
15.1 |
15.6 |
16.6 |
18.3 |
20.5 |
22.6 |
26.0 |
3.8 |
|
17.5 |
15.4 |
15.9 |
16.8 |
18.6 |
20.8 |
22.9 |
26.3 |
3.6 |
|
18.0 |
15.6 |
16.2 |
17.1 |
18.9 |
21.1 |
23.2 |
26.6 |
3.2 |
 |
|
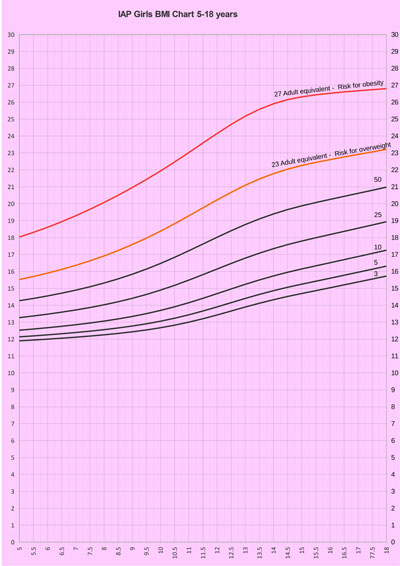
Fig. 5 Body mass index charts
for girls.
|
TABLE VII Body Mass Index Percentiles and Standard Deviations for Girls
|
Age |
3 |
5 |
10 |
25 |
50 |
23 |
27 |
SD |
|
|
|
|
|
|
Eq(75) |
Eq(95) |
|
|
5.0 |
11.9 |
12.1 |
12.5 |
13.3 |
14.3 |
15.5 |
18.0 |
1.4
|
|
5.5 |
11.9 |
12.2 |
12.6 |
13.4 |
14.4 |
15.7 |
18.3 |
1.7
|
|
6.0 |
12.0 |
12.2 |
12.7 |
13.5 |
14.5 |
15.9 |
18.6 |
1.7
|
|
6.5 |
12.1 |
12.3 |
12.8 |
13.6 |
14.7 |
16.1 |
18.9 |
2.0
|
|
7.0 |
12.1 |
12.4 |
12.8 |
13.7 |
14.9 |
16.4 |
19.3 |
2.1
|
|
7.5 |
12.2 |
12.5 |
12.9 |
13.9 |
15.1 |
16.6 |
19.7 |
2.2
|
|
8.0 |
12.3 |
12.6 |
13.1 |
14.0 |
15.3 |
16.9 |
20.1 |
2.3
|
|
8.5 |
12.3 |
12.7 |
13.2 |
14.2 |
15.6 |
17.2 |
20.5 |
2.7
|
|
9.0 |
12.4 |
12.8 |
13.3 |
14.4 |
15.8 |
17.6 |
21.0 |
2.7
|
|
9.5 |
12.5 |
12.9 |
13.5 |
14.6 |
16.1 |
18.0 |
21.4 |
2.8
|
|
10.0 |
12.7 |
13.1 |
13.7 |
14.9 |
16.5 |
18.4 |
21.9 |
2.9
|
|
10.5 |
12.8 |
13.2 |
13.9 |
15.2 |
16.8 |
18.8 |
22.5 |
3.1
|
|
11.0 |
13.0 |
13.4 |
14.1 |
15.5 |
17.2 |
19.3 |
23.0 |
3.1
|
|
11.5 |
13.2 |
13.7 |
14.4 |
15.8 |
17.6 |
19.8 |
23.6 |
3.3
|
|
12.0 |
13.4 |
13.9 |
14.7 |
16.1 |
18.0 |
20.2 |
24.1 |
3.2
|
|
12.5 |
13.7 |
14.2 |
15.0 |
16.5 |
18.4 |
20.7 |
24.7 |
3.3
|
|
13.0 |
13.9 |
14.4 |
15.2 |
16.8 |
18.8 |
21.1 |
25.2 |
3.2
|
|
13.5 |
14.1 |
14.6 |
15.5 |
17.1 |
19.1 |
21.5 |
25.6 |
3.5
|
|
14.0 |
14.3 |
14.9 |
15.7 |
17.3 |
19.4 |
21.8 |
25.9 |
3.4
|
|
14.5 |
14.5 |
15.1 |
16.0 |
17.6 |
19.7 |
22.0 |
26.2 |
3.3
|
|
15.0 |
14.7 |
15.2 |
16.1 |
17.8 |
19.9 |
22.3 |
26.3 |
3.4
|
|
15.5 |
14.9 |
15.4 |
16.3 |
18.0 |
20.1 |
22.4 |
26.4 |
3.1
|
|
16.0 |
15.0 |
15.6 |
16.5 |
18.2 |
20.3 |
22.6 |
26.5 |
3.1
|
|
16.5 |
15.2 |
15.8 |
16.7 |
18.4 |
20.4 |
22.8 |
26.6 |
3.2
|
|
17.0 |
15.4 |
16.0 |
16.9 |
18.6 |
20.6 |
22.9 |
26.7 |
3.0
|
|
17.5 |
15.5 |
16.1 |
17.1 |
18.7 |
20.8 |
23.1 |
26.7 |
3.1
|
|
18.0 |
15.7 |
16.3 |
17.3 |
18.9 |
21.0 |
23.2 |
26.8 |
3.6 |
Fig.
2 shows the smoothed height and weight
curves for Indian boys, using 3rd, 10th, 25th, 50th, 75th, 90th and 97th
percentiles, respectively. Equivalent height and weight percentile
values along with standard deviations are presented in Table
II and Table III, respectively. Fig. 3
shows the smoothed height and weight curves for Indian girls, using 3rd,
10th, 25th, 50th, 75th, 90th and 97th percentiles, respectively.
Equivalent height and weight percentile values along with standard
deviations are presented in Table IV and Table V,
respectively. Fig. 4 shows the smoothed BMI percentile
curves for boys showing 3rd, 5th, 10th, 25th, 50th, 23 adult equivalent
(overweight) and 27 adult equivalent (obesity) percentiles. Equivalent
values for BMI for boys along with SD are shown in Table VI.
Fig. 5 shows the smoothed BMI percentile curves for girls
showing 3rd, 5th, 10th, 25th, 50th, 23 adult equivalent (overweight) and
27 adult equivalent (obesity) percentiles. Equivalent values for BMI for
girls along with SD are shown in Table VII.
Web Table
I and Web Table II
illustrate the comparison of height and weight in the current study with
data from Saudi Arabia [27], China [28] , IAP 2007 [1], CDC [29] and WHO
[7]. The height percentiles of boys and girls from current study were
almost at par with China and Saudi Arabia but were still lower than the
CDC and WHO percentiles. Further, mean boys’ height at the age of 18
year was found to be 2.8 cm higher than the mean as per the previous IAP
growth charts, and the 97th percentile was also higher (186.7 cm vs
181.6 cm). In case of girls, the average height at the age of 18 year
showed an increase of 0.8 cm from 157.0 to 157.8 while the 97th
percentile showed an increase of 2.6 cm from 168.0 to 170.6, thus there
was a secular trend in height which was more marked in boys. The upper
weight percentiles in the current study are higher than IAP 2007 growth
data for boys but comparable in girls, are lower than Saudi Arabia,
China and CDC in case of boys and at par with Saudi Arabia and China but
lower than CDC in case of girls.
Discussion
We present here cross-sectional reference percentiles
curves for height, weight and BMI based on data published on 5-18 year
old apparently healthy Indian children from 14 Indian cities collected
by nine research groups over the last decade. As compared to the
previous IAP charts, boys and girls were taller at a younger age. At 18
years, average height of boys was 2.8 cm higher and the 97th percentile
was 5 cm higher; for girls these figures were 0.8 cm and 2.6 cm. Thus,
there was a secular trend in height which underlines the importance of
updating growth charts in a developing nation like India.
By adopting the approach as suggested by the WHO, it
was possible to produce weight percentiles which were lower as compared
to the recently published weight charts on affluent Indian children in
2011, thus reducing the impact of unhealthy weights on growth charts. At
5,10 and 18 years the 97th
percentile was 5.3, 1.5 and 10.1 kg lower in comparison with the 2011
data, respectively, while the difference in the median at 5, 10, 18
years was 1.9, 1.9 and 4.7 kg, respectively in boys [6,13]. In girls,
the equivalent values at 5, 10 and 18 years were 3.7, 3.3 and 6.6 kg at
the 97th percentile, respectively and at 5, 10 and 18 years 2.1, 2.8 and
3.6 kg, respectively at the median. The same comparison with affluent
Indian children data published in 2009 shows that in boys the difference
in 97th percentile at 5, 10, 18 years was 1.9, 3 and 9.9 kg while the
difference in the median was unremarkable. In girls, equivalent values
at 5, 10 and 18 years were 0.3, 3.9 and 9.1 kgs at the 97th percentile
while the difference in median was insignificant [11]. Thus the study
reduced the impact of unhealthy weights on the weight charts.
BMI charts presented are based on the same method as
IOTF [24]. The 23 and 27 adult equivalent cut offs lines (for risk of
overweight and obesity, respectively) are more appropriate for use in
Asian children as Asians are known to have more adiposity and increased
cardio-metabolic risk at a lower BMI [25]. The current study’s 23 and 27
adult equivalent cut-offs are very close to IOTF’s extended 23 and 27
cut-offs for both sexes, being slightly lower than the IOTF extended
Asian cut-offs by about 0.5 in the 23rd equivalent line and by about 1
in the 27 equivalent line in boys. In case of girls the 23 and 27
equivalent lines are similar [24].
Comparing the final height and weight data with
recent international studies from China, Saudi Arabia, WHO and CDC, it
is clear that Indian children are growing almost at par with Chinese and
Saudi Arabian children but are still shorter and lighter than their
Caucasian counterparts [7,27,28,29] (Table VII and
Web
Table I). Further, Indian children’s stature seems to be
comparable to Caucasian children until the onset of pubertal years,
however, the growth spurt after puberty is attenuated in Indian children
in both sexes, the effect being more pronounced in girls. Thus, the
average difference in height between Caucasian girls and Indian girls
from 5 to 11 years of age is only about 1 cm; however this gap widens to
6 cms at 18 years. Similar figures in boys are 1 cm from the age of 5 to
12.5 years and 3.5 cm at 18 years. Interestingly, Chinese children also
show a very similar growth pattern suggesting that this is possibly a
characteristic of Asian children [30]. These finding are of particular
relevance in interpreting target height and predicting final adult
height based on prediction equations, thus stressing the need for ethnic
specific growth charts.
Updating growth references and standards is necessary
because with changing socioeconomic standards and demographic changes
children’s growth patterns also change and secular trends can be
incorporated in the updated growth charts. This is particularly true in
a developing country as nutrition transition influences growth patterns
significantly and secular trends can be marked over a short time period.
The strengths of the growth charts presented here are
that they are contemporary, have good national representation as they
are prepared from 14 Indian cities from all five zones of IAP giving a
true representation of current growth pattern of children across the
country. The BMI charts give adult equivalent cut-offs which are more
relevant for Asian children and the data have been corrected for
unhealthy weights. A drawback of this study is that the study designs
and measurement scales possibly used in the nine studies included are
different; however, rigorous attention has been given to the methodology
of all studies included here to minimize errors while data analysis was
performed.
Recommendations
The IAP Growth Chart Committee recommends these
revised growth charts for height, weight and BMI for assessment of
growth of 5-18 year old Indian children to replace the previous IAP
growth charts; the rest of the recommendations for monitoring height and
weight remain as per the IAP guidelines published in 2007. To define
overweight and obesity in children from 5-18 years of age, adult
equivalent of 23 and 27 cut-off lines as presented in BMI charts here
may be used.
IAP recommends use of WHO Multistandards Growth
Reference Study for assessment of children under the age of 5 years.
Acknowledgement: Dr Shashi Chiplonkar, Honorary
Senior Scientist and Statistician HCJMRI, Jehangir Hospital, Pune, for
her advice on the project.
Contributors: VK: helped in conceptualizing and
designing the methodology, contributed the data, helped in data analysis
and manuscript writing and will act as the corresponding author; SY, KA,
ST, MB, VY: were a part of the IAP Growth Chart Committee and helped in
conceptualizing and designing the study and manuscript writing; AC, JG,
AK, VK, VM, DN, IR: contributed data and helped in manuscript writing.
Funding: None; Competing interests: None
stated.
Annexure I
IAP Growth chart committee: V Yewale (Chairperson),
V Khadilkar (Convener), S Yadav, KK Agarwal, S Tamboli, M
Banerjee. IAP Office Bearers: Vijay Yewale: IAP President;
Sachidananda Kamath: IAP President Elect; CP Bansal:
Immediate Past President; Neeli Ramchander: Vice president;
Pravin Mehta: Hon Secretary General; AS Vasudev: Hon Joint
Secretary; Bakul Parekh: Treasurer; Dheeraj Shah: Editor,
Indian Pediatrics; P Ramachandran: Editor, Indian Journal of
Practical Pediatrics; Upendra Kinjawadekar: Academic Affairs
Administrator.
References
1. Khadilkar VV, Khadilkar AV, Choudhury P, Agarwal
KN, Ugra D, Shah NK. IAP growth monitoring guidelines for children from
birth to 18 years. Indian Pediatr. 2007;44:187-97.
2. Agarwal DK, Agarwal KN, Upadhyay SK, Mittal R,
Prakash R, Rai S. Physical and sexual growth pattern of affluent Indian
children from 5-18 years of age. Indian Pediatr. 1992;29:1203-82.
3. Agarwal DK, Agarwal KN. Physical growth in Indian
affluent children (Birth – 6 years). Indian Pediatr. 1994;31:377-413.
4. Buckler JMH. Growth Disorders in Children. 1st ed.
London: BMJ Publishing Group; 1994.
5. Khadilkar VV, Khadilkar AV, Cole TJ, Chiplonkar
SA, Pandit D. Overweight and obesity prevalence and body mass index
trends in Indian children. Int J Pediatr Obes. 2011;6:e216-24.
6. WHO Child Growth Standards. Acta Pediatr
Supplement. 2006;450:5-101.
7. de Onis M, Onyango AW, Borghi E, Siyam A, Nishida
C, Siekmann J. Development of a WHO growth reference for school-aged
children and adolescents. Bull World Health Organ. 2007;85:660-7.
8. Khadilkar V, Phanse S. Growth charts from
controversy to consensus. Indian J Endocrinol Metab. 2012;16:S185-7.
9. Bhatia V. Growth charts, the secular trend and the
growing concern of childhood obesity. Natl Med J India. 2011;24:260-2.
10. Cameron N. The methods of auxological
anthropometry. In: Falkner F, Tanner JM (eds). Human growth—A
comprehensive treatise. Vol. III. 2nd ed. New York: Plenum Press; 1986.
p.3-46.
11. Khadilkar VV, Khadilkar AV, Cole TJ, Sayyad MG.
Cross-sectional growth curves for height, weight and body mass index for
affluent Indian children, 2007. Indian Pediatr. 2009;46:477-89.
12. Khadilkar VV, Khadilkar AV, Borade AB, Chiplonkar
SA. Body mass index cut-offs for screening for childhood overweight and
obesity in Indian children. Indian Pediatr. 2012;49:29-34.
13. Marwaha RK, Tandon N, Ganie MA, Kanwar R,
Shivaprasad C, Sabharwal A, et al. Nationwide reference data for
height, weight and body mass index of Indian schoolchildren. Natl Med J
India. 2011;24:269-77.
14. Khadilkar A, Ekbote V, Chiplonkar S, Khadilkar V,
Kajale N, Kulkarni S, et al. Waist circumference percentiles in
2-18 year old Indian children. J Pediatr. 2014;164:1358-62.
15. Kaur S, Sachdev HP, Dwivedi SN, Lakshmy
R, Kapil U. Prevalence of overweight and obesity amongst school children
in Delhi, India. Asia Pac J Clin Nutr. 2008;17:592-6.
16. Premanath M, Basavanagowdappa H, Shekar MA,
Vikram SB, Narayanappa D. Mysore childhood obesity study. Indian Pediatr.
2010;47:171-3.
17. Goyal JP, Kumar N, Parmar I, Shah VB, Patel B.
Determinants of overweight and obesity in affluent adolescent in Surat
City, South Gujarat Region, India. Indian J Community Med.
2011;36:296-300.
18. Cherian AT, Cherian SS, Subbiah S. Prevalence of
obesity and overweight in urban school children in Kerala, India. Indian
Pediatr. 2012;49:475-7.
19. Jagadesan S, Harish R, Miranda P, Unnikrishnan R,
Anjana RM, Mohan V. Prevalence of overweight and obesity among school
children and adolescents in Chennai. Indian Pediatr. 2014;51:544-9.
20. Ray I, Amar K. An anthropometric study on the
children of Tripura: Nutritional and health coverage and redefining WHO
percentile cut-off points. Int J Sci Res Publi. 2013;3:1-8.
21. Kumaravel V, Shriraam V, Anitharani M, Mahadevan
S, Balamurugan AN, Sathiyasekaran BW. Are the current Indian growth
charts really representative? Analysis of anthropometric assessment of
school children in a South Indian district. Indian J Endocrinol Metab.
2014;18: 56-62.
22. Mansourian M, Marateb HR, Kelishadi R, Motlagh
ME, Aminaee T, Taslimi M, et al. First growth curves based on the
World Health Organization reference in a Nationally-representative
sample of pediatric population in the Middle East and North Africa
(MENA): the CASPIAN-III study. BMC Pediatr. 2012;12:149.
23. Cole TJ, Green PJ. Smoothing reference centile
curves: The LMS method and penalized likelihood. Stat Med.
1992;11:1305-19.
24. Cole TJ, Lobstein T. Extended international
(IOTF) body mass index cut-offs for thinness, overweight and obesity.
Pediatr Obes. 2012;7:284-94.
25. WHO Expert Consultation. Appropriate body-mass
index for Asian populations and its implications for policy and
intervention strategies. Lancet. 2004;10:157-63.
26.
http://www.who.int/growthref/who2007_bmi_for_age/en/. Accessed November
13, 2014.
27. El-Mouzan MI, Al-Herbish AS, Al-Salloum AA,
Qurachi MM, Al-Omar AA. Growth charts for Saudi children and
adolescents. Saudi Med J. 2007;28:1555-68.
28. Zong XN, Li H. Construction of a new growth
references for China based on urban Chinese children: Comparison with
the WHO growth standards. PLoS One. 2013;8:e59569.
29. Kuczmarski RJ, Ogden CL, Guo SS, Grummer-Strawn
LM, Flegal KM, Mei Z, et al. 2000 CDC Growth Charts for the
United States: methods and development. Vital Health Stat. 11.
2002;246:1-190.
30. Li H, Ji CY, Zong XN, Zhang YQ. Height and weight
standardized growth charts for Chinese children and adolescents aged 0
to 18 years. Zhonghua Er Ke Za Zhi. 2009;47:487-92.
|
|
|
 |
|
