|
|
|
Indian Pediatr 2012;49:
29-34 |
 |
Body Mass Index Cut-offs for Screening for
Childhood Overweight and Obesity in Indian Children |
|
VV Khadilkar, AV Khadilkar, AB Borade and SA Chiplonkar
From the Department of Pediatrics, Hirabai Cowasji
Jehangir Medical Research Institute, Jehangir Hospital, Pune, India.
Correspondence to: Dr Anuradha Khadilkar, Growth and
Pediatric Endocrine Unit, Hirabai Cowasji Jehangir Medical Research
Institute, Jehangir Hospital, 32, Sassoon Road, Pune 411 001, India.
Email:
[email protected]
Received: July 30, 2010;
Initial review: September 3, 2010;
Accepted: January 14, 2011.
Published online: 2011, May 30.
PII:S09747559INPE1000147-1
|
Objective:
To develop age and sex
specific cut- offs for BMI to screen for overweight and obesity in Indian
children linked to an adult BMI of 23 and 28 kg/m2 respectively, using
contemporary Indian data.
Design: Cross-sectional.
Setting: Multicentric, School based.
Participants: 19834 children were measured from 11
affluent schools from five major geographical regions of India. Data were
analyzed using the LMS method, which constructs growth reference
percentiles adjusted for skewness.
Results: Compared to the cut-offs suggested for
European populations and those by the Indian Academy of Pediatrics 2007
Guidelines, the age and sex specific cut off points for body mass index
for overweight and obesity for Indian children suggested by this study are
lower.
Conclusions: Contemporary cross-sectional age and
sex specific BMI cut-offs for Indian children linked to Asian cut-offs of
23 and 28 kg/m2 for the assessment of risk of overweight and
obesity, respectively are presented.
Key words: Adult equivalent BMI, Childhood, Cut-off, India,
Obesity, Overweight.
|
|
The unabated rise in the
prevalence of overweight in children and adolescents is one of the most
alarming public health issues facing the world today [1]. Among
Indian children, various studies report
the magnitude of overweight to be from 9 to 27.5% and that
of obesity from 1 to 12.9% [2-6].
Obesity increases the risk for many chronic diseases
including diabetes mellitus, cardiovascular disease, and non-alcoholic
fatty liver disease, and decreases the overall quality of life [7-9].
Therefore, it is imperative to identify the at risk individuals at an
early stage.
Allowing for the ease of measuring height and weight in
the field setting, Body Mass Index (BMI) is believed to be an acceptable
indicator of the risk of overweight in children and adolescents [10]. A
cut-off point of 30 kg/m 2
and 25 kg/ m2 are
recognized internationally as a definition of obesity and overweight in
adults. However, BMI in children changes substantially with age, thus,
age-specific cut-off points are needed. The 85th and 95th percentile have
been used as cut-offs to define overweight and obesity, respectively in
children [11].
The pattern of growth of a population changes over time
and hence growth references should be updated regularly, particularly for
countries in nutritional transition [12]. However, our multicentric growth
survey on 5 to 17 year-old affluent urban Indian children show that
compared to the previously available nationally representative data, boys
and girls were heavier at all ages [13]. Using growth references based on
a descriptive sample of a population that reflects a secular trend towards
overweight and obesity may result in the underestimation of overweight and
obesity. Therefore, it is crucial to find a method by which the influence
of unhealthy weight on BMI reference curves is avoided.
The 85th and 95th percentile that are used as cut-off
points for overweight and obesity in children are arbitrary and are not
linked to obesity related health risks. Unfortunately, identifying cut-off
points in children is more difficult since they have less disease related
to obesity than adults. A workshop organized by the International Obesity
Task Force (IOTF) proposed that adult cut-off points be linked to BMI
percentiles for children to provide child cut-off points [14]. Lower BMI
cut-offs of 23 and 28 kg/m 2
have been suggested for overweight and obesity for Asian adults, as they
are more prone to adiposity and central obesity at a lower BMI than their
western counterparts. Thus, in the present study, we have used an external
quantitative criterion, i.e. the adult BMI equivalent of 23 and 28 kg/m2
as advised for Asian populations, to derive cut-offs for screening for
risk of overweight and obesity for Indian children [15]. The specific aim
of this study was to develop age and sex specific cut-offs for BMI for
risk of overweight and obesity for 5-17 year old Indian children linked to
an adult BMI of 23 and 28 kg/m2,
respectively using contemporary Indian data and to examine the validity of
the cut-offs of 25 and 30 kg/m2
used by western populations.
Methods
We used data on BMI from a nationally representative,
multicentric, cross sectional survey conducted from June 2007 to January
2008 [13]. The Indian Academy of Pediatrics divides India into 5 zones,
i.e. North, South, East, West, and Central. We selected ten study sites
from these regions (Delhi, Chandigarh, Chennai, Bangalore, Kolkata,
Mumbai, Pune, Baroda, Hyderabad and Raipur). Study staff identified
nutritionally well-off areas in above cities (based on per capita income)
all over India and made a list of schools catering to children of
socioeconomically welloff families [16]. Three schools were selected (from
each zone) from those chosen by generating random numbers (yearly fees
≥  10,000).
Permission for the study was obtained from 11 schools; two schools each
from in east, north, central and south zones and 3 schools from west zone
participated in this study. 10,000).
Permission for the study was obtained from 11 schools; two schools each
from in east, north, central and south zones and 3 schools from west zone
participated in this study.
Standing height was measured using a portable
stadiometer (Leicester Height Meter, Child Growth Foundation, UK, range
60-207cm). Weight was measured using portable electronic weighing scales
(Salter, India) accurate to 100 g. Children’s age was derived using school
records.
Measurements were performed by 17 graduate observers
acquainted with the cities and local language. They were trained as per
study protocol, and given written instructions about the calibration of
instruments, measurement techniques, and data entry formats.
Inter-observer and intraobserver coefficients of variation were both
<0.01(1%).
The cleaned data were then analyzed using the LMS
method, which constructs growth reference percentiles adjusted for
skewness [17]. Each growth reference is summarized by 3 smooth curves
plotted against age representing the median (M), the coefficient of
variation (S) and the skewness (L) of the measurement distribution [18].
The L, M, and S curves convert measurements to exact SD scores using the
formula:
SD score= Measurement /M(t)L(t)-1/ S(t)L(t)
Where measurement is the child’s measurement (height or
weight) and L(t), M(t) and S(t) are values read from the smooth curves for
the child’s age t and sex. The models were checked for goodness of
fit using the detrended Q-Q plot, Q Tests and worm plots [19].
Queries about inconsistent data were checked against
the original data collection forms and obviously erroneous measurements
were excluded (1.1%, n=221). Subjects aged <5 years or >18 years
were also excluded (n=922), as were data where the Z score
exceeded ± 5SD (n=25) [13].
Percentile curves for BMI corresponding to the 3rd,
25th, 50th, 85th and 95th percentile were constructed using the LMS method
[18]. Additionally, percentile curves passing through 23 and 28 kg/m 2
at 18 years for boys and girls were constructed. The percentile curves
passing through the points of 23 and 28 kg/m2
at 18 years are the suggested cutoff points for risk of overweight or
obesity in childhood.
For validating the cut-offs, a total of 250 children
from schools and a tertiary care pediatric endocrine clinic were selected
so that the children were distributed over the whole range of BMI
categories (adult equivalent BMI of <23, 23-25, 25-28, 28-30 and >30). A
total of 208 children agreed to participate in the study (mean age
11.4±2.9 years, 104 boys). Children from the endocrine clinic had undergone
a detailed work up to ascertain that they had no primary endocrine cause
of obesity and had only nutritional obesity. All children were assessed
with respect to anthropometry (weight, height, BMI and waist circumference
and waist to hip ratio for abdominal obesity), blood pressure and blood
parameters (fasting triglycerides, high density lipoprotein cholesterol
and plasma glucose. Children were classified as normal and hypertensive
according to age, gender and height [20]. As per the definition of
National Cholesterol Education Program III (NCEP), children were
categorized according to the number of risk factors of metabolic syndrome
(MS) detected viz. abdominal obesity (waist circumference >90th
percentile [21], hypertriglyceridemia (≥110
mg/dL), low high density lipoprotein cholesterol (≤40mg/dL),
hypertension (≥90th
percentile according to age, gender and height) and hyperglycemia (fasting
blood glucose ≥100
mg/dL) [22]. Children were categorized as normal, having one risk (MS-1)
and having ≥2
risk factors (MS>1 risk) [18]. The children were divided into five
categories using the cut-offs suggested by the current study as follows:
children with adult equivalent BMI of <23, 23-25, 25-28, 28-30 and ≥ 30 kg/m 2.
Results
We measured 19,834 children from 11 affluent schools.
After cleaning the data (removal of erroneous measurements and subjects
below 5 and above 18 years of age), 18,666 children, (10,496 boys and
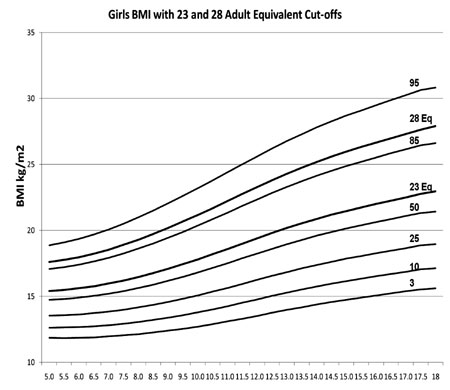
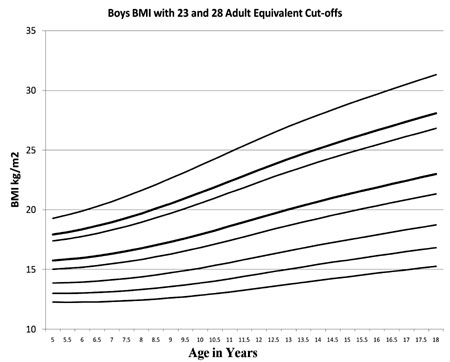
8,170 girls) from 5 zones of India were analyzed. Figure
1 and 2 show smoothed BMI percentile curves for Indian boys and
girls aged 5-17 years with the 3rd, 10th, 25th, 50th, 85th and 95th
percentiles, with two additional percentiles corresponding to a BMI of 23
and 28 kg/m 2 at 18 years. BMI
of 23 kg/m2 at 18 years age in
boys corresponds to the 64th percentile, and in girls to the 63rd
percentile. A BMI of 28 kg/m2
at 18 years age is on the 89th percentile in both boys and girls.
 |
|
Fig. 1 BMI percentile curves for Indian
boys from 5-17 years with the 3 rd,
10th, 25th, 50th, 85th and 95th percentiles, with two additional
percentiles corresponding to a BMI of 23 and 28 kg/m2 at
18 years. |
|
 |
|
Fig. 2 BMI percentile curves for Indian
girls from 5-17 years with the 3 rd,
10th, 25th, 50th, 85th and 95th percentiles, with two additional
percentiles corresponding to a BMI of 23 and 28 kg/m2 at
18 years. |
TABLE I Age specific BMI cut-off values for Risk of Overweight and Obesity Corresponding

to Adult Equivalent BMI of 23 and 28 kg/m2 at Age 18 Years for Indian Boys and Girls
| Age (years) |
Adult Equivalent |
|
BMI 23kg/m2 |
BMI 28kg/m2 |
| Boys |
Girls |
Boys |
Girls |
| 5 |
15.8 |
15.4 |
17.9 |
17.6 |
| 5.5 |
15.9 |
15.5 |
18.1 |
17.8 |
| 6 |
16 |
15.6 |
18.4 |
18 |
| 6.5 |
16.1 |
15.8 |
18.7 |
18.2 |
| 7 |
16.3 |
16 |
19 |
18.5 |
| 7.5 |
16.5 |
16.2 |
19.3 |
18.9 |
| 8 |
16.8 |
16.5 |
19.7 |
19.3 |
| 8.5 |
17 |
16.8 |
20.1 |
19.7 |
| 9 |
17.3 |
17.1 |
20.5 |
20.2 |
| 9.5 |
17.6 |
17.4 |
21 |
20.7 |
| 10 |
17.9 |
17.8 |
21.4 |
21.2 |
| 10.5 |
18.3 |
18.2 |
21.9 |
21.7 |
| 11 |
18.6 |
18.6 |
22.4 |
22.2 |
| 11.5 |
19 |
19 |
22.9 |
22.8 |
| 12 |
19.3 |
19.4 |
23.3 |
23.3 |
| 12.5 |
19.7 |
19.8 |
23.8 |
23.8 |
| 13 |
20 |
20.2 |
24.3 |
24.3 |
| 13.5 |
20.4 |
20.5 |
24.7 |
24.8 |
| 14 |
20.7 |
20.9 |
25.1 |
25.2 |
| 14.5 |
21 |
21.2 |
25.5 |
25.6 |
| 15 |
21.3 |
21.5 |
25.9 |
26 |
| 15.5 |
21.6 |
21.7 |
26.3 |
26.3 |
| 16 |
21.9 |
22 |
26.7 |
26.7 |
| 16.5 |
22.2 |
22.3 |
27 |
27 |
| 17 |
22.4 |
22.5 |
27.4 |
27.3 |
| 17.5 |
22.7 |
22.8 |
27.7 |
27.6 |
| 18 |
23 |
23 |
28.1 |
27.9 |
Table I gives suggested age specific BMI
cut-off values corresponding to adult equivalent BMI of 23 and 28 kg/m 2
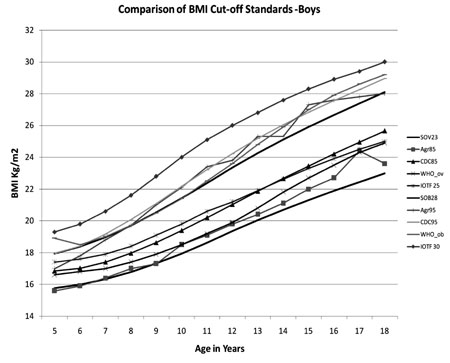
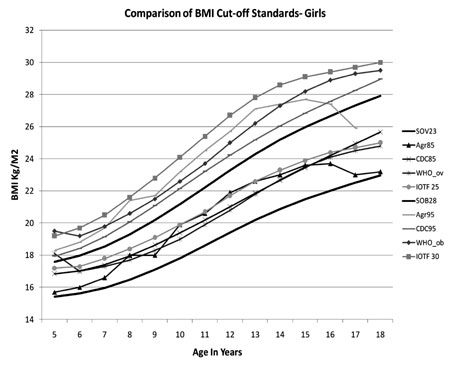
at age 18 years age for Indian boys and girls. Fig. 3
and Fig. 4 show a comparison between the BMI
cut-off’s for overweight and obesity as suggested by the IAP 2007
guidelines, the CDC 2000, WHO charts, the IOTF and the present study for
boys and girls. Except at five years of age, the IOTF cut-offs are highest
and those suggested by the current study are the lowest.
 |
|
Fig. 3 Comparative BMI cut-off’s
for overweight as suggested by the IAP 2007 guidelines, the CDC
2000, WHO charts, the IOTF and the present study for boys. |
 |
|
Fig. 4 Comparative BMI cut-off’s for
overweight and obesity as suggested by the IAP 2007 guidelines, the
CDC 2000, WHO charts, the IOTF and the present study for boys. |
Figure 4 shows the percentage of children who
were normal, had one risk and had greater than one risk for metabolic
syndrome in the five BMI categories (<23, 23-25, 25-28, 28-30 and >30) in
the group of 208 children assessed for validating the cut-offs . While
around 5% of the children with an adult equivalent BMI of less than 23 had
one or more than one risk factor for MS, this percentage increased
progressively with increasing BMI category (43%, 47%, 72% and 80% in the
BMI category of adult equivalent BMI of 23-25, 25-28, 28-30 and >30 kg/m 2,
respectively).
Discussion
We have presented age and sex-specific BMI cut-offs for
Indian children, based on a reference population of urban affluent
children measured from June 2007 to January 2008, such that the cut-offs
are linked to the adult accepted BMI of 23 and 28 kg/m 2
for overweight and obesity for Asians. The BMI values suggested by this
study are comparable and at certain ages lower than those suggested by the
IAP 2007 Guidelines [22] and lower than other suggested cut-offs [23-25].
With the rising incidence of childhood obesity in
children the world over using the 85th and 95th percentile of the
population as cut-offs for overweight and obesity is likely to result in
underestimation of childhood obesity. Various methods have thus been used
to avoid the influence of unhealthy weights for length/height on BMI
reference curves. While constructing the WHO curves for school-age
children from 5-18 years observations falling above +2 SD of the
sample median for weight for height were excluded prior to constructing
the charts [23]. When the CDC 2000 growth curves were developed, data from
the NHANES III survey for children greater than or equal to 6 years of age
were excluded from the charts for weight-for-age, weight-for-stature, and
BMI-for-age as the prevalence of overweight was nearly double that seen in
earlier surveys [1]. In the present study we did not use the approach
suggested by the WHO because the cut-off of +2 SD for weight for height is
arbitrary and also for the technical reason that LMS data for calculation
of SD scores for weight-for-height for children from 5-18 years by the WHO
were not available. We also could not use the approach used by the CDC, as
all children in the present study were measured in a time period of 8
months and omitting data from the dataset as per an arbitrary cut-off
would have disturbed the regional representation of the study. Thus, we
used an external criterion, adult-linked BMI, to generate BMI cut-off
values for 5-17 year-old Indian children.
To develop an internationally acceptable definition of
childhood overweight and obesity that was less arbitrary and more
internationally acceptable, Cole, et al. used six large nationally
representative cross-sectional growth studies and for each survey
percentile curves were drawn that at age 18 years passed through the
widely used cut-off points of 25 and 30 kg/m 2
for adult overweight and obesity [26]. However, a WHO expert consultation
has reviewed scientific evidence which suggests that Asian populations
have different associations between BMI, percentage of body fat, and
health risks compared to Europeans. They concluded that the proportion of
Asians with a highrisk of type 2 diabetes and cardiovascular disease is
substantial at BMIs lower than the existing WHO cut-off of 25 kg/m2
for overweight [27-29]. Studies have also indicated that body fat
percentage in Indian children and adolescents as measured by
bio-electrical impedance analyser and by dual emission x-ray
absorptiometry is higher than in their Western counterparts [30]. Snehlata,
et al. have thus suggested that a cut-off of 23 and 28 kg/m2
be used for classifying Indian adults as overweight and obese,
respectively [31]. In a study to evaluate definitions of the metabolic
syndrome in adult Asian Indians Misra, et al., have also suggested
that the BMI cut-offs be lowered to 23 kg/m2,
they additionally suggest lowering the waist circumference cut-offs to 90
cm in men and 80 cm in women, and the subscapular skinfold thickness
cut-off to18 mm [32,33]. Validating the cut-offs suggested by this study
on 250 children, we found that around 43% children in the adult equivalent
BMI category of 23-25 kg/m2
had ≥1 risk
factor for development of the MS. Thus, if the adult equivalent of 25 kg/m2
was used as a cut-off for overweight, these children would be misdiagnosed
as normal. Similarly, around 73% children in the BMI category of adult
equivalent of 28-30 kg/m2 had ≥1 risk factor
for developing the MS and would be classified as overweight rather than
obese if an adult equivalent cut-off of 30 kg/m2
were to be used.
In a study to evaluate carotid arterial stiffness in
obese and healthy Indian children, Pandit, et al. have reported
that the stiffness, pulse wave velocity and elastic modulus of the right
carotid artery were significantly higher in obese and overweight children
suggesting that functional changes in the carotid artery start very early
in life [31]. Thus, there is a need to identify children at a risk of
overweight and obesity at an early age to avoid further cardiovascular
complications.
In conclusion, we have presented age and sex-specific
BMI cut-offs for Indian children, based on a reference population of urban
Indian affluent children, such that the cut-offs are linked to the adult
accepted BMI of 23 and 28 kg/m 2
for overweight and obesity for Asians. The BMI values suggested here are
likely to pick up obesity early and prevent future complications occurring
due to childhood obesity.
Acknowledgments: Professor T J Cole, ScD, MRC
Centre of Epidemiology for Child Health, UCL Institute of Child Health,
London, UK for his advice on the project.
Contributors: All authors contributed to the study
design, data collection, data analyses, and manuscript preparation.
Competing interests: None stated; Funding:
None.
|
What is Already Known?
•
Asian Indians are a high risk
group for type 2 diabetes and cardiovascular disease at BMIs lower
than the international WHO cut-off of 25 kg/m2 for overweight and
30 kg/m2 for obesity.
What This Study Adds?
•
Age and sex-specific BMI cut-offs for Indian children from
5-17 years are presented, such that the cut-offs are linked to the
adult accepted BMI of 23 and 28 kg/m2 for overweight and obesity
for Asians.
|
References
1. Weiss R, Caprio S. The metabolic consequences of
childhood obesity. Best Pract Res Clin Endocrinol Metab. 2005;19:405-19.
2. Kapil U, Singh P, Pathak P, Dwivedi SN, Bhasin S.
Prevalence of obesity among affluent adolescent school children in Delhi.
Indian Pediatr. 2002;39:365-8.
3. Sidhu S, Kaur N, Kaur R. Overweight and obesity in
affluent school children. Ann Hum Biol. 2006;33:255-9.
4. Chhatwal J, Verma M, Rair SK. Obesity among
pre-adolescent and adolescents of a developing country (India). Asia Pac J
Clin Nutr. 2004;13:231-5.
5. Sharma A, Sharma K, Mathur KP. Growth pattern and
prevalence of obesity among affluent school children in Delhi. Public
Health Nutr. 2007;10:485-91.
6. Bose K, Bisai S, Mukhopadhyay A, Bhadra M.
Overweight and obesity among affluent Bengalee schoolgirls of Lake Town,
Kolkata, India. Matern Child Nutr. 2007;3:141-5.
7. Berenson GS, Srinivasan SR, Wattigney WA, Harsha DW.
Obesity and cardiovascular risk in children. Ann NY Acad Sci.
1993;699:93103.
8. Berenson GS, Srinivasan SR, Bao W, Newman WP, Tracy
RE, Wattigney WA. Association between multiple cardiovascular risk factors
and athero sclerosis in children and young adults. The Bogalusa heart
study. New Engl J Med. 1998;338:16506.
9. Mahoney LT, Burns TL, Stanford W. Coronary risk
factors measured in childhood and young adult life are associated with
coronary artery calcification in young adults: the Muscatine study. J Am
Coll Cardiol. 1996;27:27784.
10. Malina RM, Katzmarzyk PT. Validity of the body mass
index as an indicator of the risk and presence of overweight in
adolescents. Am J Clin Nutr. 1999;70:1316S.
11. Barlow SE, Dietz WH. Obesity Evaluation and
Treatment: Expert Committee Recommendations. The Maternal and Child Health
Bureau, Health Resources and Services Administration and the Department of
Health and Human Services. Pediatrics. 1998;102:29
12. Buckler JMH. Growth disorders in Children. 1st ed.
London: BMJ Publishing Group; 1994.
13. Khadilkar VV, Khadilkar AV, Cole TJ, Sayyad MG.
Cross-sectional growth curves for height, weight and body mass index for
affluent Indian children, 2007. Indian Pediatr. 2009; 46:477-89.
14. Bellizzi MC, Dietz WH. Workshop on childhood
obesity: summary of the discussion. Am J Clin Nutr. 1999;70:1735.
15. Snehalata C, Vishwanathan V, Ramachandran A. Cutoff
value for normal anthropometric variables in Asian Indian adults. Diabetes
Care. 2003;26:1380-4.
16. Ministry of Urban Development (Lands Division),
Government of India. Letter No. J-220 11/1/91-LD.
17. Van’t Hof MA, Wit JM, Roede MJ. A method to
construct age references for skewed skinfold data,using Box-Cox
transformations to normality. Hum Biol. 1985;57:131-9.
18. Cole TJ, Green PJ. Smoothing reference
centilecurves: the LMS method and penalized likelihood. Stat Med.
1992;11:1305-19.
19. Van Buuren S, Fredriks, M. Worm plot: a simple
diagnostic device for modeling growth Reference curves. Stat Med.
2001;20,1259-77.
20. National High Blood Pressure Education Working
Group: The fourth report on the diagnosis, evaluation, and treatment of
high blood pressure in children and adolescents. Pediatrics.
2004;114:555-76.
21. Executive Summary of the Third Report of the
National Cholesterol Education Program (NCEP) Expert Panel on Detection,
Evaluation, and Treatment of High Blood Cholesterol In Adults (Adult
Treatment Panel III). JAMA. 2001;285:2486-97.
22. Khadilkar VV, Khadilkar AV, Choudhury P, Agarwal KN,
Ugra D, Shah NK. IAP growth monitoring guidelines for children from birth
to 18 years. Indian Pediatr. 2007;44: 187-97.
23. de Onis M, Onyango AW, Borghi E, Siyam A, Nishida
C, Siekmann J. Development of a WHO growth reference for school-aged
children and adolescents. Bull World Health Organ. 2007;85:660-7.
24. Kuczmarski RJ, Ogden CL, Guo SS, Grummer-Strawn LM,
Flegal KM, Mei Z, et al. 2000 CDC growth charts for the United
States: methods and development. Vital Health Stat 11. 2002;246:1-190.
25. International Obesity Task Force. Obesity:
preventing and managing the global epidemic. Report of WHO consultation on
obesity, Geneva, 3-5 June 1998. Geneva: WHO; 1998.
26. Cole TJ, Bellizzi MC, Flegal KM, Dietz WH.
Establishing a standard definition for child overweight and obesity
worldwide: international survey. BMJ. 2000;320:1240-3.
27. Mckeigue PM, Shah B, Marmot MG. Relationship of
central obesity and insulin resistance with high diabetes prevalence and
cardiovascular risk in South Asians. Lancet. 1991;337:382-6.
28. Banerji MA, Faridi N, Atluri R, Chaiken RL,
Lebovitz HE. Body composition, visceral fat, leptin and insulin resistance
in Asian Indian men. J Clin Endocrinol Metab. 1999;84: 137-44.
29. Enas EA, Yusuf S, Mehta JL. Prevalence of coronary
artery disease in Asian Indians. Am J Cardiol. 1992;70:945-9.
30. Pandit D, Chiplonkar S, Khadilkar A, Khadilkar V,
Ekbote V. Body fat percentages by dual-energy X-ray absorptiometry
corresponding to body mass index cutoffs for overweight and obesity in
Indian children. Clinical Medicine: Pediatrics. 2009;3:55-61.
31. Pandit D, Kinare A, Chiplonkar S, Khadilkar A,
Khadilkar V. Carotid arterial stiffness in overweight and obese Indian
children. J Pediatr Endocrinol and Metab.2011;24:97-102.
32. Misra A, Wasir JS, Pandey RM. An evaluation of
candidate definitions of the metabolic syndrome in adult Asian Indians.
Diabetes Care. 2005;28:398-403.
33. Misra A, Misra R, Wijesuriya M, Banerjee D. The
metabolic syndrome in South Asians: continuing escalation and possible
solutions. Indian J Med Res. 2007;125:345-54.
|
|
|
 |
|

