|
|
|
Indian Pediatr 2020;57: 124-128 |
 |
Impact of Using Different Growth References
on Interpretation of Anthropometric Parameters of Children Aged
8-15 Years
|
|
Preeti Singh1, Sonal Gandhi1, Rajeev Kumar
Malhotra2 and Anju Seth1
From Department of 1Pediatrics,
Lady Hardinge Medical College and Kalawati Saran Children’s Hospital;
and 2Delhi Cancer Registry, BR Ambedkar IRCH, All India
Institute of Medical Sciences; New Delhi, India.
Correspondence to: Dr Anju Seth,
Director Professor, Department of Pediatrics, Lady Hardinge Medical
College and Kalawati Saran Children’s Hospital, New Delhi 110 001,
India.
Email: [email protected]
Received:
June 11, 2019;
Initial review: July 29, 2019;
Accepted: December 03, 2019.
|
|
Objective: To compare the effect
of the application of three growth references (Agarwal, 1992; Indian
Academy of Paediatrics (IAP), 2015; and World Health Organisation (WHO),
2007) on interpretation of anthropometric parameters in schoolchildren.
Setting: Cross-sectional
school-based study.
Participants: Children 8-15 years
studying in one government school and one private school of Delhi.
Procedure: The age- and
gender-specific standard deviation scores of height-for-age and
BMI-for-age were estimated for each student enrolled, using the three
growth references independently.
Main outcome measure: The
proportion of children with short stature, thinness and overweight/
obesity determined by each growth reference were compared.
Results: A total of 1237 students
participated in the study. A significantly higher proportion of children
(both sexes) were classified to have short stature using WHO 2007
reference (8.8%) as compared to the Agarwal (3.3%) charts and IAP, 2015
references (3.6%). The combined prevalence of overweight and obesity was
highest (34.8%) by the IAP, 2015 reference as against 32% by Agarwal
charts and 29.1% by WHO, 2007 reference. Good agreement existed between
the IAP, 2015 reference and Agarwal charts in classifying subjects into
different BMI categories (Kappa=0.82) and short stature (Kappa=0.99).
Conclusions: In view of
differences noted, use of national population derived reference data is
suggested to correctly define growth trajectories in children.
Keywords: Comparison, Growth charts, Obesity,
Short stature.
|
|
A
nthropometry is the universally accepted tool for
the assessment of a child’s growth and nutritional status. The
anthropometric parameters of an individual are interpreted by comparing
with the age- and sex-matched reference data. The interpretation of an
individual child’s anthropometric parameters would depend upon the
reference data used. Clinicians often face a dilemma on the choice of
growth reference for anthropometric assessment among the different
national and international growth references/standards available.
International consensus exist on the use of the World Health
Organization (WHO) Child Growth Standards derived from the multi-centric
growth reference study for assessing growth of children up to 5 years of
age [1]. However, there is no similar multi-nation data for children
beyond five years of age, and most nations use local population-derived
reference data for this age group. In India, the growth reference charts
developed by Agarwal, et al. [2] are more than two decades old.
The newer Indian Academy of Pediatrics (IAP) growth references [7] for
Indian children 5-18 years are based on collated national data generated
during last 10 years [7]. Besides, there exist the International WHO
growth reference charts for children 5-19 years of age, which are
primarily based on growth of American children [8,9]. The availability
and use of multiple references for clinical and research purposes can
create confusion amongst healthcare providers and difficulty in correct
interpretation of epidemiological and research data. A difference in
prevalence of stunting, wasting, and thinness in school children from
low income countries was reported on application of WHO, 2007 and NCHS
growth references [10]. Similar inferences were drawn when the
prevalence of overweight and obesity in school children was compared
using the WHO charts, Agarwal charts and International Obesity Task
Force (IOTF) growth reference charts [11].
We compared the effect of the application of three
different growth references; that developed by Agarwal, et al.
[2] (Agarwal reference), IAP growth reference, 2015 [7] (IAP 2015) and
the WHO growth reference [9] (WHO 2007) on estimation of proportion of
school children (aged 8-15 years) classified as having short stature,
thinness, severe thinness, overweight, and obesity.
Methods
This cross-sectional study was conducted in July 2016
on schoolchildren aged 8-15 completed years, studying in 3 rd-10th
grades at two schools in northern Delhi. We selected a government and a
private school to enable enrollment of children belonging to different
socio-economic strata and diverse nutritional status. Children suffering
from systemic illnesses or who had undergone a major surgical procedure
likely to interfere with the growth, and those with obvious skeletal or
neurological problem hindering evaluation of physical growth were
excluded. A prior permission from school authorities was obtained.
Passive parent consent and verbal student assent was also taken prior to
enrollment in the study. The parents were given a patient information
sheet containing the relevant details of the study and their written
consent taken. The study protocol was approved by the Institutional
Ethics Committee.
Prior to the start of the study, one researcher was
trained to measure the bodyweight and height using standard procedures.
The investigator collected the date of birth of the enrolled subjects
from the school records. Using standardized equipment and techniques,
the weight and height of all children fulfilling the inclusion criteria
were recorded. The weight was recorded to the nearest 0.1 kg using
electronic digital weighing machine without footwear and minimal
clothing. Height was measured to the nearest 0.1 cm using a portable
stadiometer (Seca 222; Seca GmbH & Co. Germany). Body Mass Index (BMI)
was calculated by standard formula.
Using each of the three growth references - Agarwal
reference [2], IAP 2015 [7] and WHO 2007 [9], age- and gender-specific
standard deviation scores (SDS) of height-for-age (HFA-SDS) and
BMI-for-age (BMI-SDS) were calculated for all students. Children with
HFA-SDS < –2 were considered to have short stature across each of the
three reference charts. Definition of thinness/obesity varies among the
different references. For WHO 2007 reference, subjects with BMI-SDS <-2
were considered thin, with BMI-SDS between 1 and 2 as overweight and >2
as obese [12,13]. For IAP 2015 and Agarwal reference charts, the cutoff
of BMI/age <3 rd percentile
and <5th percentile,
respectively were used to define thinness [27]. The cutoff of BMI/age at
23rd adult equivalent (71st centile in boys and 75th centile in girls)
and 27th adult equivalent (90th centile in boys and 95th centile in
girls) was applied to classify overweight and obesity, respectively
according to the IAP 2015 reference charts. As per the Agarwal charts,
overweight and obesity were defined by the BMI /age cut off between 85th
and 95th centile and >95th centile, respectively. The proportion of
children with short stature, thinness, overweight or obesity obtained on
applying each of the three growth references was compared.
Statistical analyses: The data was analyzed by
statistical software SPSS version 20 (IBM Crop, Armonk, NY). For the
purpose of statistical inference, a 2-year interval was used to show the
height and BMI distribution of the subjects enrolled. The three-way
ANOVA test was applied to evaluate the differences in the growth
parameters between the students of the government school and private
school across different age intervals on using the three different
growth references. The McNemar test was applied for height variable and
McNemar-Bomker test was applied for the BMI to assess the agreement
between the two reference charts. A linear mixed model with suitable
covariance structure on the basis of minimum Akaike’s Information
Criteria (AIC) was applied to compare the mean (SD) score
obtained by the use of different reference charts and to assess whether
mean Z score difference is influenced by gender. The Kappa statistic
value was adjusted when prevalence and bias influenced the Kappa
statistic. A P-value less than 0.05 was considered as
statistically significant.
Results
Of the 1256 students screened from the two schools,
1237 students (767 boys) participated in the study; 16 students were
excluded because either the date of birth was unknown or the age was
more than 16 years. Data pertaining to three students was removed as
outliers because they were severely obese (BMI >35 kg/m 2).
The proportion of students enrolled from the government school was
46.6%. The age and sex distribution, and height and BMI of the children
is summarized in Web Table I. The mean SDS for height and
BMI among children in government and private school across all age
groups and both sexes were significantly different on application of the
three growth reference charts (Web Table II, III).
The mean SDS for HFA and BMI for age determined using
the three growth references is given in Table I. Linear
mixed model revealed no significant difference between genders among the
three growth references. However, the mean SDS of HFA estimated by WHO
2007 reference was significantly lower than the Agarwal and IAP 2015
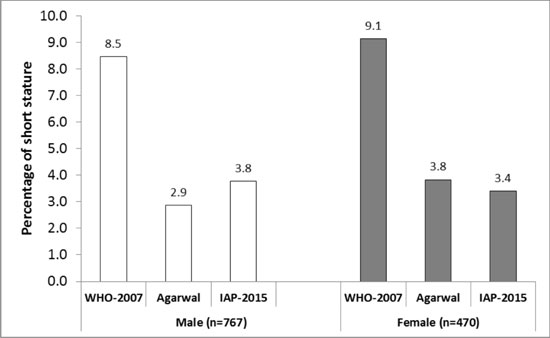
references (P<0.001). Thus, a significantly higher proportion of
children (both sexes) were classified to have short stature using WHO
2007 reference (8.8%) as compared to the Agarwal (3.3%) and IAP 2015
references (3.6%) (Fig. 1). The visual comparison of
distribution of height for age and BMI for age SDS among the three
growth references along with the normal SDS is presented (Web Fig.
1 and 2).
TABLE I	Comparison of Standard Deviation Scores of Height for Age and BMI for Age of Children Aged 8-15 Years
Using Three Different Growth Reference Charts (N=1237)
|
Variable |
WHO, 2007 [9] |
Agarwal, 1992 [2] |
IAP, 2015 [7] |
|
Height for age |
|
|
|
|
Girls |
-0.46 (1.19) |
0.45 (1.55) |
0.16 (1.16) |
|
Boys |
-0.35 (1.24) |
0.44 (1.23) |
0.08 (1.18) |
|
Total |
-0.41 (1.22) |
0.44 (1.36) |
0.11 (1.17) |
|
BMI for age |
|
|
|
|
Girls |
0.07 (1.43) |
0.41 (1.31) |
0.25 (1.17) |
|
Boys |
-0.06 (1.68) |
0.66 (1.60) |
0.12 (1.15) |
|
Total |
-0.02 (1.60) |
0.56 (1.50) |
0.17 (1.16) |
|
*All values in mean (SD); P<0.001 for all comparisons between
WHO, 2007 [9] vs IAP, 2015 [7] and Agarwal [2] vs IAP 2015; WHO:
World Health Organization; IAP: Indian Academy of Pediatrics. |
 |
|
Fig. 1 Proportion of children aged
8-15 years with short stature using three different growth
reference charts.
|
 |
|
Fig. 2 Body mass index (BMI)
categories in children aged 8-15 years using three different
growth reference charts.
|
Figure 2 shows the comparison of the BMI
categories in boys and girls using the three growth reference charts.
Among boys, the IAP reference classified the maximum proportion with
obesity (17.7%), while the Agarwal charts identified the highest
proportion of overweight (20.6%) children. In girls, the IAP reference
reported highest proportion with overweight (21.7%) and obesity (13.4%).
The combined prevalence of overweight and obesity was highest (34.8%) by
the IAP 2015 reference as against 32.0% by Agarwal charts and 29.1% by
WHO2007 reference. The proportion of children (boys and girls combined)
classified as obese was maximum (16.1%) by IAP 2015 as compared to 12.1%
and 10.9% by Agarwal and WHO 2007 references, respectively. The IAP 2015
reference classified least proportion of children with thinness (2.4%)
as compared to Agarwal reference (4.4%) and WHO 2007 reference (11.2%).
The degree of agreement in classifying subjects into different BMI
categories was best between the IAP 2015 and Agarwal references
(Kappa=0.82), followed by WHO and Agarwal (Kappa=0.75) and least with
WHO and IAP references (Kappa=0.60).
Discussion
The comparative assessment of anthropometric para-meters
in school children using three different growth references yielded the
following key observations. The low mean SDS of HFA by WHO 2007
reference resulted in classifying higher proportion of children with
short stature as compared to IAP 2015 and Agarwal reference. Application
of WHO 2007 reference also led to diagnosing higher proportion of
children with thinness as compared to the IAP 2015 reference. Use of IAP
2015 reference accounted for a greater proportion of children classified
with overweight and obesity as compared to Agarwal and WHO 2007
references. Amongst the three growth reference charts, a good
concurrence existed between Agarwal and IAP 2015 references in
identification of short stature, thinness, and overweight/obesity.
The primary limitation of this study was the lack of
assessment of the divergent growth pattern observed in adolescents with
the attainment of puberty. Also, since the objective was primarily to
compare the three growth references, results on interpretation of
anthropometric data cannot be generalized to represent nutritional
status of children in this area.
The higher HFA-SDS of the subjects on application of
IAP 2015 reference charts as compared to WHO 2007 reference shows that
the Indian children are shorter than their Caucasian counterparts.
Similar inference was drawn after the publication of the IAP 2015 growth
reference charts [7,9]. Use of WHO charts will thus lead to an increase
in diagnosis of short stature, creating undue anxiety among parents and
unnecessary referrals to the health facility. The higher mean HFA-SDS
obtained on application of Agarwal reference as compared to IAP 2015
reflects the secular trends in height in India over the past two
decades, and is consistent with previous observations [15,16].
The WHO 2007 reference classified participants in
lower weight strata compared to the IAP 2015 and Agarwal references.
This led to diagnosing higher proportion of children with thinness by
WHO references as compared to the other two references. Likewise,
application of WHO 2007 references underestimated the proportion of
overweight and obese children among the study group as compared to that
obtained by applying IAP 2015 charts. This can lead to missing the
opportunity of identifying these children and offering them appropriate
screening and management. The IAP 2015 BMI centiles/Z scores are lower
as compared to Agarwal Z scores in Agrawal charts, indicating a
steep rise in obesity/overweight in recent times [6,16]. Thus,
application of a similar criteria of 85th and 95th centile to define
overweight and obesity as used by Agarwal, et al. [2] would have
led to a much lower proportion of children being identified with these
conditions on application of IAP 2015 reference. This has been taken
care of in the IAP reference by linking the definition of overweight and
obesity to adult BMI equivalent of 23 and 27, respectively. This led to
lowering of cut-off for defining, and a corresponding higher detection
rate of overweight and obesity by IAP 2015 reference. A rise in the
weight and BMI centiles of both boys and girls on application of recent
reference data from India as compared to Agarwal reference charts has
been reported by Khadilkar, et al. [15] and Marwaha, et al.
[6].
The present study brings out the impact of using
updated national growth reference charts on interpretation of
anthropometric data of older children and adolescents. We conclude that
IAP 2015 growth reference remains in excellent agreement with Agarwal
reference for recognition of short stature while identifying less
children with short stature and more children with overweight and
obesity as compared to WHO 2007 reference. This will have an impact on
screening and management of children with both short stature and
overweight/obesity.
Contributors: PS: execution of the study,
data analysis and writing the manuscript; SG: execution of the study and
writing the manuscript; RKM: contributed in execution of the study, data
analysis and writing the manuscript and AS: conceptualized the paper,
was overall responsible for quality of data collection and maintenance,
modified and finalized the draft.
Funding: None; Competing interest: None
stated.
References
1. de Onis M, Garza C, Onyango AW, Martorell R, eds.
WHO child growth standards. Acta Paediatrica. 2006; 450:S1-101.
2. Agarwal DK, Agarwal KN, Upadhyay SK, Mittal R,
Prakash R, Rai S. Physical and sexual growth pattern of affluent Indian
children from 5-18 years of age. Indian Pediatr. 1992;29:203-82.
3. Agarwal DK, Agarwal KN. Physical growth in Indian
affluent children (Birth-6 years). Indian Pediatr. 1994;31:377-413.
4. Khadilkar VV, Khadilkar AV, Choudhury P, Agarwal
KN, Ugra D, Shah NK. IAP growth monitoring guidelines for children from
birth to 18 years. Indian Pediatr. 2007;44:187-97.
5. Khadilkar VV, Khadilkar AV, Chiplonkar SA. Growth
performance of affluent Indian preschool children: a comparison with the
new WHO growth standard. Indian Pediatr. 2010;47:869-72.
6. Marwaha RK, Tandon N, Ganie MA, Kanwar R,
Shivaprasad C, Sabharwal A, et al. Nationwide reference data for
height, weight and body mass index of Indian school children. Natl Med J
India. 2011;24:269-77.
7. Indian Academy of Pediatrics Growth Charts
Committee, Khadilkar V, Yadav S, Agrawal KK, Tamboli S, Banerjee M, et al. Revised
IAP growth charts for height, weight and body mass index for 5- to
18-year-old Indian children. Indian Pediatr. 2015;52:47-55.
8. WHO Multicentre Growth Reference Study Group. WHO
Child Growth Standards: Methods and Development. Length/height-forage,
weight for-age, weight-for-length, weight-for-height and body mass
index-for age: methods and development. http://www.who.int/childgrowth/standards/technical_report/en/index.html. Accessed
September 10, 2019.
9. de Onis M, Onyango AW, Borghi E, Siyam A,
Nishida C, Siekmann J, et al. Development of a WHO growth
reference for school-aged children and adolescents. Bull World Health
Organ. 2007;85:660-7.
10. Rousham EK, Roschnik N, Baylon MA, Bobrow EA,
Burkhanova M, Campion MG, et al. A comparison of the National
Center for Health Statistics and new World Health Organization growth
references for school-age children and adolescents with the use of data
from 11 low-income countries. Am J Clin Nutr. 2011;94:571-7.
11. Stigler MH, Arora M, Dhavan P, Tripathy V, Shrivastav
R, Reddy KS, et al. Measuring obesity among school-aged youth in
India: A comparison of three growth references. Indian Pediatr.
2011;48:105-10.
12. Cole TJ, Bellizzi MC, Flegal KM, Dietz WH.
Establishing a standard definition for child overweight and obesity
worldwide: International survey. BMJ. 2000, 320: 1240-43.
13. Cole TJ, Flegal KM, Nicholls D, Jackson AA. Body
mass index cut offs to define thinness in children and adolescents:
International survey. BMJ. 2007;335:194.
14. Sim J, Wright CC. The Kappa statistic in
reliability studies: Use, interpretation, and sample size requirements.
Physical Therapy. 2005;85:257-68.
15. Khadilkar VV, Khadilkar AV, Cole TJ, Sayyad MJ.
Cross-sectional growth curves for height, weight and body mass index for
affluent Indian children, 2007. Indian Pediatr 2009;46:477-89.
16. Sharma A, Sharma K, Mathur KP. Growth pattern and
prevalence of obesity in affluent school children of Delhi. Public
Health Nutr. 2007;10:485-91.
|
|
|
 |
|
