| |
|
Correspondence Indian Pediatrics 2007; 44:154 |
|||
|
The W-H Index Revisited |
|||
|
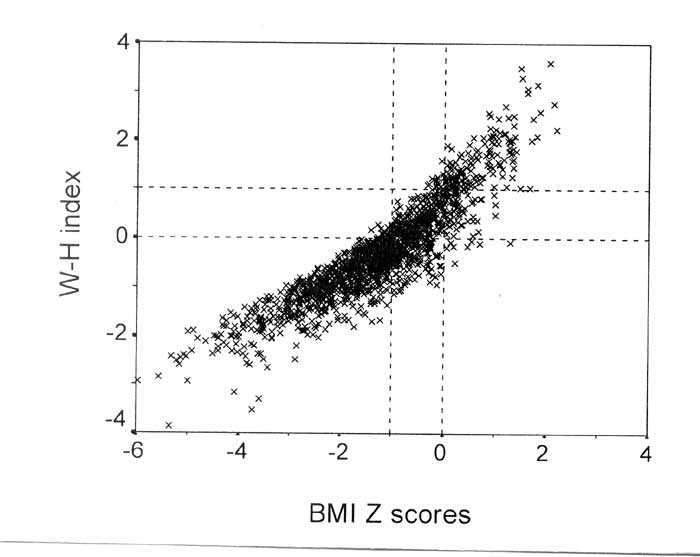
We examined a 4 year follow up of 759 healthy Bengali Indian adolescents (416 boys, 343 girls) of age 11-16 years with normal nutrition to obtain 1730 data points (970 males) in linked cross sectional analysis(3). Height, weight and BMI Z scores and W-H indices were calculated using US normative data. The mean (SD) BMI Z score was –1.2 (1.2), and the mean (SD) W-H index was –0.3 (0.9). The W-H index was in strong correlation with BMI Z scores (Fig.1, r = 0.9, p < 0.001), in keeping with other observations(1). However, in our study, the W-H index was in stronger correlation with weight (r = 0.5, p <0.001), than with height (r = –0.3, p <0.001), contrary to that in Dutch children.
In Fig.1, most BMI Z scores were <+2; these children were, therefore, not obese by US criteria. However, 33% of W-H indices were >0 [mean (SD) 0.7 (0.6)], and 10% were >+1 [mean (SD) 1.5 (0.5)]. The subgroup with W-H index >+1, contained 10% of the highest BMI Z scores [mean (SD) 0.6 (0.5)] and 52% values within the highest BMI Z score quintile [mean (SD) 1.0 (0.7)]. W-H index >0 had a sensitivity of 95% and a specificity of 82% to detect a BMI Z score of –1 in receiver operator characteristic plots. With increasing BMI Z scores, specificity increased but sensitivity of detection decreased. At BMI Z scores of –0.5 and 0, the respective sensitivities were 71% and 42% and specificities were 95% and 99%. We therefore anticipate use of the W-H index to identify relatively obese Indian children, even if BMI Z scores using US normative data are misleadingly low. This tool needs to be tested in comparison with locally derived centiles, adjusted for parental heights and validated against surrogates of adiposity (such as lipid profiles) and objective measures of fat mass determination. Indraneel Banerjee,
|
![]()