|
|
|
Indian Pediatr 2009;46: 1055-1062 |
 |
Accelerometers for Measuring Physical Activity
Behavior in Indian Children |
|
GV Krishnaveni, *IC Mills, SR Veena,
†SA Wootton,
*AK Wills,
*PJ Coakley,
*DJ Fisher, S Shobha, SC Karat and *CHD
Fall
From the CSI Holdsworth Memorial Hospital, Mysore, India;
*MRC Epidemiology Resource Center,
University of Southampton, UK; and †Department of Human Nutrition,
University of Southampton, UK.
Correspondence to: Dr GV Krishnaveni, PO Box 38, CSI
Holdsworth Memorial Hospital,
Mandi Mohalla, Mysore, India.
Email: [email protected]
Received: April 21, 2008;
Initial review: July 2, 2008;
Accepted: December 22, 2008.
Published online 2009 April 1.
PII: S097475590800321-1
|
|
Abstract
Objective: To examine the validity of
accelerometers for characterizing habitual physical activity patterns in
Indian children.
Design: Cohort study.
Setting: Holdsworth Memorial Hospital, Mysore.
Subjects: Children (N=103, mean age 6.6
years) selected from an ongoing birth cohort study.
Methods: Physical activity was measured over 7
days using accelerometers (MTI Actigraph) and concurrent
parent-maintained activity diaries. Actigraph counts per minute
representing sedentary (<10), light (<400), moderate (<3000) and
vigorous (³3000) activity were
determined using a structured activity session in a separate group of 10
children. In 46 children chosen for validating accelerometers, time
spent in different activity levels according to diaries was determined.
Energy Expenditure (EE) was calculated from diaries using a factorial
method.
Results: Ninety-eight children wore the monitor
for ³4 days. Total counts and time
spent in different activity levels were similar in boys and girls (P>0.2).
Among 46 children chosen for comparisons, time spent in sedentary (r
=0.48, P=0.001), light (r=0.70, P<0.001) and
moderate activities (r=0.29, P=0.054) according to diaries
correlated with those derived from counts, and total Actigraph counts
correlated with EE (r=0.42, P=0.004). Bland-Altman
analysis showed systematic bias, and wide limits of agreement between
these methods for time spent in different activity levels.
Conclusions: Accelerometers are a well tolerated
and objective way of measuring activity behavior in free-living
children. Though accelerometer counts correlate with time spent in
activity of varying intensity and energy expenditure derived from
parent-maintained diaries, wide limits of agreement show that the
limitations of accelerometers need to be recognized in interpreting the
data that they generate.
Keywords: Accelerometers, Activity diaries, Child, India,
Physical activity.
|
|
T
he low lean body mass, and high
truncal adiposity (‘thin-fat’ phenotype) of Indians(1-3) may contribute to
their high type 2 diabetes and cardiovascular disease risk(4). Rapid
urbanization has reduced the scope for physical activity contributing to
rising levels of childhood obesity(5). While in Western children, inverse
associations have been found between physical activity and both
adiposity(6) and cardiovascular risk factors(7), few studies using
objective monitoring of physical activity have been done in Indian
children.
We measured physical activity in pre-pubertal Indian
children to describe physical activity pattern using accelerometers;
establish cut-offs for time spent in sedentary, light, moderate and
vigorous activities; and compare accelerometer data in a subset of
children against activity levels and energy expenditure (EE) calculated
using diaries.
Methods
The Mysore birth cohort was established to study the
effect of gestational diabetes (GDM) on offspring risk factors(2,8,9).
Women, with known GDM status delivered live, normal babies at the
Holdsworth Memorial Hospital, Mysore (N=630, GDM=41). Offspring
anthropometry, including triceps and subscapular skinfold measurements,
was performed using standardized methods at birth, annually until 5 years,
and 6-monthly thereafter. Percentage body fat (fat%) was measured using
bio-impedance (Quadscan 4000 or 1500MDD, Bodystat, UK) from 5 years.
During 2004-2005, 105 children aged 6-7½ years were
selected from the cohort representing offspring of diabetic mothers (ODM),
sex-matched and BMI-matched children born to non-diabetic mothers, and
(also from children of non-diabetic mothers) children in the highest and
lowest fourths of 5-year subscapular skinfold distribution.
Children and their parents gave informed, verbal
consent, and the hospital ethics committee approved the study.
Accelerometers
MTI Actigraph uniaxial accelerometers (AM7164, MTI
Health Services, Florida, USA) measure body acceleration in the vertical
plane as counts. Actigraphs were set to record counts at 1-minute
intervals, and tied at the right hip to measure activity during waking
hours for 7 consecutive days during school term. Written and verbal
instructions were given to parents to remove the Actigraph during bathing,
swimming, afternoon naps and at night before the child went to bed, to
subsequently re-apply it, and to record these times. The remaining
activities were considered representative of the child’s total activity.
Time-blocks when accelerometers were removed during the representative
period were also recorded. In 46 children that we checked, this occurred
in 9 children (range 15 to 140 minutes), and on more than one day in only
one child. Three children had >60 minutes of data missing in a single day.
The data downloaded to a computer was processed using
a special software program. The first and last days were excluded, as
they were incomplete, showed artifacts related to monitor applying and
removing, or movements recorded after removal but before downloading the
data. Days with ³500
minutes of registered activity were considered representative and
included. 2 children were excluded (one ODM who refused monitoring after 1
day, and his control), leaving 103 children.
Defining activity levels of differing intensity:
Ten similar-aged children in one school (not from the cohort) performed
structured activities representing sedentary, light, moderate and vigorous
intensity-levels, for 10-minutes each, while wearing Actigraphs. These
sessions were led and paced by research staff. The data were used to
define cut-off accelerometer counts for activity levels, defined
empirically based on the average minimum and maximum counts/minute
recorded for these activities (Table I).
Table I


Range of Mean Counts Per Minute for Boys and Girls (N=10) During a Structured Activity Session

and Ranges of Counts Subsequently Selected to Represent Sedentary, Light, Moderate

and Vigorous Activities
|
|
Minimum-maximum |
Activity |
Cut off |
Corresponding activities |
|
Activity |
mean counts/child/minute |
level |
count |
|
|
|
Boys |
Girls |
|
|
|
| Sitting passive |
| watching TV |
0-3 |
0-0 |
sedentary |
<10 |
Sitting, sitting and TV watching |
| Sitting active |
| writing or drawing |
2-463 |
0-178 |
light |
10-399 |
Standing/reading-writing/travelling/eating/
drinking/drawing/singing/talking |
| Walking |
| slow to moderate speed |
592-2708 |
1292-2832 |
moderate |
400-2999 |
Playing indoor-outdoor/standing
travelling/ dancing/music playing/ walking |
| Running |
2738-8533 |
3986-4758 |
vigorous |
≥3000 |
Running/cycling/swimming/March
past/jumping |
Time spent in different activity levels in the study
children were calculated based on these cut-offs.
Diaries:Parents and teachers were requested to keep
a diary of the child’s activities simultaneously during Actigraph
monitoring. They wrote codes from a list for the predominant activity of
the child during each 15-minute period.
Sixty-six of 103 children had legible diaries of
³10
hours (11 hours –16.5 hours, mean=13.5 hours) for
³4
days. In 46 diaries, representing different groups, chosen for comparisons
with Actigraphs (39 with 6 days) activities were assigned to different
activity levels (Table I). The time of accelerometer removal
or missing information were excluded. Information was missing in 15
children (15 minutes-2 hours in a day, mean=35 min/d).
To compare total activity, Physical Activity Ratios
(PAR) were assigned to diary activities from a published compendium(10).
Basal metabolic rate (BMR) was predicted using sex- and age-specific
equations(11). EE for the recordable time was calculated by a ‘factorial
method’, based on PAR, duration of activities and BMR, and the average for
all days was calculated.
Statistical methods: Time spent vigorously active
(both methods) were log-transformed for normality. Correlations were used
to compare total counts with EE from diaries and the time spent in
different activity levels according to both methods. Agreement between
actigraphs and diaries was tested using Bland and Altman plots (activity
pattern) and kappa statistics by cross-tabulations. T-tests were
used to compare boys and girls.
Results
Table II shows the children’s anthropometry
measured at 7.5-years of age. Girls were significantly more adipose than
boys; there were no differences in other measurements.
Table II


Age and Physical Characteristics (Measured at 7.5 Years) of the Study Subjects
| |
Girls
(N max=67) |
Boys
(N max=36) |
P
|
|
Age (years) |
6.6 (0.4) |
6.6 (0.4) |
0.5 |
|
Weight (kg) |
21.7 (4.0) |
21.8 (3.2) |
0.9 |
|
Height (cm) |
121.8 (4.7) |
123.1 (5.9) |
0.2 |
| BMI
(kg/m2) |
14.5 (2.0) |
14.3 (1.3) |
0.6 |
|
*Subscapular skinfold (mm) |
8.0 (6.2,10.3) |
6.2 (4.9,7.5) |
0.002 |
|
Triceps skinfold (mm) |
10.4 (3.5) |
7.4 (2.1) |
<0.001 |
|
Fat % (Bioimpedance) |
28.3 (5.7) |
21.7 (5.2) |
<0.001 |
Values presented are mean (SD) and *geometric mean (IQR), P for the difference between boys and girls.
|
Periods of registered activity ranged from 2 days (N=1)
to 6 days (N=76);
³4
days were available for 98 (95%) children. All available days were used
for analysis. Average registered time was 774 minutes/day (~13 hours, 579
minutes-936 minutes). Children spent <20 minutes/day in vigorous
activities. Boys and girls were similar in activity counts, and time spent
in sedentary, light, moderate and vigorous activities but boys accumulated
a higher percentage of total counts in vigorous activity, and girls a
higher percentage of total counts in light activity (Table III).
Table III


Actigraph Measured Mean Total Counts and Physical Activity Levels in the Study Subjects
| |
Girls (N max=67) |
Boys (N max=36) |
P |
|
Total counts |
403813.1 (110313) |
414372.5 (107388) |
0.6 |
|
Counts/ minute |
523.6 (137.3) |
537.6 (145.0) |
0.6 |
|
Registered daily activity time (min) |
769.5 (71.1) |
777.9 (72.8) |
0.6 |
|
Sedentary activity (min) |
153.0 (44.3) |
155.7 (50.2) |
0.8 |
|
% of registered time |
19.9% (5.6) |
20.1% (6.4) |
0.9 |
|
*% of counts accumulated |
0.09% (0.05) |
0.07% (0.05) |
0.1 |
|
Light activity (min) |
338.4 (53.6) |
347.6 (62.0) |
0.4 |
|
% of registered time |
43.9% (5.5) |
44.7% (5.8) |
0.5 |
|
*% of counts accumulated |
14.2% (6.8) |
11.5% (5.1) |
0.04 |
|
Moderate activity (min) |
260.4 (54.6) |
252.3 (51.4) |
0.5 |
|
% of registered time |
33.9% (6.9) |
32.6% (6.3) |
0.4 |
|
*% of counts accumulated |
70.4% (9.7) |
68.3% (10.1) |
0.3 |
|
†Vigorous activity (min) |
13.7 (7.8, 25.0 ) |
16.3 (11.0, 26.4) |
0.3 |
|
% of registered time |
2.3 (1.6) |
2.6 (1.5) |
0.4 |
|
*% of counts accumulated |
15.9 (11.2) |
20.4 (11.6) |
0.06 |
Values presented are mean (SD) and †geometric mean (IQR); *Based on a single day data.
|
All available
days (4-6 days) were used for comparisons. Among the 46 children selected,
actigraphs correlated with diaries for average registered time (r=0.73,
P<0.001), time spent in sedentary (r=0.48, P=0.001),
light (r=0.70, P<0.001) and moderate activities (r=0.29,
P=0.054), but not vigorous activities (r=0.03, P=0.8).
With the exception of sedentary activities on Day 6,
day-to-day correlations were consistent (Days 1-6 Sedentary: r=0.34,
0.29, 0.25, 0.31, 0.29, –0.06; Light: r=0.70, 0.68, 0.69, 0.73,
0.55, 0.56; Moderate r=0.50, 0.58, 0.32, 0.20, 0.30, 0.38).
 |
|
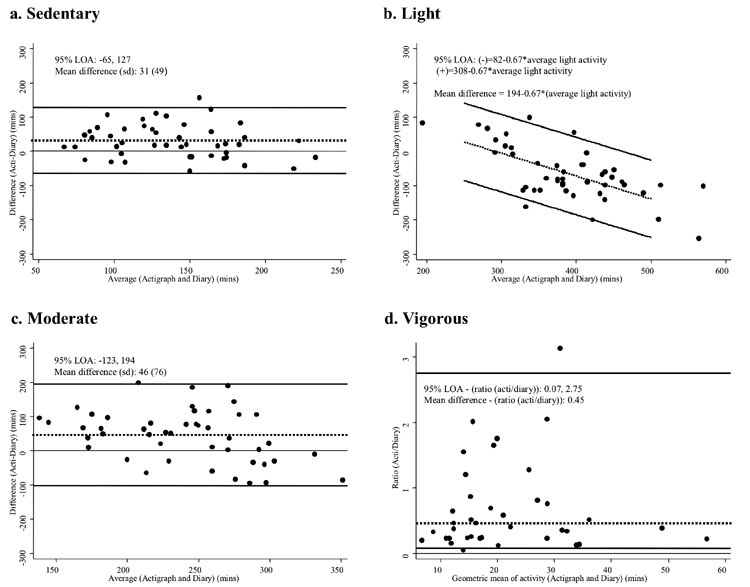
Fig.1 Bland-Altman plots showing limits of
agreement for average minutes per day spent at each activity level
as measured by the Actigraph and activity diaries. For sedentary and
moderate activities, the difference between Actigraph and
diary-derived values, represented by the dotted line, were constant
across the whole range of activity time (plots a and c). For light
activity (plot b), the difference between the two methods increased
as activity level increased; hence the difference is expressed as an
equation, using the multiple of the activity level. For vigorous
activity (plot d), the variables required log transformation. By
definition, this results in limits of agreement that are on a
multiplicative scale when the logged variables are back-transformed,
and the difference between the two logged values becomes the ratio
of the two back-transformed values. |
Bland-Altman analysis showed systematic bias between
diary and Actigraphs on the average time spent at all intensity levels (P<0.01
for all) (Fig. 1). Bias was small for sedentary and moderate
levels. For light activities, the level of bias increased with increasing
duration of activity. At all intensity levels, the limits of agreement
were wide, indicating poor agreement between the methods.
 |
|
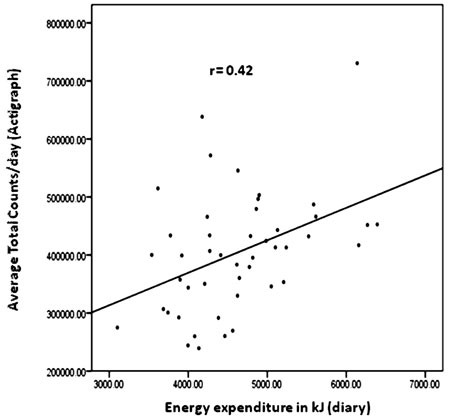
Fig. 2 Scatterplot illustrating the
correlation between Actigraph counts, and wake-time energy
expenditure calculated using diaries. |
Actigraph counts correlated positively with EE (r=0.42,
P=0.004) (Fig.2). In a cross-tabulation, 24 of the 46
children were placed in the equivalent activity and EE tertiles, while 4
were placed in extreme opposite categories; level of agreement (kappa
statistics) was k = 0.28 (P = 0.007) (Table
IV).
Table IV


Cross-tabulation Of Number Of Study Children According To Thirds Of Total Counts And Energy Expenditure
| |
Thirds of Energy Expenditure (diary) kJ |
| |
|
Lowest |
Middle |
Highest |
|
Thirds of total counts (Actigraph) |
Lowest |
9 |
4 |
2 |
| |
|
(19.6%) |
(8.7%) |
(4.3%) |
| |
Middle |
4 |
7 |
5 |
| |
|
(8.7%) |
(15.2%) |
(10.9%) |
| |
Highest |
2 |
5 |
8 |
| |
|
(4.3%) |
(10.9%) |
(17.4%) |
|
Values given are N (%); k=0.28, P=0.007. |
In all children, counts correlated inversely with
subscapular skinfolds (r = –0.28, P = 0.006); triceps
skinfolds (r = –0.22, P = 0.03) and fat% (r = –0.29,
P = 0.005; adjusted for age, sex, maternal GDM status [no/yes]).
Discussion
This study reports the use of accelerometers for
measuring habitual activity in Indian children. Accelerometers were well
tolerated. Actigraph counts correlated with time spent in sedentary, light
and moderate activities and EE from parental diaries.
Our major strength was the use of accelerometers which
record the intensity and duration, and thus the pattern of physical
activity. Diaries provided a cheap and the most effective tool to compare
the activity pattern in habitual conditions. One of the major limitations
was the non-availability of a ‘gold standard’ for validating actigraphs
for total activity. As we did not assign any values to the missing times,
it is possible that we have missed important activity data, and the impact
of excluding this time in our analysis would increase as the duration of
missing data increased.
We chose actigraphs because of their small size,
non-intrusion in free-living conditions, good evi-dence of validity and
acceptability for long-term use in other populations(12). We explored
their utility for the first time in pre-pubertal children in India. About
95% of children wore them for
³4
days, the recommended period for assessing habitual activity(13), as
compared to 65% of diaries with representative data. Total counts were
lower than those reported from other populations(6,14-17). Children spent
less than 20 minutes in vigorous intensity activities. A review suggests
that Asian children in the UK are less active than white or other
non-Asian children(18). Alternatively, parents might have curtailed
children’s activities to facilitate diary recording. Reduced outdoor
spaces, increased television viewing, and fierce academic competition
reduce activity levels in Indian children(5). Decreased activity behavior
due to fetal programming(19), and the ‘low muscle-high adipose’ Indian
body composition may be the other explanations. Gender difference was not
evident in our cohort. Earlier studies have observed lower activities in
girls than boys during pubertal(20), and pre-pubertal years(15,16), though
others observed no differences in pre-pubertal children(21). Our study may
have been underpowered to identify sex differences. Alternatively, the
boys may have little scope to be active in this urban setting, thus
children of both sexes spend their leisure time in sedentary activities.
Our main purpose was to test the use of
accelerometer-derived activity in categorizing children as sedentary or
active. Using a simple exercise, we derived counts representing different
activity levels for our population. Counts increased linearly with the
intensity of the structured activities. Significant correlations with the
diaries suggested that the Actigraph was measuring activity similarly to
another commonly-used field tool. Both methods were consistent in mapping
the duration of sedentary, light and moderate activities similarly, even
on day-to-day observations. Poor correlations were observed for day-6
sedentary activities. The children with 6 days of monitoring were fewer
than for other days. Parents may have become less observant towards the
end, though we do not know why it did not affect other activities.
Correlations were poor with vigorous activities. Accelerometers may not
capture higher intensity activities effectively; they underestimate
activities that do not involve much body displacement such as cycling(22).
Alternatively, diaries may be unreliable, incomplete and biased; subject
recalls/diaries tend to overestimate time spent in higher intensity
activities(23).
There was moderate agreement (r=0.4,
k=0.3)
between total counts and EE calculated from diaries; >50% of the children
were placed in comparable activity tertiles by both methods, while <10%
were grossly miscategorized. Though few, studies in children validating
Actigraphs using free-living TEE and Physical Activity Level (PAL)
measured from doubly-labeled water (DLW) method have shown significant
correlations (r=0.3 to 0.8)(12), comparable with our findings. In a
study from the USA validating parents’ records using PARs (METs) derived
from Actigraph data, hour-specific correlations ranged from ‘0.0’ to
‘0.4’(13). Exact agreement would not be expected, because accelerometers
measure body movement, while diaries were used to estimate EE, which is
dependent on body mass, and published PAR values are derived for adults
rather than children.
The Bland-Altman analysis, which tests absolute
agreement between methods, showed poor agree-ment. Without using a
‘gold-standard’ method, we could not assess the merits of one tool over
the other. Since diaries recorded activity every 15 minutes, and the
Actigraphs every minute, the latter may have detected different
intensities during any given 15-minute period while the diaries recognized
only one intensity. This may explain why bias increased with the duration
of the activity.
Lower counts were associated with higher adiposity in
our children. Studies among Western children have shown inverse
associations between physical activity, and adiposity and other
cardio-vascular risk markers(6,7). Some have also shown positive
associations with fat-free mass suggesting that children with higher
lean/muscle mass are either fitter and thus more active, or that
physically active children develop higher lean mass.
In conclusion, describing activity levels is a
first-step towards reducing sedentary behaviour, and adiposity, in India’s
transitioning population. We showed that in children from a developing
population with low awareness of and exposure to physical activity, high
compliance can be achieved for accelerometer use, and that these monitors
were useful in characterizing children’s activity levels. Accelerometers
have limitations, and care is required in the interpretation of the data
they generate. We now plan to use accelerometers to examine the
determinants of physical activity behaviour and test interventions aimed
at increasing physical activity in the wider cohort of children.
Acknowledgments
We thank Jayakumar, Geetha, Chachyamma, Saroja, Tony
Onslow, Kiran and Jane Pearce for their contributions, and Dr Ulf Ekelund,
MRC Epidemiology Unit, Cambridge, UK, for providing the data reduction
programme and for his help and advice. We thank Sneha-India for its
support.
Contributions: GVK, SRV, ICM, SAW, CHDF:
conceived and designed the study; GVK, SRV, SS, SCK acquired the data; GVK,
CHDF drafted the article; GVK, ICM, AKW, SAW, PJC, DJF, CHDF: analyzed and
interpreted data. All authors revised the manuscript critically for
important intellectual content; and approved the final version to be
published. CHDF will act as the guarantor of the study.
Funding: Parthenon Trust, Switzerland, Wellcome
Trust, UK, Medical Research Council, UK.
Competing interests: None stated.
|
What is Already Known?
• Accelerometers give a valid measure of physical
activity in Western children. Lower activity correlates with higher
adiposity and cardiovascular risk factors.
What This Study Adds?
• Accelerometers are well-tolerated in
pre-pubertal Indian children, and give useful measures of total
activity and activity patterns.
|
References
1. Chowdhury B, Lantz H, Sjostrom L. Computed
tomography-determined body composition in relation to cardiovascular risk
factors in Indian and matched Swedish males. Metabolism 1996; 45: 634-644.
2. Krishnaveni GV, Hill JC, Veena SR, Leary SD, Saperia
J, Chachyamma KJ, et al. Truncal adiposity is present at birth and
in early childhood in south Indian children. Indian Pediatr 2005; 42:
527-538.
3. Yajnik CS, Fall CHD, Coyaji KJ, Hirve SS, Rao S,
Barker DJ, et al. Neonatal anthropometry: the thin-fat Indian baby;
the Pune Maternal Nutrition Study. Int J Obesity 2002; 27: 173-180.
4. Yajnik CS. Early life origins of insulin resistance
and type 2 diabetes in India and other Asian countries. J Nutr 2004; 134:
205-210.
5. Bhave S, Bavdekar A, Otiv M. IAP National task force
for childhood prevention of adult diseases: Childhood obesity. Indian
Pediatr 2004; 41: 559-575.
6. Ekelund U, Sardinha LB, Anderssen SA, Harro M,
Franks PW, Brage S, et al. Association between objectively assessed
physical activity and indi-cators of body fatness in 9 to 10-y-old
European children: a population-based study from 4 distinct regions in
Europe (the European Youth Heart Study). Am J Clin Nutr 2004; 80: 584-590.
7. Anderson LB, Harro M, Sardinha LB, Froberg K,
Ekelund U, Brage S, et al. Physical activity and clustered
cardiovascular risk in children: A cross sectional study (The European
Youth Heart Study). Lancet 2006; 368: 299-304.
8. Krishnaveni GV, Hill JC, Leary SD, Veena SR, Saperia,
J, Saroja A, et al. Anthropometry, glucose tolerance and insulin
concentrations in Indian children: relationships to maternal glucose and
insulin concentrations during pregnancy. Diabetes Care 2005; 28:
2919-2925.
9. Hill JC, Krishnaveni GV, Annamma I, Leary SD, Fall
CHD. Glucose tolerance in pregnancy in South India: Relationships to
neonatal anthropometry. Acta Obstet Gynecol Scand 2005; 84: 159-165.
10. Ainsworth BE, Haskell WL, Whitt MC, Irwin ML,
Swartz AM, Strath SJ, et al. Compendium of physical activities: an
update of activity codes and MET intensities. Med Sci Sports Exerc 2000;
32 Suppl 9: S498-S516.
11. Schofield WN. Predicting basal metabolic rate, new
standards and review of previous work. Hum Nutr Clin Nutr 1985; 39 Suppl
1: 5-41.
12. Plasqui G, Westerterp KR. Physical activity
assessment with accelerometers: an evaluation against doubly labelled
water. Obesity 2007; 15: 2371-2379.
13. Bender JM, Brownson RC, Elliott MB, Haire-Joshu DL.
Children’s physical activity: using accelerometers to validate a parent
proxy record. Med Sci Sports Exerc 2005; 37: 1409-1413.
14. Metcalf BS, Voss LD, Wilkin TJ. Accelerometers
identify inactive and potentially obese children (EarlyBird 3). Arch Dis
Child 2002; 87: 166-167.
15. Dencker M, Thorsson O, Karlsson MK, Linden C,
Svensson J, Wollmer P, et al. Daily physical activity in Swedish
children aged 8-11 years. Scand J Med Sci Sports 2006; 16: 252-257.
16. Eiberg S, Haaselstorm H, Gronfeldt V, Froberg K,
Svensson J, Andersen LB. Maximum oxygen uptake and objectively measured
physical activity in Danish children 6-7 years of age: the Copenhagen
school child intervention study. Br J Sports Med 2005; 39: 725-730.
17. Jackson DM, Reilly JJ, Kelly LA, Montegomery C,
Grant S, Paton JY. Objectively measured physical activity in a
representative sample of 3 to 4-year-old children. Obes Res 2003; 11:
420-425.
18. Fischbacher CM, Hunt S, Alexander L. How physically
active are South Asians in the United Kingdom? A literature review. J
Public Health (Oxf) 2004; 26: 250-258.
19. Vickers MH, Breier BH, McCarthy D, Gluckman PD.
Sedentary behaviour during postnatal life is determined by the prenatal
environment and exacerbated by postnatal hypercaloric nutrition. Am J
Physiol Regul Integr Comp Physiol 2003; 285: R271-273.
20. Bitar A, Vernet J, Coudert J, Vermorel M.
Longitudinal changes in body composition, physical capabilities and energy
expenditure in boys and girls during the onset of puberty. Eur J Clin Nutr
2000; 39: 157-163.
21. Grund A, Vollbrecht H, Frandsen W, Krause H,
Siewers M, Rieckert H, et al. No effect of gender on different
components of daily energy expenditure in free living pre-pubertal
children. Int J Obes Relat Metab Disord 2000; 24: 299-305.
22. Puyau MR, Adolph AL, Vohra FA, Butte NF. Validation
and calibration of physical activity monitors in children. Obes Res 2002;
10: 150-157.
23. Bratteby LE, Sandhagen B, Fan H, Samuelson G. A 7-day diary
assessment of daily energy expenditure validated by the doubly labeled
water method in adolescents. Eur J Clin Nutr 1997; 51: 585-591.
|
|
|
 |
|
