|
|
|
Indian Pediatr 2021;58: 325-331 |
 |
Catch-up and Catch-down Growth in Term
Healthy Indian Infants From Birth to Two Years: A Prospective
Cohort Study
|
|
Vandana Jain, Brijesh Kumar and Sapna Khatak
From Pediatric Endocrinology Division, Department of
Pediatrics, All India Institute of Medical Sciences, New
Delhi, India.
Correspondence to: Dr Vandana Jain, Professor, Pediatric
Endocrinology Division, Department of Pediatrics, All India
Institute of Medical Sciences, New Delhi, India.
Email:
vandanajain2005@hotmail.com
Received: September 20, 2019;
Initial review: December 30, 2019;
Accepted: October 1, 2020
Published online: January 02, 2021;
PII: S097475591600273
|
|
Background: Catch-up
in the first two years of life may help in reducing the growth
deficit.
Objective: To study
growth pattern of term infants from birth to 2 years, focusing
on catch-up and catch-down growth (increase or decrease in z-score
>0.67) in weight and length.
Study design:
Prospective birth cohort.
Participants: 262
healthy term infants with birthweight 1800-4000 g.
Intervention: Serial
assessment of anthropometric parameters at birth, 3.5 month, 1
year and 2 year of age.
Outcomes: Proportion,
timing and determinants of catch-up and catch-down growth.
Results: Weight
catch-up between birth to 3.5 mo, 1 y, and 2 y was seen in 18%,
41% and 38%; and weight catch-down in 27%, 25% and 23%,
respectively. Between birth and 2 y, change in weight z-score
was inversely related to birthweight ( b
-3.754, P<0.001) and directly to caloric intake at 2 y (b
0.003, P<0.001). Mean (SD) birthweights of infants with
catch-up, steady growth and catch-down were 2.6 (0.4), 2.9 (0.4)
and 3.1 (0.4) kg, respectively (P<0.001). Catch-up and
catch-down in length between birth and 2 y were present in 30%
and 33% of the infants, respectively. Length z-scores at
2 y but not at birth were positively correlated with mothers’
(r=0.21, P=0.002) and fathers’ height (r=0.22, P=0.001).
Conclusion: Nearly
two-thirds of healthy term infants experienced either catch-up
or catch-down in weight and length first 2 years of life.
Infants’ birthweight and length at birth, caloric intake, and
parents’ heights are important determinants of their growth
patterns.
Keywords: Adiposity, Growth
trajectory, Low birthweight, Stunting, Undernutrition.
|
T
he average birthweight of Indian
newborns is lower in comparison to that of newborns in other
countries. The mean (SD) birthweight of Indian babies from
affluent families without any obvious constraints was 2.9
(0.4) kg as compared to 3.3 (0.5) for the pooled data from
other eight sites in Intergrowth-21st study [1]. A similar
trend was present for birth length [1]. Whether these
differences were due to prenatal growth constraint or
related to ethnic and other physiological variations, and
whether Indian newborns recover from the growth deficit is
not clearly understood.
The upward crossing of centiles seen in
babies with low birthweight is often described as catch-up
growth. During growth monitoring in infancy, it implies that
the size at birth was smaller than the infant’s potential to
grow as a consequence of constraints during fetal period.
However, it is simplistic to assume that catch-up growth
occurs only in small for gestational age (SGA) infants. In a
proportion of infants, postnatal growth acceleration may not
reflect catch-up growth from constraints, but excessive
weight gain as a result of overfeeding or other
genetic/environmental factors. Thus, catch-up growth may not
always be desirable and instead pose a greater risk of
future obesity, metabolic syndrome and type 2 diabetes
[2-7]. The reverse phenomena, i.e., downward crossing of
centiles of weight or length are generally attributed to
growth faltering or under-nutrition [8]. However, this may
reflect a true catch-down in infants with excess antenatal
growth for their genetic potential who revert to their
physiological growth curve [9,10].
The present study assessed the growth
pattern of term healthy infants from birth to two years of
age, and evaluated timing and determinants of catch-up
growth and catch-down growth in weight and length.
METHODS
This prospective cohort study was
conducted at All India Institute of Medical Sciences, New
Delhi during 2013-2016 after approval from the ethics
committee. Healthy term singleton infants were enrolled at
birth after informed consent from the parents. Infants with
birthweight <1800 gram and >4000 gram, any illness requiring
neonatal intensive care unit stay or intravenous fluid
therapy for >48 hours, maternal inability or
contraindication to breastfeeding, families belonging to
lower socio-economic strata, and large family size (more
than three alive siblings) were excluded.
Gestational age was calculated based on
last menstrual period. Infants were classified into small,
appropriate and large for gestational age (SGA, AGA and LGA,
respectively) using Indian intrauterine growth curves [11].
Socioeconomic status was determined based on the income,
education and occupation of head of the household [12].
Maternal serial weights were noted from her antenatal
records, and weight of father was measured with a bathroom
scale. Height of both parents was measured using stadiometer
to an accuracy of 0.5 cm.
Nude weight of infant was measured at
birth by electronic weighing balance with a sensitivity of
10 gram (Seca 354, Seca GmbH). Length and skinfold
thicknesses at biceps, triceps, subscapular and supra-iliac
sites were measured within 48 hours of birth using infant
measuring board (Seca 417, Seca GmbH), and Holtain calipers
(Holtain Ltd), respectively. All measurements were made in
duplicate and averaged. Anthropometric equipment were
calibrated regularly. Percentage body fat (BF%) was
calculated from the sum of skinfolds using the equations
given by Weststrate and Deurenberg [13]. Weight and length
were converted to z-scores using World Health
Organization (WHO) Anthro plus software. Anthro-pometric
measurements (weight, length and skinfold thicknesses) were
repeated at 3.5 months (±2 weeks), 1 year (±1 month), and 2
years (±2 month) of age. Standing height was measured for
all children at 2 years. If the age of the child was less
than completed 24 months, 0.7 cm was added to the standing
height before calculation of z-score to make it
equivalent to supine length. Feeding of infants was assessed
using infant and young child feeding (IYCF) questionnaire
[14], and detailed dietary intake was recorded at 1 year and
2 year visits using a one-month semi-quantitative food
frequency question-naire. Caloric intake was calculated by a
qualified dietician.
Catch-up growth and catch-down growth
were defined as an increase or decrease in z-score of
> 0.67 between two time points [4]. This approximately
represents the width of each major percentile band on
standard growth charts (e.g., 10th to 25th or 25th to 50th),
and therefore can be considered clinically significant.
Sample size was estimated as 225 taking
prevalence of weight catch-up between birth and 2 years as
30% [4], with precision of 6%. Considering the possibility
of upto 15% attrition of the cohort, 262 infants were
enrolled.
Statistical analyses: The proportion
of infants who experienced catch-up growth and catch-down
growth during the different time periods was calculated. The
anthropometric measurements, adiposity and caloric intake
were compared between infants with and without catch-up
growth. Factors that could affect the increment in weight
for age z-score between birth to 3.5 months, birth to
1 year and birth to 2 year, including parents’ height and
BMI, maternal parity, socio-economic status, and infants’
birthweight, gender and feeding were evaluated by linear
regression. P <0.05 was considered as significant.
RESULTS
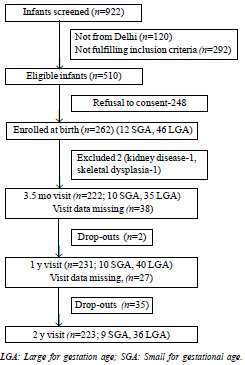
A total of 262 newborns (150 boys) were
enrolled. The baseline characteristics of the cohort are
shown in Table I and study flow chart is presented in
Fig. 1. Table II summarizes the anthropometric
parameters as absolute values, z-scores, and proportion of
infants with z-scores < -2 at birth and follow-up. At 2
years, 11 (4.9%) children had BMI z-score > +2, of
whom 4 were born LGA while the rest were born AGA.
Table I Baseline Characteristics of Newborns and Parents (N=262)
| Parameters |
Mean (SD) |
| Birthweight, g |
2863 (418) |
| Birthweight categories, n
(%) |
|
| <2500 g |
55 (21) |
| 2500-3000 g |
117 (45) |
| >3000 g |
90 (34) |
| Small for
gestational age |
12 (4.6) |
| Large for
gestational age |
46 (17.6) |
| Gestational age, wk |
38.3 (1.0) |
| Birth length, cm |
48.4 (2.2) |
| Maternal age, y |
27.3 (4.6) |
| Maternal preconception
weight, kg |
55.0 (9.3) |
| Maternal height, cm |
154 (4) |
| Maternal preconception BMI,
kg/m2 |
23.6 (4.0) |
| Maternal BMI categories, n
(%) |
|
| BMI <18.5 kg/m2, n
(%) |
21 (8.5) |
| BMI <25 kg/m2, n (%) |
79 (31.5) |
| Paternal height, cm |
168 (7) |
| Paternal BMI, kg/m2 |
24.9 (3.6) |
| Socioeconomic status, n (%) |
|
| Upper |
22 (8) |
| Upper middle |
82 (32) |
| Lower middle |
158 (60) |
| Maternal education, n (%) |
|
| Graduate and above |
136 (52) |
| Matriculation |
87 (33) |
| Less than
matriculation |
38 (15) |
| Values in
mean (SD) or as stated. BMI: Body mass index. |
 |
|
Fig. 1 Flow of participants in the study.
|
Table II Anthropometric Parameters at Birth and Follow-up
| Parameters
|
Birth (n=262) |
3.5 m (n=222) |
1 y (n=231) |
2 y (n=223) |
|
Weight, ga |
2863 (418) |
5587 (790) |
8959 (1180) |
10882 (1420) |
| WAZb |
-1.0 (-1.7, -0.3) |
-1.2 (-1.8, -0.5) |
-0.7 (-1.4, -0.1) |
-0.8 (-1.5, -0.8) |
| WAZ <-2, n (%) |
34 (13.0) |
40 (18.0) |
24 (10.4) |
24 (10.8) |
|
Length, cma |
48.4 (2.2) |
61.0 (3.1) |
75.1 (3.1) |
84.1 (3.6) |
| LAZb |
-0.9 (-1.5, 0.03) |
-0.2 (-1.8, 0.6) |
-0.4 (-1.3, 0.3) |
-0.9 (-1.4, -0.07) |
| LAZ <-2, n (%) |
37 (14.3) |
23 (10.5) |
19 (8.3) |
23 (10.4) |
| BMI, Kg/m2a |
12.2 (1.4) |
14.9 (1.7) |
15.9 (1.6) |
15.4 (1.6) |
| BMIZb |
-0.9(-1.7, -0.2) |
-1.3(-2.1, -0.5) |
-0.7 (-1.4, 0.3) |
-0.4(-1.3, 0.3) |
| BMIZ <-2, n (%) |
53 (20.4) |
64 (29.9) |
22 (9.6) |
18 (8.1) |
| BF%c |
14.4 (3.4) |
23.9 (3.1) |
21.7 (3.2) |
20.3 (2.8) |
| WAZ: Weight for
age, LAZ: Weight for age: BMI: Body mass index;
BMIZ: BMI for age; BF: Body fat. amean (SD); bmedian
(IQR). |
Table III Catch-up and Catch-down Growth in Weight From Birth to 2 Years
|
Infants with catch-up |
Infants with steady |
Infants with catch- |
P value |
|
growth |
growth |
down growth |
|
| Between birth to 3.5 mo
(n=222) n (%) |
|
|
|
|
| Weight at birth, g |
2659 (385) |
2841 (380) |
3016 (404) |
<0.001 |
| WAZ at birth |
-1.6 (-2.1, -0.8) |
-1.0 (-1.7, -0.4) |
-0.6 (-1.2, 0.1) |
<0.001 |
| Weight at 3.5 mo, g |
6148 (792) |
5646 (691) |
5083 (723) |
<0.001 |
| WAZ at 3.5 mo |
-0.2 (-0.8, 0.2) |
-1.1 (-1.6, -0.5) |
-1.8 (-2.6, -1.3) |
<0.001 |
| Exclusively breastfed till
3.5 mo, % |
63 |
74 |
47 |
0.006 |
| Between birth to 1y (n=231)
n (%) |
|
|
|
|
| Weight at birth, g |
2597 (294) |
2898 (326) |
3245 (337) |
<0.001 |
| WAZ at birth |
-1.6 (-2.1, -1.0) |
-0.8 (-1.4, -0.4) |
-0.1 (-0.6, 0.5) |
<0.001 |
| Weight at 1 y, g |
9751 (1123) |
8723 (841) |
7973 (708) |
<0.001 |
| WAZ at 1 y |
0.2 (-0.5, 0.7) |
-0.8 (-1.4, -0.4) |
-1.6 (-2.0, -1.2) |
<0.001 |
| Caloric intake at 1 y,
Kcal/d |
835 (176) |
818 (139) |
874 (140) |
0.186 |
| Between birth to 2 y
(n=223) n (%) |
|
|
|
|
| Weight at birth, g |
2641 (345) |
2896 (376) |
3113 (384) |
<0.001 |
| WAZ at birth |
-1.6 (-2.0, -0.9) |
-0.8 (-1.5, - 0.3) |
-0.5 (-1.2, 0.1) |
<0.001 |
| Weight at 2 y, kg |
11.7 (1.5) |
10.7 (1.2) |
9.9 (0.9) |
<0.001 |
| WAZ at 2 y |
-0.1 (-0.5, 0.5) |
-0.9 (-1.5, -0.3) |
-1.6 (-2.3, -1.2) |
<0.001 |
| Caloric intake at 1 y,
Kcal/d |
869 (158) |
830 (153) |
811 (151) |
0.120 |
| Caloric intake at 2 y,
Kcal/d |
1045 (147) |
998 (139) |
913 (123) |
<0.001 |
| WAZ: Weight for
age z score; LAZ: Weight for age z score; BMI: Body
mass index; BMIZ: BMI for age z score; BF: Body fat;
Weight and caloric intake in mean (SD); WAZ in
median (IQR); Data was available for 177, 183 and
172 infants for duration of exclusive breastfeeding,
caloric intake at 1 y and caloric intake at 2y,
respectively. |
The weight gain trajectories of the
infants with catch-up growth; catch-down growth or steady
growth on follow-up were analyzed (Table III).
While in the first year of life, 41% of babies showed
catch-up growth and 25% showed catch-down growth, the
reverse pattern was noted in the second year, with a higher
proportion showing catch-down (38%) compared to catch-up
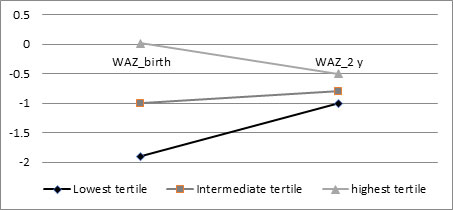
(29%). The cohort was divided into three tertiles based on
WAZ at birth (WAZ0).
For infants in the lowest WAZ0 tertile, the median (IQR) WAZ
increased from -1.9 (-2.2, -1.7) at
birth to -1.0 (-1.7, -0.5) at 2 year. In the intermediate
tertile, median WAZ at birth and 2 year were similar [-1.0 (-1.2,
-0.7) and -0.8 (-1.6, -0.1), respectively]; while for
infants in the highest WAZ0 tertile, the median WAZ decreased from 0.02
(-0.3, 0.4) at birth to -0.4 (-1.2, 0.3) at 2 year. Babies
on either end of the WAZ0 spectrum converged towards the median by 2
years (Fig. 2). Of the 12 SGA infants, catch-up
growth was seen in 3 and 8 infants at 3.5 months and 2
years, respectively; while catch-down growth was seen in two
infants at 3.5 months. Of the LGA infants, 17 (48.6%)
infants under follow-up at 3.5 months experienced catch-down
growth, while 4 (11.3%) had catch-up growth. By 2 years, 17
(47.2%) of the 36 LGA infants in follow-up had catch-down
growth, while 5 (13.9%) had catch-up growth.
 |
|
Fig. 2 Median weight for age
Z- scores (WAZ) at birth and at 2 years in the
infants in the three tertiles of WAZ at birth,
illustrating the convergence towards the median
(narrowing of the funnel).
|
Catch-up growth and catch-down growth in
length between birth to 3.5 months was seen in 103 (47%) and
35 (16%) infants, at 1 year in 94 (41%) and 68 (28%)
infants, and at 2 years in 67 (30%) and 73 (33%) infants,
respectively. The mean (SD) birth length of those with
catch-up between birth to 3.5 months was 47.5 (2.2) cm,
those with steady growth was 48.7 (1.9) cm and those with
catch-down was 49.9 (2.1) cm (P<0.001). Similarly,
the mean (SD) birth length of those with catch-up growth
between birth to 1 year, was 46.8 (1.9) cm compared to 48.9
(1.9) cm for those with steady growth, and 50.1 (1.6) cm for
those with catch-down growth (P<0.001). Mean (SD)
birth lengths were 46.7 (1.9) cm, 48.3 (1.7) cm and 50.0
(1.9) cm, respectively for those with catch-up growth,
steady growth and catch-down growth between 0-2 years (P<0.001).
A higher pro-portion of infants (39%) had catch-down growth
in length in the second year compared to catch-up growth
(23%).
Table IV compares the
anthropometry and body fat percentage at birth and 2 years
of age, and the nutritional intakes of infants who had early
catch-up growth in weight (between birth to 3.5 months),
intermediate catch-up growth (birth to 1 year), late/slow
catch-up growth (birth to 2 years), and no catch-up growth
in four mutually exclusive groups.
Table IV Comparison of Anthropometric Parameters and Adiposity at Birth and 2 Year of Age and Nutrition
of Infants With Different Patterns of Catch-up Growth
| Parameter |
Early/ rapid CUG (n=40) |
Intermediate CUG (n=76) |
Slow/ late CUG (n=35) |
No CUG (n=90) |
| At birth |
|
|
|
|
|
Weight, ga |
2659 (385) |
2612 (281) |
2788 (316) |
3103 (380) |
|
Weight-for-age z-scoreb |
-1.5 (-2.1, -0.8) |
-1.5 (-2.0, -1.0) |
-1.0 (-1.6, -0.5) |
-0.4 (-1.0, 0.2) |
|
Length, cma |
48.3 (2.3) |
47.4 (2.2) |
47.9 (2.1) |
49.4 (2.0) |
|
Length-for-age z-scoreb |
-1.0 (-1.6, -0.1) |
-1.4 (-2.0, -0.2) |
-1.0 (-1.4, -0.1) |
-0.3 (-1.1, 0.3) |
| Body mass index, kg/m2a |
11.4 (3.5) |
11.6 (1.2) |
12.2 (1.0) |
12.7 (1.3) |
| BMIZb |
-1.8 (-2.6, -0.8) |
-1.4 (-2.1, -0.8) |
-0.9 (-1.4, -0.5) |
-0.5 (-1.1, 0.1) |
| Body fat %a |
13.7 (3.5) |
13.8 (3.5) |
13.3 (2.8) |
15.4 (3.1) |
| At 2 y |
|
|
|
|
|
Weight, kga |
10.9 (1.5) |
10.6 (1.4) |
12.4 (1.2) |
10.6 (1.2) |
|
Weight-for-age z-scoreb |
-0.5 (-1.5, -0.1) |
-1.0 (-1.7, - 0.4) |
0.2 (-0.4, 0.7) |
-1.1 (-1.6, -0.5) |
|
Length, cma |
82.5 (4.3) |
83.8 (3.8) |
85.3 (3.7) |
83.8 (3.2) |
|
Length-for-age z-scoreb |
-1.1 (-1.4, 0.1) |
-1.0 (-1.5, -0.2) |
-0.2 (-0.4, 0.7) |
-1.0 (-1.5, -0.4) |
| Body mass index, kg/m2a |
16.0 (1.5) |
15.1 (1.5) |
16.7 (1.5) |
15.1 (1.4) |
| BMIZb |
-0.2 (-0.9, 0.5) |
-0.8 (-1.5, 0.2) |
1.0 (0.9, 1.6) |
-0.6 (-1.1,- 0.04) |
| Body fat, %a |
20.9 (2.1) |
20.1 (2.6) |
22.0 (2.9) |
19.5 (2.8) |
| Nutrition |
|
|
|
|
| Duration of exclusive |
4.7 (1.8) |
4.5 (1.8) |
4.4 (1.6) |
4.4 (1.7) |
| breastfeeding, moa |
|
|
|
|
|
Caloric intake at 1 y, Kcal/da |
838 (122) |
842 (186) |
846 (157) |
839 (145) |
|
Caloric intake at 2 y, Kcal/da |
1009
(141) |
958
(141) |
1069
(150) |
978
(121) |
CUG: Catch-up growth in weight; Early/rapid CUG:
CUG between birth to 3.5 mo; Intermediate CUG: CUG
between birth to 1 y; Slow/late CUG: CUG between
birth to 2 y; No CUG between birth to 3.5 mo, 1 y or
2 y; BMIZ: BMI for age Z-score. aMean (SD); bMedian
(IQR).
P-value was <0.001 by ANOVA for all the group
comparisons for anthropometry and body fat
percentage; P-value=0.005 for comparison of caloric
intake at 2 y; Data was available for 177 infants
for duration of exclusive breastfeeding, 183 for
caloric intake at 1 y, and 172 for caloric intake at
2 y. |
The increase in weight for age (DWAZ)
between birth to 3.5 months was positively correlated with
body fat percentage at 1 year (r=0.252, P<0.001)
and at 2 years (r=0.154, P=0.030). Length for
age z-score (LAZ) at birth showed positive
correlation with birthweight (r=0.535, P<0.001),
and mother’s weight (r=0.142, P=0.026) but not
with either parent’s height. LAZ at 2 years strongly
correlated with mother’s height (r=0.211, P=0.002)
as well as father’s height (r=0.215, P=0.001).
Birthweight was inversely associated with
DWAZ
at 3.5 months (r= -0.349, P<0.001; and at 1
year (r=-0.663, P<0.001).
DWAZ
between first and second year was positively associated with
caloric intake assessed at 1 year (r = 0.172, P=0.024)
and 2 years (r = 0.379, P<0.001). For
DWAZ
between birth and 2 years, the regression coefficients with
birthweight and caloric intake at 2 years were -3.754 (P<0.001)
and 0.003 (P<0.001), respectively, with adjusted
R-squared of 0.72. Birthweight itself positively correlated
with maternal weight (r=0.205, P<0.001) and
height (r=0.157, P=0.013); and was higher in
infants born to multiparous compared to primiparous mothers;
2954 (434) g vs 2776 (375) g; P<0.001, and in boys
compared to girls; 2949 (438) g vs 2746 (360) g, P<0.001.
Socioeconomic status, mothers’ education, fathers’ height
and weight did not affect birth weight or
DWAZ
between any of the time points. In this cohort, 34% of the
infants were exclusively breastfed for
£3.5
months. The odds ratio (95% CI) for having CUG between birth
and 2y was 1.8 (0.95-3.4), P=0.073, for infants who
were exclusively breastfed for
£3.5
months compared to those exclusively breastfed for a longer
duration.
DISCUSSION
In this contemporary birth cohort, median
weight and length z-scores were close to –1 at birth,
improved by one year of age and again declined during the
second year. Body fat percentage increased maximally between
birth to 3.5 months, and then showed a small decline.
Both catch-up growth and catch-down
growth in weight were common in this cohort. Infants with
birthweight close to the median birthweight of Indian
infants (approximately 2.9 kg) had a steady growth pattern
while those with lower and higher birthweights showed
catch-up growth and catch-down growth patterns,
respectively. A similar pattern was noted for length, with
the median length of infants with steady growth being about
48.5 cm, which is close to our national average. Catch-up
growth and catch-down growth are considered as
target-seeking patterns that bring babies with fetal growth
restriction and excessive fetal growth, respectively,
towards their normal growth channels [10]. Thus, the present
study suggests that the birthweight and length of Indian
babies, although low as compared to the international median
[1], may be physiologically normal for our population.
Similar conclusions were drawn in a previous study from
southern India that noted that birthweight distribution of
Indian infants is shifted to the left, and the risks
associated with being LGA were present at lower weights
[17].
The weight trajectories of infants born
in the lowest and highest tertile of WAZ converged at 2
years like narrowing of a funnel, similar to observations in
Bangla-deshi infants [18]. In the present study, LAZ at 2
years but not at birth correlated with the height of both
parents. Thus, CUG and CDG in length served to align the
length of the infants to their genetic potential. About
two-thirds of infants cross length centiles in the first 2
years in order to reach their mid-parental height centiles
[19].
In the present study, weight CUG between
birth and 3.5 month, 1 year and 2 year was chiefly driven by
lower birthweight. Previous studies have also emphasized
that lower birthweight is the exclusive determinant of CUG
in first six months [20]; and growth during infancy should
be assessed not just by comparing with reference charts, but
also taking infants’ birthweights into account [21]. In the
present study, it was observed that while catch-up growth
was commoner than catch-down in the first year, the reverse
was true in the second year; and change in weight z-score
between 1-2 year was positively correlated with caloric
intake. An earlier Indian study [22] reported an inverse
association between duration of exclusive breastfeeding and
weight gain between birth to 2 years, similar to the present
study, reiterating that optimal feeding between birth to 2
years is important to avoid growth faltering as well as
accelerated weight gain.
The mean values of body fat percentage in
the present study were similar to those reported from the
Western countries [15,16]. An overall trend for improvement
in nutritional status was observed in this study, more
marked for BMI than length.
Infants who had catch-up growth in first
3.5 months had higher BMI z scores and body fat at 2
years compared to those without catch-up growth. The median
LAZ remained nearly the same, indicating that early weight
catch-up growth does not improve statural growth but may
contribute to obesity in later childhood. These findings
were in consonance with our earlier study where early
catch-up growth (in first 6 to 12 weeks) in term low birth
infants was associated with higher body fat at 7 months
[23]. Rapid weight gain in early infancy may contribute to
later adiposity, obesity and cardiometabolic diseases [2-7].
This study used WHO z-scores for
presenting the anthropometric data, which takes into account
the variations in the exact age at the time of
anthropometric measurements as well as gender, and makes
international comparisons easier. The study had low
attrition, and we also measured body fat. The limitations
were that the findings cannot be extrapolated to infants
with birth weights outside the 1800-4000 g range, the effect
of catch-up growth and catch-down growth on
neurodevelop-ment, risk of infections, blood pressure and
metabolic parameters was not assessed, and longer follow-up
of this cohort was not done.
To conclude, catch-up and catch-down
growth in weight and length are very common in the first 2
years of life, which may represent physiological adjustments
towards the median and the genetically determined growth
trajectory in the majority. Infants’ feeding may also
contribute to growth acceleration/deceleration. Early
increase in weight z-score was associated with higher
adiposity at the age of 1 and 2 years. We recommend that the
determinants and consequences of CUG and CDG in infancy
should be studied further in larger cohorts followed up for
a longer duration.
Acknowledgments: Babita
Upadhyaya, dietician, for help with dietary assessment, and
Anuj Kumar and Naveen Kumar for technical help with
acquisition of data.
Ethics clearance: AIIMS Ethics
Committee; No. IEC/NP-127/2012 and RP-21/2012, dated April
27, 2012.
Contributors: VJ:
conceptualized and designed the work, supervised data
acquisition and analysis, interpreted the data and drafted
the paper; BK, SK: acquired the data and helped with
analysis and writing. All authors have given final approval
to the version to be published.
Funding: Department of Biotechnology,
Government of India (Grant No. BT/PR3884/Med/97/03/2011).
Competing interests: None stated.
|
WHAT IS ALREADY KNOWN?
•
Infants with low birthweight experience catch-up
growth in the first two years.
WHAT THIS STUDY ADDS?
•
Both catch-up
and catch-down growth in weight and length are
common in the first 2 years in healthy term infants.
|
REFERENCES
1. Villar J, Cheikh Ismail L, Victora CG,
et al. International Fetal and Newborn Growth Consortium for
the 21st Century (INTERGROWTH-21st). International standards
for newborn weight, length, and head circumference by
gestational age and sex: the Newborn Cross-Sectional Study
of the INTERGROWTH-21st Project. Lancet. 2014;384: 857-68.
2. Jain V, Singhal A. Catch up growth in
low birth weight infants: Striking a healthy balance. Rev
Endocr Metab Disord. 2012;13:141-7.
3. Weaver LT. Rapid growth in infancy:
balancing the interests of the child. J Pediatr
Gastroenterol Nutr. 2006; 43:428-32.
4. Ong KK, Ahmed ML, Emmett PM, Preece
MA, Dunger DB. Association between postnatal catch-up growth
and obesity in childhood: Prospective cohort study. BMJ.
2000;320:967-71.
5. Aris IM, Chen LW, Tint MT, et al. Body
mass index trajectories in the first two years and
subsequent childhood cardio-metabolic outcomes: A
prospective multi-ethnic Asian cohort study. Sci Rep
2017;7:8424.
6. Fall CH, Sachdev HPS, Osmond C, et al.
New Delhi Birth Cohort. Adult metabolic syndrome and
impaired glucose tolerance are associated with different
patterns of BMI gain during infancy: Data from the New Delhi
Birth Cohort. Diabetes Care. 2008;31:2349-56.
7. Leunissen RW, Kerkhof GF, Stijnen T, Hokken-Koelega
A. Timing and tempo of first-year rapid growth in relation
to cardiovascular and metabolic risk profile in early
adult-hood. JAMA. 2009;301: 2234-42.
8. Kim R, Mejía-Guevara I, Corsi DJ,
Aguayo VM, Subra-manian SV. Relative importance of 13
correlates of child stunting in South Asia: Insights from
nationally representative data from Afghanistan, Bangladesh,
India, Nepal, and Pakistan. Soc Sci Med. 2017;187:144-54.
9. Völkl TM, Haas B, Beier C, Simm D,
Dörr HG. Catch-down growth during infancy of children born
small (SGA) or appropriate (AGA) for gestational age with
short-statured parents. J Pediatr. 2006;148:747-52.
10. Tanner JM. Growth from birth to two:
A critical review. Acta Medica Auxologica. 1994: 26:7-45.
11. Singhal PK, Paul VK, Deorari
AK, Singh M, Sundaram KR. Changing trends
in intrauterine growth curves. Indian Pediatr. 1991;28:281-3.
12. Bairwa M, Rajput M, Sachdeva S.
Modified Kuppu-swamy’s socioeconomic scale: Social
researcher should include updated income criteria, 2012.
Indian J Community Med. 2013;38:185-6.
13. Weststrate JA, Deurenberg P. Body
composition in children: Proposal for a method for
calculating body fat percentage from total body density or
skinfold-thickness measurements. Am J Clin Nutr.
1989;50:1104-15.
14. WHO/UNICEF/USAID/AED/FANTA/UC
Davis/IFPRI. Indicators for Assessing Infant and Young Child
Feeding Practices. Part II. Measurement. 2010. Accessed
November 07, 2019. Available from:
https://www.who.int/nutrition/publications/infantfeeding/9789241599290/en/
15. Schmelzle HR, Fusch C. Body fat in
neonates and young infants: validation of skinfold
thickness versus dual-energy X-ray absorptiometry. Am
J Clin Nutr. 2002;76:1096-100.
16. Butte NF, Hopkinson JM, Wong
WW, Smith EO, Ellis KJ. Body composition during the first 2
years of life: An updated reference. Pediatr
Res. 2000;47:578-85.
17. Alexander AM, George K, Muliyil
J, Bose A, Prasad JH. Birth weight centile charts from rural
community-based data from Southern India. Indian Pediatr. 2013;50:1020-4.
18. Karim E, Mascie-Taylor CG.
Longitudinal growth of Bangladeshi infants during the first
year of life. Ann Hum Biol. 2001;28:51-67.
19. Brooke OG, Wood C. Growth in British
Asians: Longitudinal data in the first year. J Hum Nutr.
1980;34: 355-9.
20. Davies DP. Growth of
"small-for-dates" babies. Early Hum Dev. 1981;5:95-105.
21. Xiong X, Wightkin J, Magnus JH, et
al. Birth weight and infant growth: Optimal infant weight
gain versus optimal infant weight. Matern Child Health J.
2007;11:57-63.
22. Caleyachetty A, Krishnaveni GV, Veena
SR, et al. Breast-feeding duration, age of starting solids
and high BMI risk and adiposity in Indian children. Matern
Child Nutr 2013; 9:199-216.
23. Khandelwal P, Jain V, Gupta AK,
Kalaivani M, Paul VK. Association of early postnatal growth
trajectory with body composition in term low birth weight
infants. J Dev Orig Health Dis. 2014;5:189-96.
|
|
|
 |
|
