|
|
|
Indian Pediatr 2012;49:
291-294 |
 |
Determinants of Neonatal Mortality in Rural
Haryana: A Retrospective Population Based Study
|
|
RP Upadhyay, PR Dwivedi , SK Rai, P Misra, *M
Kalaivani, and A Krishnan
From the Centre for Community Medicine+ and
*Department of Biostatistics, All India Institute of Medical Sciences,
New Delhi, India
Correspondence to: Dr Anand Krishnan, Additional
Professor, Centre for Community Medicine, All India Institute of Medical
Sciences, New Delhi, India.
Email: [email protected]
Received: May 11, 2010;
Initial review: July 22, 2010;
Accepted: May 26, 2011.
Published online: 2011 August 15.
PII: S09747559INPE1000396-1
|
Objective: To identify the determinants of neonatal mortality.
Study design: Nested case-control study.
Study setting: 28 villages under
the intensive field practice area of Comprehensive Rural Health Services
Project, Ballabgarh, Haryana serving a population of 87,016, as on 31st
December 2009. The study period was from 2005 to 2009.
Methods: The data were obtained from Health
Management Information System and analyzed using multivariate logistic
regression analysis. A hierarchical approach was used to analyze the
factors associated with neonatal deaths, using community level factors,
socio-economic status and biological determinants. The population
attributable fractions were estimated for significant variables.
Results: The total live births during the study
period were 10392 and neonatal deaths were 248. The infant and
neonatal mortality rates during the study period were 45.6 and 23.8 per
1000 live births, respectively. Socio-economic determinants (Low
educational status of parents [OR 2.1, 95% CI; 1.4, 3.3]; father’s
occupation [OR 1.8, 95% CI; 1.0, 3.0]; Rajput caste [OR 2.0, 95% CI;
1.2, 3.4] appeared to explain a major fraction (45.7%) of neonatal
deaths. Community level factors (villages with no health facility [OR
1.5, 95% CI; 1.0, 2.1]; villages with population >6000 [OR 1.7, 95% CI;
1.2, 2.5]) were associated with 27.3% of all neonatal deaths. Proximate
determinants (early childbearing age of mother (<20 years) [OR 2.0, 95%
CI; 1.2, 3.2]) were least important. All the three level of variables
seemed to act independently with little mediation among them.
Conclusion: Neonatal mortality is affected by
socioeconomic, community level and proximate biological determinants.
Key words: Determinants, India, Neonate, Mortality, Rural,
Prevention.
|
|
Neonatal mortality rate (NMR) in India was 39 per
1000 live births in the year 2005-06, with rural and urban rates being
42.5 and 28.5 per 1000 live births, respectively [1]. There was only a
decrease of 20.4 % in the National NMR from 1992-93 (49 per 1000 live
births) to 2005-06 (39 per 1000 live births) [1]. The reduction of NMR
largely requires intervention which is different from that required for
reduction of post-neonatal mortality rate. The difficulty in reducing
NMR has been documented from Jamkhed [2]. We conducted this study to
understand the determinants of NMR in rural Haryana and the pathways
through which these act.
Methods
We carried out a nested case control study of live
births that occurred between 1 January 2005 and 31 December 2009 (n
= 10392) in the 28 villages in Ballabgarh under the Comprehensive Rural
Health Services Project (CRHSP). Data were abstracted on live births and
their outcomes from the Health Management Information System (HMIS). The
health workers generate data at the village level where the service
provision is done and on their monthly visits to Ballabgarh, transfer
the data to the HMIS.
Every year annual census is carried out in December
where 100% verification of data is done. Census is done by the health
workers and is supervised by the health assistants and medical
officer-in-charge, Primary Health Centre. For quality control,
information in 20% households is cross-checked by the health assistant
and in another 5% of the households by the Medical Officer in charge,
for completion and accuracy. The reliability and validity of data is
also verified by external users i.e. either investigators of research
project or postgraduates of the study Institution. In an ongoing project
at the study area, research workers collected demographic data and it
was identified that in more than 95% of the fields, the demographic
information in the HMIS was accurate.
Conceptual framework: The Mosley and Chen
conceptual framework for the study of child survival in developing
countries [3] was adapted based on selected possible predictors of
neonatal mortality, which were restricted to those on which information
was available in the HMIS. The Mosley and Chen framework is based on the
idea that all community and socioeconomic determinants of child
mortality operate through a set of biological or proximate determinants
to affect a child’s probability of survival [4]. The adaptation was
based on our hypothesis that apart from mediating through the biological
determinants, the community level and socioeconomic factors may also act
directly to affect the neonatal outcome.
Study variables: The primary outcome was neonatal
death, which was the death of a live born infant in the first four weeks
of life. In the descriptive analyses, the neonatal mortality rate,
defined as the number of neonatal deaths per 1000 live births, was used.
The explanatory variables included community level contextual variables
(population of village, distance of village from nearest secondary level
hospital, availability of a primary health centre or a sub-centre in the
village), socioeconomic (maternal education, paternal education,
combined education of both parents, paternal occupation, caste) and
proximate determinants (age of the mother at the time of childbirth, age
of the neonate, sex, birth order, place of delivery) covering maternal,
neonatal and delivery factors.
All the births and neonatal deaths that occurred
during the study period were considered in the study. There were 10392
live births in which 248 deaths occurred in the neonatal period and 13
variables were used as determinants of mortality. The number of events
i.e. neonatal death, per variable is 19 which suggest adequate events
per variable (EPV) [5].
Statistical analysis: Data were compiled and
extracted using MySql (Database Management Information System in Linux)
for data analysis. Statistical analyses were carried out using SPSS 14.0
(Chicago, IL, USA) and Stata 9.0 (College Station, Texas, USA). To find
factors associated with neonatal mortality, community level variables,
socioeconomic determinants and proximate determinants were added in a
stepwise process in the logistic regression analysis. All these
three-level variables were scrutinized for multi-collinearity using
Spearman correlation. At first level, only community level variables
(Model-1) had been considered, in the second level socioeconomic
determinants (Model-2) were added to model-1 and finally proximate
determinants (Model-3) were added to Model-2 in the logistic regression
analysis. The results were reported as odds ratio (95% CI). The
Goodness-of-fit of each of the models was tested using Hosmer-Lemeshow
goodness-of-fit statistic and the area under the receiver operating
characteristics (ROC) curve was calculated for each model to assess
model discrimination power of the model. P value less than 0.05
was considered statistically significant.
The variables found significant in each of the model
were further evaluated for the proportion of neonatal deaths caused by
it using population attributable fraction (PAF) or excess fraction with
the formula: Pd * (RR-1)/RR [6] where Pd is proportion of cases exposed
to risk factor and RR is the relative risk which was calculated using OR
derived from multivariable logistic regression using the formula: RR=
OR/ [(1-P o) + (Po*
OR)] where Po is incidence
of the outcome of interest in the non-exposed group [7]. Also, 95%
confidence intervals for PAF were calculated using the formula: [PdL
(RRL-1/RRL);
PdU (RRU-1/RRU)].
The combined PAF for each level of the pre-defined conceptual model
i.e. community level, socioeconomic determinants and proximate
determinants were calculated using the formula: 1- {(1-PAF1)
×
(1-PAF2) ×
(1-PAF3).....} where PAF 1, 2, 3 etc represent the
individual PAF of the variables (significantly associated with neonatal
mortality in multivariable regression analysis) under each level [9,10].
Results
The characteristics of the study variables at all the
three levels are presented in Web Table I.
It also summarizes the adjusted odds ratio ratios of the possible
factors associated with neonatal mortality.
In the present analysis, neonatal mortality was
influenced by factors from all the three levels. In Model 2, the odds
associated with the community level factors did not change significantly
compared to that in Model 1, upon inclusion of the socioeconomic
factors. Moreover, in Model 3, it remained fairly the same as in Model 2
despite further incorporation of proximate determinants. Similarly, the
odds for socioeconomic determinants in Model 2 did not show significant
change upon inclusion of proximate variables in Model 3. This indicates
that there was little mediation of distal variables through proximal
variables. The area under the ROC curve was 0.5694, 0.6328 and 0.6456
for the Models 1, 2 and 3, respectively (Fig. 1).
Similarly, the P value for the Hosmer-Lemeshaw goodness of fit for
Models 1, 2, and 3 were 0.01, 0.04 and 0.57, respectively.
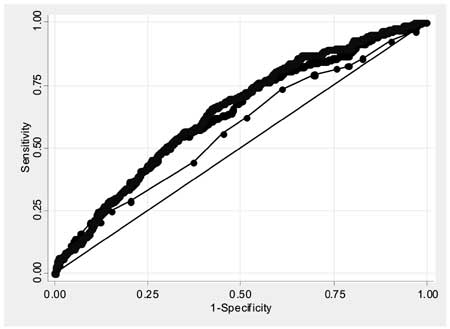
Model 1 ROC area: 0.569, 95% CI; 0.532, 0.606
Model 2 ROC area: 0.632, 95% CI; 0.597, 0.667
Model 3 ROC area: 0.645, 95% CI; 0.612, 0.678
|
| |
As can be seen from Table I,
socioeconomic factors explained a large proportion of neonatal deaths
with a PAF of 45.7%, and the large proportional contribution towards
this was from low educational status of both the parents (34.7%).
The PAF for early childbearing age of the mother (proximate factor) was
not large (8.4%), while community level factors explained a total of
27.3% of all neonatal deaths.
TABLE I


Population Attributable Fraction (PAF) With 95% CI, Derived From Multiple Regression on

Risk Factors for Neonatal Mortality
|
Model 1 PAF (%) |
Model 2 PAF (%) |
Model 3 PAF (%) |
|
Community level factors |
28.1 |
27.1 |
27.3 |
|
Village population >6000 |
17.3 (3.4, 30.2) |
17.4 (3.1, 30.3) |
17.9 (2.9, 30.2) |
|
Non-availability of a health facility |
13.2 (1.4, 24.7) |
11.9 ( -0.42, 23.8) |
11.5 (-0.74, 23.6) |
|
Socioeconomic determinants |
NA |
46.2 |
45.7 |
|
Low education of both parents |
– |
35.2 (14.4, 51.5) |
34.7(13.3, 51.7) |
|
Father occupation as labourer/ |
|
|
|
|
watchman/domestic servant/sweeper |
– |
6.5 (-0.40, 13.7) |
6.5 (-0.37, 13.7) |
|
Caste (Rajput) |
– |
11.2 (1.9, 20.2) |
11.2 (1.8, 20.2) |
|
Proximate determinants |
NA |
NA |
8.4 |
|
Mother’s age <20 yrs |
– |
– |
8.4 (1.5, 15.7) |
|
*PAF- Population Attributable Fraction; Model 1 includes
only community level determinants; Model 2 includes both
community level determinants and socio-economic determinants and
Model 3 includes proximate determanants as well. |
Discussion
There has been no significant decrease in the NMR in
the study area over a period of 10 years i.e. from 2000-2009,
though there have been fluctuations, with a lowest level in the year
2000 (17 per 1000 live births) and highest in the year 2004 (31 per 1000
live births). The NNMR during the study period i.e. 2005-2009 was
23.8 per 1000 live births. The important causes of neonatal mortality in
the study area from the year 2002-2008, as determined by using verbal
autopsy tool, were low birthweight (32.6%), birth asphyxia (22.7%),
sepsis/pneumonia (16.6%) and congenital malformations (10.2%)
(unpublished information).
The results of this study show that, the occurrence
of neonatal deaths was a multifactorial process in the sense that is was
related to a number of factors at community level, family level
(socio-economic) and biological level (proximate). In our results,
socioeconomic determinants explained a large proportion of neonatal
deaths followed by community level factors and these factors, instead of
working through proximate determinants seem to affect the neonatal
outcome directly or through other factors which have not been included
in the study.
The model 3 seems to be a valid model with
Hosmer-Lemeshow goodness of fit having an associated P value
>0.05. Also, the area under ROC curve was 0.64 which provides a fairly
reasonable measure of this model to discriminate between those subjects
who experienced outcome of interest i.e. neonatal death, versus
those who did not. The reason for the other two models to be not a good
fit might be because the number of variables/predictors included in
model 1 and 2 were less as compared to model 3. The wide confidence
intervals for the PAR can be due to the small sample size.
Research in other areas of South Asia like Pakistan
and Nepal, which share similar socio-cultural milieu, has demonstrated
findings similar to our study. A study done by Imtiaz Jehan, et al.
[11] in an urban Pakistani population found that neither delivery in
a health facility nor by health professionals was associated with fewer
neonatal deaths [11]. Another study done in Nepal identified early
childbearing age of the mother as an important risk factor for neonatal
deaths [12]. This finding is further supported by a study done in rural
Bangladesh where the researchers found early childbearing of the mother
as a risk for perinatal deaths [13].
The strength of the study lies in that the data,
because of being routinely collected, is likely to be not subjected to
any bias. The other strength includes use of a conceptual framework and
use of an appropriate model with different levels. However, the study
had limitations that should be noted when interpreting the results.
First, the study variables were limited to those available in the HMIS
dataset. The two major group of factors affecting neonatal outcome would
be those related to the knowledge, attitude and practices (KAP) of
caregivers and proximate biological determinants like birthweight,
gestation, attendance at birth by health care personnel skilled in
resuscitation, breastfeeding etc. However, the focus of our study was
not on biological determinants but to look at social and health system
determinants. They have been adequately covered. Nevertheless, the
results should be interpreted carefully as the lack of key proximate
determinants might have assigned more importance to intermediate and
distal risk factors.
Our current analysis shows that the important
determinants of neonatal mortality lie at community, health system and
social level. A multi-pronged strategy of health system strengthening,
community mobilization, behaviour change is required to address neonatal
issues in the country. The health system strengthening should not be
restricted to public funded facilities but has to include in its ambit
small private sector facilities where many deliveries occur in rural
areas of India.
Acknowledgment: CRHSP Ballabgarh is a
member of INDEPTH Network (www.indepth-network.org). One of the authors,
Purva Rai Dwivedi, is an INDEPTH Fellow and is supported by INDEPTH.
Contributors: AK designed the study; RPU,
PRD and MK performed the analysis and prepared the manuscript; AK, SKR
and PM provided advice on data analysis and revised the final
manuscript. All the authors read and approved the final manuscript.
Funding: None; Competing interests:
None stated.
|
What is Already Known?
• Previous studies on determinants of
neonatal mortality have largely focused on biological
determinants – like birthweight, parity, skill of birth
attendant etc.
What this Study Adds?
• Our hierarchical model shows that the variation in neonatal
mortality is explained more by family (socioeconomic) and
community level determinants.
|
References
1. International Institute for Population Sciences,
Macro International. National Family Health Survey (NFHS-3), 2005 – 06,
India. Mumbai: Volume I, International Institute for Population
Sciences; 2007.p.228.
2. Mann V, Eble A, Frost C, Premkumar R, Boone P.
Retrospective comparative evaluation of the lasting impact of a
community-based primary health care programme on under-5 mortality in
villages around Jamkhed, India. Bull World Health Organ. 2010;88:727-36.
3. Mosley WH, Chen LC. An analytical framework for
the study of child survival in developing countries. Population and
Development Review.1984;10(Suppl):25-45.
4. Mosley WH, Becker S. Demographic models for child
survival and implications for health intervention programmes. Health
Policy and Planning. 1991;6:218-33.
5. Peduzzi P, Concato J, Kemper E, Holford TR,
Feinstein AR. A simulation study of the number of events per variable in
logistic regression analysis. J Clin Epidemiol. 1996;49:1373-9.
6. Rockhill B, Newman B, Weinberg C. Use and misuse
of population attributable fractions. Am J Public Health. 1998;88:15-9.
7. Zhang J, Yu KF. What’s the relative risk? A method
of correcting the odds ratio in cohort studies of common outcome. JAMA.
1998;280:1690-1.
8. Natarajan S, Lipsitz SR, Rimm E. A simple method
of determining confidence intervals for population attributable risk
from complex surveys. Stat Med. 2007; 26:3229-39.
9. Rowe AK, Powell KE, Flanders WD. Why population
attributable fraction can sum to more than one. Am J Prev Med.
2004;26:243-9.
10. Bruzzi P, Green SB, Brinton LA, Schairer C.
Estimating the population attributable risk for multiple risk factors
using case control data. Am J Epidemiol. 1995;122:904-14.
11. Jehan I, Harris H, Salat S, Zeb A, Mobeen N,
Pasha O, et al. Neonatal mortality, risk factors and causes: a
prospective population based cohort study in urban Pakistan. Bull World
Health Organ. 2009;87:130-8.
12. Sharma V, Katz J, Mullany LC, Khatry SK, LeClerq
SC, Shreshta SR, et al. Young maternal age and the risk of
neonatal mortality in rural Nepal. Arch Pediatr Adolesc Med.
2008;162:828-35.
13. Gazi R, Goodburn L, Chowdhury AMR. Risk factors
for perinatal deaths in rural Bangladesh. J Health Popul Dev Ctries.
1999;2:70-7.
|
|
|
 |
|
