|
|
Lead Article Indian Pediatrics 2007; 44:257-262 |
|||||||||||||||||||||||||||||||||||||||||||||||||||||||||||||||||||||||||||||||||||||||||||||||||||||||||||||||||||||||||||||||||||||||||||||||
|
Serum Leptin Levels in Obese Indian Children: Relation to Clinical and Biochemical Parameters |
|||||||||||||||||||||||||||||||||||||||||||||||||||||||||||||||||||||||||||||||||||||||||||||||||||||||||||||||||||||||||||||||||||||||||||||||
|
Leptin, a 167 amino acid 16-kDa peptide product of ob gene, secreted by the adipose tissue plays a crucial role in the regulation of appetite, glucose homeostasis and body fat. Defects in leptin production or function are associated with obesity in animal models and humans. Though increased leptin levels have been demonstrated in obesity implicating leptin resistance in human obesity(1), there is a paucity of data regarding mutations in leptin and leptin receptor genes(2-3). Leptin expression is regulated by several tightly controlled factors influencing energy metabolism and levels of leptin are related to parameters of obesity. This study was done to evaluate serum leptin levels in obese Indian children and to observe its correlation to anthropometric and laboratory parameters of obesity. Obese adults were recruited to observe age-dependent relationship of leptin levels and obesity. Leptin levels have been found to correlate with clinical and biochemical parameters of obesity in Indian adults(4). Subjects and Methods Children with obesity (body mass index, BMI >95th percentile for age and gender(5,6) presenting to the Pediatric Endocrine Clinic were included in the study. Children with genetic and endocrine causes of obesity were excluded. Age and gender matched children without obesity (BMI <85th percentile for age and gender), attending outpatient department for minor illnesses were included as controls. Adult subjects were selected from the medical outpatient department of our hospital. The study group comprised of 36 children (26 boys and 10 girls, age 1.5 to 15 years) and 37 adults (21 men and 16 women, age 25 to 69 years) with obesity and 29 controls (15 children and 14 adults). The study was approved by the institutional review committee. Informed consent was obtained from study subjects and/or parents. Clinical evaluation included detailed history and examination to detect secondary causes of obesity. Clinical features such as dysmorphism, striae, abnormal blood pressure and endocrinopathies were looked for. Thyroid profile and urine free cortisol were performed if indicated. Weight was measured using a beam balance to the nearest 0.1 kg while wearing light clothing. Height was measured using a stadiometer to the nearest 1 mm. BMI was calculated by standard formula. Abdominal girth was measured at the level of umbilicus with the subject relaxed and standing. Hip girth was measured at widest point of the hips at the level of the greater trochanter with the patient standing with both feet together. Waist-to-hip ratio (WHR) was calculated from these measurements. Pubertal status was assessed using Tanner staging. Blood samples for biochemical parameters were obtained in the morning after an overnight fast. Serum was separated and stored at –80ºC until analysis. Leptin assay was performed using a competition ELISA kit (DRG Instruments GmbH Germany, DRG International Inc. USA). The lowest detectable level of serum leptin was 0.2 ng/mL. Simultaneously estimation of biochemical parameters including blood glucose and lipid profile was done. Sample size calculation for children and adults were performed separately. Considering a standard deviation (SD) for leptin levels of 8 ng/mL, 12 children were required in each group to detect a mean difference of 20 ng/mL with 95% confidence level and 90% power. For adults 14 subjects were required per group to detect the difference in mean leptin level of 20 ng/mL with SD of 10 ng/mL. We included 36 obese and 15 non-obese children and 37 adults and 14 as controls, which is more than the calculated sample size. Data was recorded on a predesigned proforma and managed on an Excel spreadsheet. Student’s t test was used to compare mean values for age and lipid parameters between cases and controls. As the distribution of age and sex was different amongst obese children and controls, analysis of co-variance was used to compute the mean values of leptin in the two groups, adjusting for the imbalance in age and sex distribution. Pearson’s correlation coefficient was used to compute the strength of relationship of leptin with various quantitative parameters for each group. STATA 9.0 statistical software was used for data analysis. P value less than 0.05 was considered significant. Results All anthropometric parameters were higher in obese subjects compared to controls (Table I). BMI was >28 kg/m2 in all obese children and >31 kg/m2 in eight. History of excessive appetite was present in 23 children (65%). Family history of obesity was present in 70% of obese subjects and none in controls. Family history of type 2 diabetes mellitus was present in 14 obese children; seven had family history of hypertension. Twenty-two children belonged to high-income groups and parents of fourteen children were working in government organizations. Most children (90.8%) were in Tanner stage I of puberty followed by stage II (2.9%) and stage III (6.3%). TABLE I Comparison of Various Parameters Between Obese Children and Controls
Serum leptin levels in obese children were significantly higher than controls (19.4 ± 6.4 ng/mL, range 0.5-25 ng/mL against 5.4 ± 1.7 ng/mL, p = 0.0001)(Table I). Obese girls had higher leptin levels than obese boys (23.5 ± 1.7 ng/mL against 18.0 ± 7.6 ng/mL, p = 0.04). Obese adults had higher serum leptin levels than controls (18.9 ± 6.4 ng/mL against 7.8 ± 5.6 ng/mL, p = 0.0001)(Table II) with higher levels in obese women compared to obese men (21.3 ± 4.4 ng/mL against 15.8 ± 7.4 ng/mL). There was no difference in fasting blood glucose levels of obese and control children. Serum total cholesterol, triglycerides, and LDL-cholesterol levels were significantly higher in obese children compared to controls (Table II). HDL-cholesterol levels were not significantly different in the two groups. TABLE II Comparison of Various Parameters Between Obese Adults and Controls
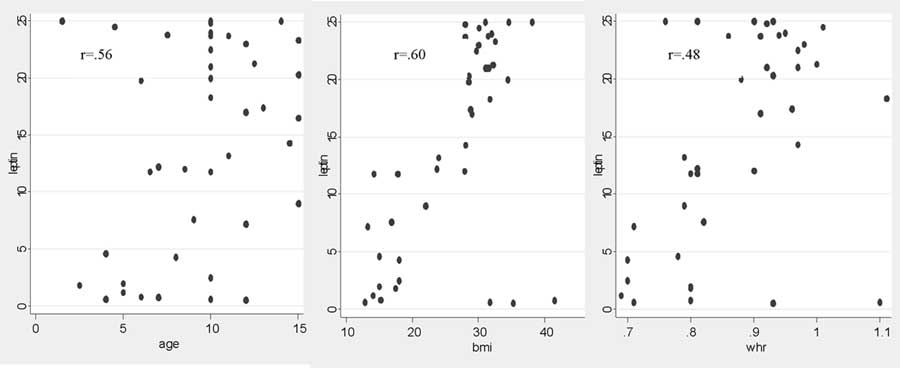
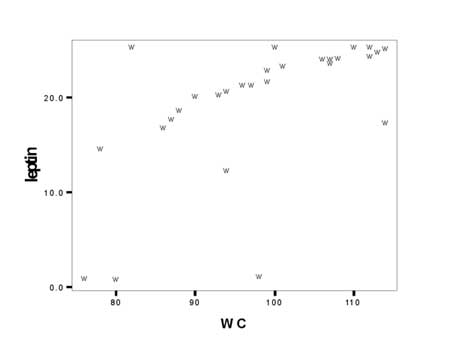
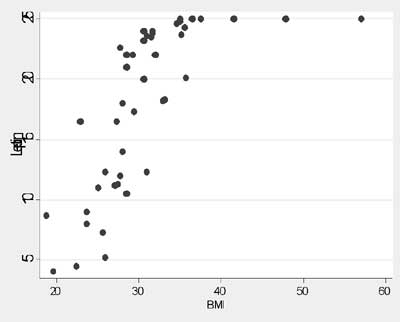
In children, serum leptin levels correlated with age (r = 0.56) and BMI (r = 0.60)(Fig. 1). Good correlation was observed between leptin levels and waist circumference (r = 0.6) and WHR (r = 0.48) (Fig. 2). Very low serum leptin levels were observed in three children with obesity. They did not differ clinically from other obese children. There was no difference in clinical parameters of children with or without family history of obesity and/or diabetes mellitus. There was a good correlation between serum leptin levels with total cholesterol, triglycerides and LDL-cholesterol, whereas no correlation was observed with HDL-cholesterol. There was no correlation between fasting blood glucose and leptin levels. None of the children had clinical features of ‘metabolic syndrome’.
Discussion This study demonstrates that leptin levels correlate with clinical and laboratory parameters of obesity. Leptin levels are higher in obese subjects, a finding confirmed in this study(7,8). In our study, about 91% of obese children had high serum leptin levels suggesting a role of leptin resistance in the pathogenesis of obesity. Leptin resistance at the level of hypothalamus may result in increased appetite and decreased energy expenditure(9). Leptin deficiency is an uncommon cause of obesity. Low leptin levels were seen in only three obese children. Previous studies showed that only 5% of obese humans have low serum leptin levels relative to body fat content(7,10). We observed positive correlation of leptin with age in obese children but not in obese adults, as most obese adults in our study were of same age group. Leptin levels decline with age due to alterations in adiposity and BMI(11). In adult obese group, significant positive correlation was seen between leptin and BMI. Our study confirms previous findings of higher leptin levels in obese females(12,13). This is attributed to inhibitory effect of testosterone on leptin production(14). Higher leptin levels in females indicate leptin resistance and a putative role in the regulation of reproductive function. Despite good correlation of leptin and BMI, we observed significant variability in leptin levels in subjects with similar BMI. This may be related to differences in body composition and fat distribution. Maffie, et al. described significant heterogeneity in leptin concentration in subjects with similar BMI(10). It is possible that subjects with appropriate leptin levels are able to keep their weight stable, whereas those with lower levels are prone to weight gain. Another possibility could be the differential sensitivity of individuals to leptin. Leptin resistance in some animal models of obesity is due to mutation in the receptor gene(15) or leptin resistance induced by a high fat diet(16). Further studies are needed to explore whether genetic or acquired leptin resistance exists in man. We observed positive correlation of serum leptin levels with WHR, unlike a previous study, which indicated that visceral adiposity had negative correlation with leptin concentration(17). Signifi-cant correlation of leptin levels with waist circumference and WHR suggests role of leptin in regulation of visceral adiposity. No correlation of leptin with fasting blood glucose levels was observed in this study similar to adult diabetic patients in a previous study(4). Leptin levels were not related to diabetic severity in African Americans and Japanese subjects(18,19). Neither was any correlation seen in prepubertal, pubertal nor in young adult, obese and non-obese diabetics(20). The relationship between serum leptin and lipids remains unclear. Low HDL-cholesterol levels are associated with high leptin levels(21). Plasma leptin concentrations show significant positive correlation with triglycerides, LDL, and Apo-B, but negative with HDL and Apo-A in children(22). Some studies found no significant relationship between leptin and lipids or lipoproteins(4,8), whereas in others lipids showed significant correlation with leptin levels(23). In our study, a positive correlation was seen between serum leptin and total cholesterol, LDL and triglycerides. No correlation was seen with HDL-cholesterol. These observations indicate a role of leptin resistance in the pathogenesis of dyslipidemia. This needs confirmation in large cohort studies. Leptin levels are shown to predict the development of the metabolic syndrome independent of baseline obesity(24). None of the children in this study had evidence of metabolic syndrome. In conclusion, our study shows that serum leptin levels correlate with clinical and biochemical parameters of obesity. Positive correlation of obesity with markers of abdominal adiposity needs confirmation by larger studies. There is a need for further investigation on the role of leptin in childhood obesity and its complications including metabolic syndrome. Contributors: SD planned the study, collected and analyzed the data, and drafted the manuscript. MK, AB and PSNM were involved in the management of the patients. MH helped in the laboratory work up. RMP did the statistical analysis. MK, RMP and RKG supervised the study and reviewed the manuscript. PSNM was involved in the design of the study, critically reviewed the manuscript and will act as the guarantor of the study. All authors read and approved the final manuscript. Competing interests: None stated. Funding: Nil.
| |||||||||||||||||||||||||||||||||||||||||||||||||||||||||||||||||||||||||||||||||||||||||||||||||||||||||||||||||||||||||||||||||||||||||||||||
|
References | |||||||||||||||||||||||||||||||||||||||||||||||||||||||||||||||||||||||||||||||||||||||||||||||||||||||||||||||||||||||||||||||||||||||||||||||
| |||||||||||||||||||||||||||||||||||||||||||||||||||||||||||||||||||||||||||||||||||||||||||||||||||||||||||||||||||||||||||||||||||||||||||||||
![]()