|
MR Savitha and Nithin Kondapuram
From Department of Pediatrics, Mysore Medical College
and Research Institute, Mysore, karnataka, India.
Correspondence to: Dr MR Savitha, No. 79/A, 4th
Main, Maruthi Temple Road, Saraswathipuram, Mysore 570 009, India.
Email: [email protected]
Received: September 1, 2011;
Initial review: September 19, 2011;
Accepted: April 09, 2012
PII: S097475991100730-2
|
|
Many studies have
compared 2006 WHO charts [1] with various other charts.
Comparison of WHO charts with UK 1990 growth charts proved that
WHO charts would set a markedly lower standard of weight gain
beyond 4 months of age for UK infants [2]. Comparison of WHO
charts with CDC charts proved that CDC charts reflect a heavier
and shorter sample [3]. Comparison of Canadian growth charts
with WHO charts showed that breast fed infants followed WHO
standards and hence, WHO growth charts could be used for the
Canadian infants [4]. The growth monitoring guidelines meeting
of the Indian Academy of Pediatrics (IAP) recommended growth
charts compiled by Agarwal, et al. [5,6] for Indian
children. These charts shall be referred to as IAP charts
throughout this paper. As the pediatricians in our country
frequently use either WHO charts or IAP charts, the present
study was undertaken to compare the two charts in terms of the
percentage of children who were detected as underweight or
stunted according to WHO and IAP weight and height charts,
respectively.
Methods
This cross-sectional study was conducted from
July 2009 to July 2010. Children under 5 year of age attending
Anganwadi centres in and around Mysore city in Karnataka state
of Southern India were selected by simple random sampling. The
study was approved by the Institutional ethical committee and
informed consent was taken from parents of all children included
in the study. Any child with obvious skeletal or neurological
problem hindering evaluation of physical growth was excluded
from the study. Age was obtained from the anganwadi records.
Weight of the child was recorded in kilograms with minimal
clothing using Salter weighing scale provided by UNICEF (model
235 6S) with accuracy of 100 g and maximum reading of 25 kg.
Length was measured in children less than 2 years using
Infantometer with an accuracy of 0.5 cm. Height was measured in
children more than 2 years of age with accuracy of 0.5 cm.
Height in centimeters was marked on the wall with the help of
measuring tape. Children were made to stand bare feet with
heels, back and occiput against the wall with Frankfurt plane
being parallel to the ground. A scale was brought to the topmost
point of head and reading was taken avoiding parallax. Two
readings were averaged for analysis. Measurements were done by
final year medical students under the supervision of a
Pediatrician. Throughout the present paper, height refers to
either recumbent length/height. Anthropometric data were plotted
separately on both WHO and IAP charts. Those below 3rd
percentile in weight charts were classified as underweight,
between 3rd and 97th
percentile as normal and more than 97th
percentile as overweight. Those below 3rd
percentile in height charts were classified as stunted, and more
than 97th percentile
as tall. Socioeconomic status was determined by modified
Kuppuswamy’s classification [7].
A minimum sample size calculation of 661 was
done assuming a population of 10 lakhs with 30% children and 5%
prevalence of severe underweight (with worst acceptable result
of 3.5%) and a 0.05 significance level. All statistical methods
were carried out through SPSS for windows (version 16.0). Chi
square test was employed to get an association between WHO and
IAP charts. P value <0.05 was taken as statistically
significant.
Results
The study group consisted of 2126 children
below the age of five years from 132 anganwadi centres. 21
children were excluded due to lack of proper confirmation of
age. A total of 2105 children were finally included in the
study. All of them belonged to class IV and V socioeconomic
class according to modified Kuppuswamy’s classification. The
baseline characteristics of children included in the study is
shown in Table I. Comparison of IAP and WHO growth
charts with respect to weight and height is shown in Table
II. WHO charts detected more boys as underweight
compared to IAP charts (P<0.0001). When weight charts for
girls was compared, there was no difference between the two
charts. WHO charts were detecting more children with stunting
than IAP charts, which was true for both boys and girls (P=0.001).
TABLE I Baseline Characteristics of Children
|
Parameter |
Boys (n=1137) |
Girls (n=968) |
| Age
0-12 mo |
19 |
12 |
| Age
13-24 mo |
85 |
60 |
| Age
25-36 mo |
316 |
272 |
| Age
37-48 mo |
419 |
374 |
| Age
49-60 mo |
298 |
250 |
| Mean
(SD) age (mo) |
39.7
(11.2) |
40.3
(10.2) |
| Mean
(SD) weight (kg) |
12.2
(1.9) |
12
(1.9) |
| Mean
(SD) height (cm) |
90
(7.2) |
88.8
(7.2) |
TABLE II Comparison of WHO and IAP charts
|
Parameter |
Sex |
Classification |
WHO |
IAP |
P |
|
Weight |
Boys
(N=1137) |
Underweight |
791
(69.6%) |
676(59.4%) |
<0.0001 |
|
|
Normal |
346
(30.4%) |
461(40.6%) |
|
|
Girls (N=968) |
Underweight |
606
(62.6%) |
601
(62.1%) |
0.935 |
|
|
Normal |
362
(37.4%) |
367
(37.9%) |
|
|
Height |
Boys
(N=1137) |
Stunted |
897
(78.8%) |
709
(62.3%) |
0.001 |
|
|
Normal |
240
(21.2%) |
428
(37.7%) |
|
|
Girls (N=968) |
Stunted |
789
(81.5%) |
613
(63.3%) |
0.001 |
|
|
Normal |
179
(18.5%) |
355
(36.7%) |
|
Discussion
In the present study, it was found that
except for weight charts for girls, the WHO and IAP weight and
height charts for boys and girls were not comparable with each
other. The strength of the present study is the large sample
size. The limitations were that the study was conducted in a
single urban city in southern India and also all the children
were from low socioeconomic class. Hence, our results are not
representative of the entire country. Prinja, et al. [8]
compared WHO chart with the growth chart used in ICDS
(Integrated child development services) program which is based
on Harvard growth standards and concluded that the prevalence of
underweight was 1.4 times higher with Harvard standards, except
in first 6 months of life where it was 1.6 times higher with WHO
standards. Deshmukh, et al. [9] compared WHO charts with
NCHS charts and concluded that the prevalence of underweight by
WHO standards was significantly lower (47%) compared to NCHS
references (53%). Another study on use of WHO standards on 2-5
year old affluent urban Indian children concluded that the
growth performance of these children was suboptimal compared
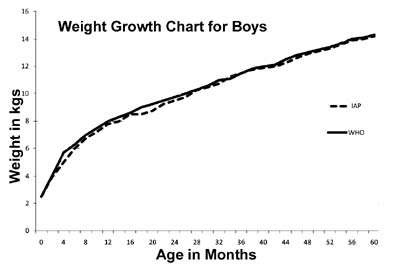
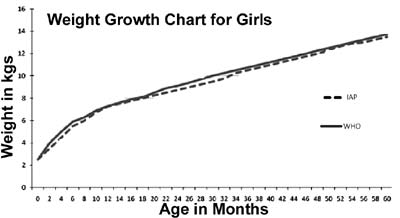
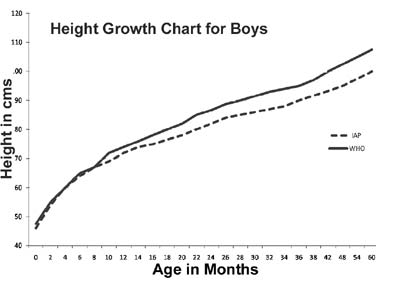
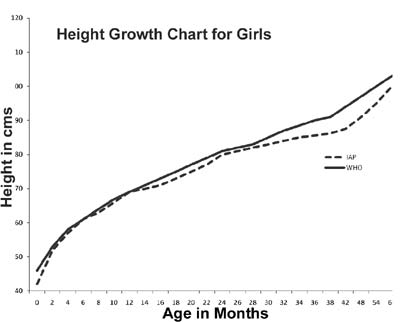
with WHO standard [10]. When the 3rd
percentile curves of WHO and IAP weight and height charts were
overlapped, it was found that WHO curves were higher than IAP
curves, especially the height curves, as shown in Fig
1. Hence use of multiple charts may lead to confusion
amongst Pediatricians and also it may have impact on National
statistics. Therefore, we suggest uniformity of growth charts
usage amongst pediatricians in India. Hence, further
multicentric studies from all over India are required to decide
on the single appropriate chart to be used for Indian children.
Contributors: MRS conceived and designed
the study and revised the manuscript for important intellectual
content. She will act as gurantor for the paper. NK and MRS
collected data and drafted the paper. Both MRS and NK analysed
data and prepared manuscript. Final manuscript was approved by
both.
Funding: None; Competing interests:
None stated.
|
What This Study Adds?
• Except for weight charts for girls,
the WHO and IAP weight and height charts for boys and
girls are not comparable with each other.
|
References
1. WHO Multicentre Growth Reference Study
Group. Enrolment and baseline characteristics in the WHO
multicentre growth reference study. Acta Paediatr Suppl.
2006;450:7-15.
2. Wright C, Lakshman R, Emmett P, Ong KK.
Implications of adopting the WHO 2006 child growth standard in
the UK: two prospective cohort studies. Arch Dis Child.
2008;93:566-9.
3. de Onis M, Garza C, Onyango AW, Borghi E.
Comparison of the WHO child growth standards and the CDC 2000
growth charts. J Nutr. 2007;137:144-8.
4. Van Dijk CE, Innis SM. Growth curve
standards and the assessment of early excess weight gain in
infancy. Pediatrics. 2009;123:102-8.
5. Khadilkar VV, Khadilkar AV, Choudhury P,
Agarwal KN, Ugra D, Shah NK. IAP growth monitoring guidelines
for children from birth to 18 years. Indian Pediatr.
2007;44:187-97.
6. Agarwal DK, Agarwal KN. Physical growth in
Indian affluent children (birth-6yrs). Indian Pediatr.
1994;31:377-413.
7. Park K. Medicine and social sciences In:
Park K editor. Park’s Textbook of Preventive and Social
Medicine. 20th edition. Jabalpur:Banarsidas Bhanot Publishers;
2009. p.581-615.
8. Prinja S, Thakur JS, Bhatia SS. Pilot
testing of WHO child growth standards in Chandigarh:
implications for India’s child health programmes. Bull World
Health Organ. 2009:87:116-22.
9. Deshmukh PR, Dongre AR, Gupta SS, Garg BS.
Newly developed WHO growth standards: Implications for
Demographic Surveys and Child Health Programs. Indian J Pediatr.
2007:74:987-90.
10. Khadilkar VV, Khadilkar AV, Chiplonkar
SA. Growth performance of Affluent Indian Preschool Children: A
comparison with the new WHO growth standard. Indian Pediatr.
2010:47:869-72.
|