|
Almost one-third of the
children born in India are low birth weight [1] and a large percentage
of them are small for gestational age (SGA). Infants with intrauterine
growth restriction have been reported to have a seven-fold increased
risk of growth failure [2,3] and subsequently adult short stature. In
addition, they are prone to a number of disorders like type II diabetes,
central obesity, hypertension and coronary heart disease in adulthood,
collectively called the "metabolic syndrome"[4,5].
Although there are many recent reports on the growth
of very low birth weight (VLBW) [6] and extremely low birth weight
(ELBW) infants [7], less attention has been paid to the long term growth
of moderately low birth weight (LBW) children. We have previously
reported on the physical growth of LBW children at 12 years [8]. This
study describes the growth at early adulthood of "non-disabled" LBW
children who were born in the late eighties with birth weight less than
2000 grams. We have also tried to find out if there were any early
predictors of metabolic syndrome, such as central obesity or
hypertension. To the best of our knowledge, this is the only Indian
study, where low birth weight children have been followed up till
adulthood.
Methods
The cohort consisted of infants weighing less than
2000g discharged from a neonatal special care unit during a 18 month
period, between October 1987 to April 1989 and followed up prospectively
till the age of 18 years [8-11]. The LBW infants were classified into
AGA or SGA using the criteria of Singh, et al. [12]. Full term
neonates born in the same hospital during the same period with birth
weight ³2500g
with a normal antenatal, natal and postnatal course were enrolled as
controls. All neonatal risk factors were recorded. A detailed
socio-demographic background of each child was obtained by the social
worker by making a home visit. Children with major neurologic sequelae
like cerebral palsy and mental retardation were omitted from this study
at the end of the three year follow up. So, the cohort now consisted of
non-handicapped children, who looked "apparently normal".
Assessment of growth: Weight was measured by an
electronic scale with an accuracy of ± 10g (ATCO Manufacturing Co.,
Ltd., Mumbai). Standing and sitting height was measured to the nearest
0.5cm by a wall-mounted stadiometer using standard technique [13]. Head
circumference was measured using a non-stretchable tape measure. All
anthropometric measurements were taken by trained medical staff. Z
scores or SD scores were calculated for weight, height and head
circumference using gender specific Indian standards [14,15]. An X-ray
of the left hand including the wrist was taken at 12 years and bone age
was determined in the LBW group, after taking parental consent. All X-rays
were assessed by a single observer using TWII standards [16]. Final
height was predicted using the TWII (RUS) scores [17]. This data was
unmasked at 18 years, and correlated with the actual height.
Assessment of adiposity: BMI was calculated and
categorized by the method described by Cole, et al. [18]. Waist
circumference was measured by a nonstretchable tape to the nearest
0.1cm, midway between the lower costal margin and superior iliac crest
in expiration. The reading was plotted using centiles given by McCarthy,
et al. [19]. Hip circumference was measured at the point of
maximum protuberance. A waist/hip ratio greater than 0.9 was considered
as obese [20]. Waist/height ratio was also determined. A ratio of more
than 0.5 was considered as obese [21]. Skinfold thickness was measured
at 4 sites – biceps, triceps, subscapular and suprailiac. The sum of
these 4 skinfold thickness was used to determine the percentage of body
fat using Durnin equation [22].
Blood pressure: Blood pressure (BP) was measured
with a standard sphygmomanometer. Subjects were seated and after 5
minutes of rest, the BP was measured with a cuff two thirds the size of
the upper arm length. The mean of three readings of systolic and
diastolic pressure was recorded. Hypertension was defined as systolic
pressure above 140 mm Hg, and diastolic pressure above 90 mm Hg [23].
Socio-economic status was determined by using the
revised Kuppuswamy Scale [24]. Height and weight of both parents was
measured. Ethical permission was obtained from the hospital’s Ethics
Committee. Consent of both the parents was obtained at the time of
enrollment in the study.
Statistical analysis: The data was entered
into the computer and statistical analysis was done using Statistical
Package for Social Science (SPSS) for Windows (version 11.5). The linear
association between the normally distributed variables was assessed by
Pearson’s correlation coefficients, otherwise Spearman’s correlation
coefficients were used. The partial correlation analysis was also used
to test the independent associations between variables like age, sex and
socio-economic status.
The LBW and the control groups were first compared by
using analysis of variance (ANOVA) procedure with Bonferroni’s method of
correction for multiple group comparisons. The nonparametric test like
Mann Whitney U test was performed to test the significance of difference
between the means of two independent groups with non-normally
distributed variables. For finding the independent predictors of several
quantitative variables multivariate analysis was carried out by multiple
linear regression technique. Standardized scores (SD scores) were
calculated by taking appropriate standards [14,15] to assess the
physical growth at 18 years of age.
Results
From the 180 LBW and 90 controls reported upon at 12
years [11], five LBW children and 17 controls were lost to follow up,
and fourteen LBW children refused to come for the assessment. So our
final sample consisted of 161 LBW and 73 normal birth weight controls,
who were followed up since birth. The children who dropped out of the
study were similar to those who continued in the study and showed no
statistically significant difference. Thus, out of the 201 LBW infants,
161 (80%) were available for the final follow up.
The cohort was divided into 4 groups – preterm SGA,
preterm AGA, full term SGA, and full term AGA (controls). The
birthweight of the study group ranged from 860-1999g (mean 1545 ±
243.9g). The gestation of the study group ranged from 28-40 weeks (mean
34.7 ± 2.7). The mean birth weight of the control group was 2835.3 ±
30.5g. There were 131 preterm and 30 full terms in the study group. Out
of the 131 preterms, 61 were small for gestational age and 60 were
appropriate for gestational age. Of the 91 SGA infants, 61 (67%) were
preterm and 30 (33%) were full term. Table I shows the
neonatal data and maternal socio-demographic data.
TABLE I Neonatal and Socio-Demographic Data of the Study Subjects
| |
Cases (n=161) |
Controls (n=73) |
|
Male
(n=91) |
Female (n=70) |
Male
(n=43) |
Female (n=30) |
| Birthweight
(g)* |
1568.9
(223.3) |
1515.1
(267.0) |
2898.8
(337.0) |
2744.3
(230.4) |
| Gestation age
(wks)* |
34.8 (2.6) |
34.9 (2.9) |
39.9 (0.54) |
39.9 (0.51) |
| Small for
gestational age |
49 (53.8%) |
42 (60.0%) |
0 |
0 |
| Appropriate
for gestational age |
42 (46.2%) |
28 (40.0%) |
43 (100.0) |
30 (100.0) |
| Mother’s
height (cm)* |
152.5 (6.7) |
151.2 (7.2) |
152.2 (6.2) |
153.3 (6.2) |
| Father’s
height (cm)* |
161.4 (7.9) |
161.8 (9.8) |
162.9 (5.8) |
162.4 (5.6) |
| Mother’s
weight (kg)* |
56.9 (12.7) |
57.0 (11.4) |
57.6 (10.1) |
58.3 (11.4) |
| Father’s
weight (kg)* |
68.1 (15.7) |
64.2 (14.6) |
66.3 (12.3) |
67.2 (11.5) |
|
Socio-economic status# |
| Higher
|
14 (15.7%) |
16 (23.5%) |
5 (12.2%) |
4 (14.3%) |
| Upper
middle |
23 (25.8%)
|
18 (26.5%) |
7 (17.1%) |
8 (28.6%) |
| Lower
middle |
36 (40.4%) |
22 (32.4%) |
16 (39.0%) |
13 (46.4%) |
| Lower |
16 (18.0%) |
12 (17.6%) |
13 (31.7%) |
3 (10.7%) |
| Maternal
education<10thStd |
42 (47.2%) |
23 (33.8%) |
19 (46.3%) |
11 (39.3%) |
| Father’s
education<10thStd |
25 (28.1%) |
12 (17.7%) |
10 (25.0%) |
4 (14.3%) |
|
*Values are mean (SD). Rest of the values are n (%);#No
significant difference between the LBW and control subjects in
the socio-demographic data. |
TABLE II Comparison of Anthropometric Measurements of Study Groups with Controls
|
Category |
Sex |
Height (cms) |
Weight (kg) |
Sitting Height (cms) |
HC (cms) |
| PT SGA (n=61) |
Male (n=34) |
164.5 (7.3)*
|
53.8 (11.5) |
83.8 (3.6) |
53.4 (2.1)*
|
|
|
(162.0-166.9) |
(49.9-57.7) |
(82.6-85.0) |
(52.7-54.1) |
|
Female (n=27) |
152.9 (6.8) |
44.6 (8.9) |
78.2 (3.9) |
51.3 (1.6)*
|
|
|
(150.3-155.5) |
(41.2-47.9) |
(76.7-79.7) |
(50.6-51.9) |
| FT SGA (n=30) |
Male (n=15) |
168.9 (6.3)
|
54.9 (8.2)
|
85.6 (3.6)
|
53.5 (1.2)
|
|
|
(165.7-172.1) |
(50.7-59.0) |
(83.8-87.4) |
(52.9-54.1) |
|
Female (n=15) |
155.6 (3.6)
|
45.3 (8.8)
|
78.7 (2.5)
|
51.8 (1.8)
|
|
|
(153.8-157.4) |
(40.8-49.8) |
(77.4-79.9) |
(50.9-52.7) |
| PT AGA (n=70) |
Male (n=42) |
168.6 (6.5)
|
55.5 (10.1)
|
85.2 (3.1)
|
54.1 (1.9)*
|
|
|
(166.7-170.6) |
(52.4-58.6) |
(84.3-86.1) |
(53.5-54.7) |
|
Female (n=28) |
153.8 (6.2)
|
49.3 (10.6)
|
79.0 (2.9)
|
51.8 (1.7)*
|
|
|
(151.5-156.1) |
(45.4-53.2) |
(77.9-80.1) |
(51.2-52.4) |
| Controls
(n=73) |
Male (n=43) |
170.2 (5.8)
|
56.3 (10.6)
|
86.0 (2.9) |
54.6 (1.6)
|
|
|
(168.5-171.9) |
(53.1- 59.5) |
(85.1-86.9) |
(54.1-55.1) |
|
Female (n=30) |
156.3 (6.4)
|
48.1 (9.7)
|
80.3 (3.3)
|
53.6 (1.8)
|
|
|
(154.0-158.6) |
(44.6- 51.6) |
(79.1-81.4) |
(52.9-54.2) |
|
Values are mean (SD), (95% CI of mean); * P<0.05
significantly different from controls; HC=Head circumference. |
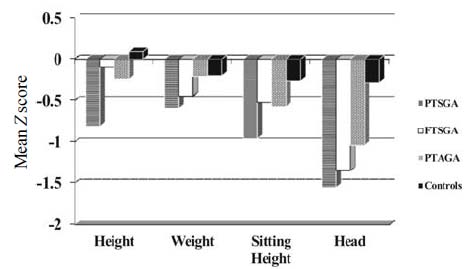
The anthropometric measurements of the cohort are
shown in Table II. The PTSGA males were the shortest in
the group and were significantly shorter (P=0.02) than controls.
The preterm females showed a significantly smaller head circumference
compared to that of controls, the preterm SGA more so (P=0.003)
than the PTAGA (P=0.02). Fig. 1 shows the Z
scores of all the 4 parameters of growth. The preterm subjects had small
head size compared to controls, as well as the smallest sitting height
but none of the subjects showed any disproportion in stature compared to
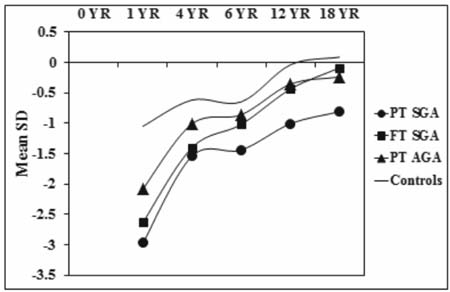
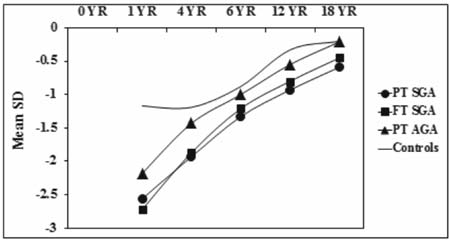
controls. Fig. 2 and 3 show the sex specific growth
trajectory of height and weight from birth to 18 years.
 |
|
Fig. 1 Growth at 18 years by weight
for gestational age (Agarwal, et al. [15] standards).
|
| |
 |
|
Fig. 2 Growth trajectory (height) with
sex-specific SD scores.
|
| |
 |
|
Fig. 3 Gowth trajectory (weight) with
sex-specific SD scores.
|
| |
The bone age was assessed at 12 years and adult
height was predicted. The actual height attained by the LBW children at
18 years was compared with the predicted height, and this showed a good
correlation (r=0.821, P=0.001)
The sex specific adiposity parameters at 18 years are
shown in Table III. There was no significant difference in
these measurements in the PTSGA, FTSGA and PTAGA groups and controls.
Similarly, there was no evidence of adiposity when the BMI and body fat
as a percentage of body weight of these 3 groups was compared with
controls. Only two subjects had hypertension for which no cause could be
found inspite of thorough investigations.
TABLE III Sex Specific Adiposity Parameters at 18 years of Age by Weight for Gestational Age
|
Category |
Sex |
Sum
of 4 skinfolds |
Waist
/ Height |
*Body
fat
|
| PT SGA (n=61) |
Male (n=34) |
52.3 (24.9)
(43.9-60.7) |
0.44 (0.061)
(0.42-0.46) |
18.5 (5.7)
(16.6-20.4) |
|
Female (n=26) |
66.8 (25.3)
(57.1-76.5) |
0.44 (0.049)
(0.42-0.46) |
29.0 (5.4)
(26.9-31.1) |
| FT SGA (n=30) |
Male (n=15) |
47.2 (24.7)
(34.7-59.7) |
0.43 (0.058)
(0.40-0.46) |
17.4 (5.4)
(14.7-20.1) |
|
Female (n=14) |
69.7 (23.3)
(57.4-81.9) |
0.44 (0.047)
(0.42-0.46) |
29.2 (5.3)
(26.4-31.9) |
| PT AGA (n=70) |
Male (n=42) |
55.9 (28.4)
(47.3-64.5) |
0.43 (0.057)
(0.42-0.45) |
19.2 (6.1)
(17.4-21.0) |
|
Female (n=27) |
80.5 (25.0)
(71.1-89.9) |
0.46 (0.064)
(0.44- 0.48) |
31.9 (4.7)
(30.1-33.7) |
| Controls
(n=73) |
Male (n=43) |
49.9 (25.0)
(42.4-57.4) |
0.43 (0.060)
(0.41- 0.45) |
17.9 (5.5)
(16.3-19.5) |
|
Female (n=30) |
67.6 (20.4)
(60.2-74.9) |
0.44 (0.059)
(0.42-0.46) |
29.5 (4.0)
(28.1-30.9) |
|
Values are mean (SD) (95% CI of mean); No statistically
significant difference between adiposity parameters of all four
groups.*Durnin’s equation. |
Morbidity data: Six subjects had myopia and were
wearing glasses. Four subjects had sensori-neural hearing loss and were
wearing hearing aids. Two subjects had epilepsy, but were well
controlled on drugs. Two subjects who had hypertension were controlled
on drugs. Five girls had menstrual problems – 3 had irregular bleeding,
1 had dysmenorrhoea, and 1 had menorrhagia. USG abdomen did not show any
polycystic ovarian syndrome. This morbidity did not cause any
significant abnormality of growth.
Four separate multiple regression models were created
with height, weight, head circumference and BMI, as dependent variables.
The independent variables were grouped as (i) Birth parameters –
weight, sex and AGA/SGA status; (ii) Neonatal risk factors; and (iii)
genetic factors (a) midparental height for the height model, (b)
mother’s and father’s weight for the weight model, and (c)
mother’s and father’s BMI for the BMI model.
The major determinants for height, weight, head
circumference and BMI in the whole LBW group were derived by a multiple
regression analysis. Out of a total variance of 20.7% for height,
midparental height contributed 17.1% variance. For weight, mother’s
weight contributed 23.2% variance out of a total variance of 31.3%.
Birthweight was an important determinant of head circumference. Mother’s
and father’s BMI were found to be important predictors of their
children’s BMI.
The Z scores of midparental height were compared in
the four groups. There was no statistically significant difference
between the midparental height of the PTSGA, FTSGA, PTAGA groups and
controls. When the actual height was plotted against three tertiles of
midparental height, PTSGA children were shorter than controls inspite of
having similar midparental heights.
Discussion
This was the last phase of a long term study spanning
18 years, with a 80% followup of the original cohort. This is the first
Indian report of gender-specific trajectory of growth of low birth
infants born in the late eighties. Our study showed that preterm SGA
males were significantly shorter than controls. There was no difference
in the weight, BMI, and measurements for adiposity in the LBW and
control group. Preterm females showed a smaller head circumference, the
preterm SGA more so than preterm AGA.
Ranke, et al. [25] reported that there was no
difference in the growth of SGA and AGA children at 3.5 years. PTSGA
children in this study remained shorter than controls at 18 years.
Similar findings have been reported by Hack, et al. [6] in VLBW
children at 20 years, and Saigal, et al. [7] in ELBW children. On
multiple regression analysis, midparental height was found to be an
important predictor of height at 18 years for the whole LBW group. In a
recent study of moderately low birthweight children, Odberg, et al.
[23] found that parental height was an important determinant of height.
However, in our study, inspite of normal midparental height, the PTSGA
children were significantly shorter.
There was no difference in the weight of the study
and control group. Hack, et al. [6] reported lower weights in
VLBW males at 20 years, as well as lower BMI. There was no difference in
the BMI and measurements of adiposity between the LBW and control group.
Both weight and BMI were predicted by mother’s and father’s weight and
BMI, respectively. We found little evidence in our cohort of a
relationship between socio-economic status and growth. Similar findings
were reported previously in VLBW children [6].
Birthweight was the only important biological factor
as a predictor of head circumference. Prediction of adult height from
bone age done at 12 years in LBW children has not been described before.
It was interesting to see the agreement between predicted height and
actual height, even amongst SGA children.
Barker, et al. [4] have described the tendency
of low birthweight children (especially with intrauterine growth
restriction) to develop metabolic syndrome in adulthood. We found no
evidence of adiposity, at least in early adulthood, and no hypertension.
Several studies have reported higher blood pressure in VLBW infants in
late adolescence [26] and in VLBW infants at early adulthood [27]. We
plan to follow up these children further to look for early predictors of
the metabolic syndrome.
The strengths of this longitudinal study include its
gender specificity, and the use of Z scores which are comparable
across ages and provide a more sensitive assessment of deviations of
growth, than the use of percentiles or cut offs of subnormal growth. A
major strength was the high participation rate over time and complete
parental information in the form of height, weight, education and
socio-economic status. Adults who were moderately premature and
moderately low birth weight were included, a group that is rarely
considered in follow up studies. Since the study started in the
preventilation era in India, a weakness was the small number of
extremely low birth weight babies in the cohort.
Contributors: SC: conceived the study, supervised
it, wrote the manuscript and is the guarantor of the paper. MO:
supervised data collection and analysed data. BK: collected data. AP:
supervised the project. MH: Made home visits, ensured appointments,
MGS.. did statistical analysis.
Funding: ICMR, New Delhi; Competing interests:
None stated.
|
What is Already Known?
• Preterm SGA children have short stature in
adulthood.
What This Study Adds?
• Parental height, weight and BMI are
important factors in determining the same in LBW children at
early adulthood.
• Central obesity and hypertension were not
found at 18 years of age.
• Bone age at 12 years can predict height at
adulthood, even in preterm SGA children.
|
| |
References
1. National Neonatal-Perinatal Database NNPD Network.
Indian Council of Medical Research. 2002;2003:25.
2. Leger J, Marchal CL, Bloch J, Pinet A, Porquet D,
Czernichow P. Reduced final height and indications for insulin
resistance in 20 years olds born small for gestational age: regional
cohort study. BMJ. 1997;315:341-7.
3. Paz I, Seidman DS, Danon YL, Laor A, Stevenson DK,
Gale R. Are children born small for gestational age at increased risk of
short stature? Am J Dis Child Pediatr Res. 1993;147:337-9.
4. Barker DJP, Hales CN, Fall CHD, Osmond C, Phipps
K, Clark PMC. Type 2 (non-insulin-dependent) diabetes mellitus,
hypertension and hyperlipidemia (syndrome X): relation to reduced foetal
growth. Diabetologia. 1993;36:62-7.
5. Frankel S, Elwood P, SwerthamP, Yarnell J, Davey
Smith E. Birthweight, body mass index and incident coronary heart
disease. Lancet. 1996;348:1478-80.
6. Hack M, Schluchter M, CartarL, Mabhoob R, Cutter
L, Borawski E. Growth of very low birth weight infants to age 20 year.
Pediatrics. 2003;112:e30-38.
7. Saigal S, Stoskopf B, StreIner D, Paneth N,
Pinneli J, Boyle M. Growth trajectories of extremely low birth weight
infants from birth to young adulthood: a longitudinal population based
study. Pediatr Res. 2006;60:751-8.
8. Chaudhari S, Otiv M, Hoge M, Pandit A, Mote A.
Growth and sexual maturation of low birth weight infants at early
adolescence. Indian Pediatr. 2008;45:191-8.
9. Chaudhari S, Kulkarni S, Pandit A, Deshmukh S.
Mortality and morbidity in high risk infants during a six year follow
up. Indian Pediatr. 2000;37;1314-20.
10. Chaudhari S, Otiv M, Chitale A, Hoge M, Pandit A,
Mote A. Biology versus environment in low birth weight children. Indian
Pediatr. 2005;42:763-70.
11. Chaudhari S, Otiv M, Chitale A, Pandit A, Hoge M.
Pune low birth weight study – cognitive abilities and educational
performance at twelve years. Indian Pediatr. 2004;41:121-8.
12. Singh M. Care of the Newborn. 4thedn. New Delhi,
Sagar Publications. 1979:2.
13. Tanner JM. Normal growth and techniques of growth
assessment. Clin Endocrinol Metab. 1986;3:411-51.
14. Agarwal DK, Agarwal KN. Physical growth in Indian
affluent children (Birth – 6 years) Indian Pediatr. 1994;31:377-413.
15. Agarwal DK, Agarwal KN, Upadhyay SK, Mittal R,
Prakash R, Rai S. Physical and sexual growth pattern of affluent Indian
children from 6 to 18 years of age. Indian Pediatr. 1992;29:1203-83.
16. Tanner JM, Whitehouse RH, Marshall WA, Healey
MJR, Goldstein H. Assessment of skeletal maturity and prediction of
adult height (TW II) method. London, Academic Press. 1975.
17. Tanner JM. Growth at adolescence 2nd. edn. Oxford
Blackwell Scientific Publication. 1962.
18. Cole TJ, Bellizzi MC, Flegal KM, Deitz WH.
Establishing a standard definition for child overweight and obesity
worldwide. International survey. BMJ. 2000;320:1-5.
19. McCarthy HD, Jarrett KV, Crawley HF. The
development of waist circumference percentiles in British children aged
5-16.9 years. Eur J Clin Nutr. 2001;55:902-7.
20. Taylor RW, Jones JE, Williams SM, Goulding A.
Evaluation of waist circumference, waist to hip ratio and the tonicity
index as screening tools for high trunk mass, as measured by dual
energy. X ray absorptiometry in children aged 3-19 years. Am J Clin Nutr.
1989;69:308-17.
21. McCarthy HD, Ashwell M. A study of central
fatness using waist to height ratios in UK children and adolescents over
two decades supports the simple ménage " keep your waist circumference
to less than half of your height." Int J Obes. 2006;30:988-92.
22. Durnin JYGA, Womersley J. Body fat assessed from
total body density and its estimation from skinfold thickness:
measurements on 481 men and women aged 16-72 years. Br J Nutr.
1974;32:77-94.
23. Odberg MD, Sommerfelt K, Markestad T, Elgen IB.
Growth and somatic health until adulthood of low birthweight children.
Arch Dis Child Foetal Neonatal Ed. 2010;95:F201-5.
24. Kuppuswamy B. Manual of socio-economic status
(Revised) Manasayan, New Delhi, 1991.
25. Ranke MB, Vollmer B, Traunecker R, Wollman HA,
Goelz RR, Seibolweiger K. Growth and development are similar in VLBW
children born appropriate and small for gestational age: an interim
report of 97 preschool children. J Pediatr Endocrinol Metab.
1997;20:1017-26.
26. Doyle LW, Faber B, Callanan C, Morley R. Blood
pressure in late adolescence and very low birth weight. Pediatrics.
2003;111:252-7.
27. Hack M, Schluchter M, Cartar L. Blood pressure
among very low birth weight (<1.5kg) young adults. Pediatr Res.
2005;58:677-84.
|


