|
Growth Charts Suitable for
Evaluation of Indian Children |
R. Khadgawat, P. Dabadghao, R.N. Mehrotra and V. Bhatia
From the Department of Endocrinology, Sanjay Gandhi Postgraduate Institute of Medical Sciences, Lucknow, India.
Reprint requests: Vijayalakshmi Bhatia, Associate Professor, Department of Endocrinology, Sanjay Gandhi Postgraduate Institute of Medical Sciences, Rae Bareli Road, Lucknow 226 014, India.
Manuscript received: January 21, 1998; Initial review completed: March 5, 1998;
Revision accepted: April 22, 1998.
Abstract:
Objective: To assess the suitability of recently published reference anthropometric data for evaluation of the growth of children in our region. Setting: Referral Pediatric Endocrinology Clinic in tertiary level care hospital. Subjects: 280 normal school children and 155 children referred for growth retardation to the clinic in 1993 and 1994. Methods: Heights of school children were plotted on growth charts created from recently published reference growth data of children from high socioeconomic group families. The case records of 155 children referred for growth evaluation were retrospectively analyzed for (i) etiology of short stature, (ii) height percentile based on previously used Indian Council of Medical Research (ICMR) references, and
(iii)
height percentile and standard deviation scores based on the new references. Results: 93% of school children fell above and 7% below the 5th centile of the new height references. Of the 129 clinic children diagnosed to have growth retardation, 128 fell below the 5th centile of the new references. However, 38 of these (29.5%) fell above the 5th centile of
ICMR
references. These included patients with pathological causes of short stature. Twenty four of 26 children labelled as having no growth problem fell above the 5th centile of new reference data. Conclusions: The 5th height centile of new reference data from high socioeconomic group children is an appropriate cut off below which to evaluate children for short stature in our region. It will allow earlier identification and treatment than the hitherto used ICMR percentiles, and yet is not expected to result in over investigation of normal children.
Key
words:
Growth, Growth standards, Indian children.
NORMAL growth is an indirect indicator of the overall well-being of a child. Therefore, yearly evaluation of height and weight of all children is important. Due to differences in height and weight of normal people of different ethnic groups, each country should have its own growth standards against which to evaluate children. These must be derived from carefully selected samples of children growing in
an optimal environment. In India, the first such attempt was made by
the Indian Council of Medical Research (ICMR)(1) and these ICMR standards have been hitherto used for evaluation of the growth of normal Indian children. Unfortunately, these were drawn mainly from the lower socio-economic
group. Thus, the reference population could not have been truly "normal". Many of the subjects must have been stunted due to chronic under- nutrition. Also, this study was conducted four decades ago (1956-1965). Since then there has been improvement in the socio-economic status of the general population. The resultant general improvement in health and nutrition has resulted in an upward trend in growth in many countries(2). There was a need for new reference data from healthy well-nourished Indian children. Many studies tried to formulate such reference data(3-7), but in all these studies, the sample size was very small and they were more regional rather than representative of the whole country. In 1992 and 1994, Agarwal et al. published the results of a large multicenter survey of growth and development of Indian children(8,9). The study was carried out with children from the upper socio-economic group. It was performed simultaneously in all regions of the country in 12 cities.
We conducted this study to assess whether the new
percentiles(8,9) would be appropriate for evaluation of the
growth of children in our region. We retrospectively analyzed
the patients referred to our Pediatric Endocrine Clinic for the complaint of growth retardation, to establish whether the use of these percentiles by the referring pediatrician would, in each patient, have resulted in: (a) appropriate referral of the short or slowly growing child, (b) more importantly, earlier identification and evaluation of the patient, and (c) recognition of children with normal stature, so that they may not be unnecessarily investigated. In order to further examine the applicability of these percentiles to our catchment population, we plotted the height and weight of 280 healthy school
children on
these charts. Our aim was to find out whether or not an inappropriate number of healthy children would be labelled as short, using these growth charts.
Methods
The study was conducted in two parts. The first part consisted of a retrospective
analysis of the records of patients referred to our clinic for the complaint of growth retardation between January 1993 and December 1994. Our hospital is a paying hospital and the patient population is relatively well-to-do (middle and upper socio-economic). Only those children who had a follow up period of at least one year, or whose definitive diagnosis had been made within that period, were included in the
analysis. For each patient, the following data were recorded: height percentile using the ICMR chart, height percentile using the Agarwal chart, height standard deviation (SO) score using the Agarwal chart (height
SD score
=
[mean height for age
-
observed
height]/SD of height for that age), and etiology of short stature. Heights were taken using a wall mounted Holtain stadiometer in older children and in children below 2 years, length was taken using
a Holtain infantometer.
During 1993 and 1994, in our clinic protocol, a child was labelled as growth
retarded if he/she was: (a) below the 5th ICMR percentile, or (b) more than 5 cm below the midparental
(target) height percentile, or (c) exhibiting a low growth velocity for his/her age. If a thorough history and examination did not reveal a cause for short stature, the following simple tests were done: hemoglobin, erythrocyte sedimentation rate, serum chemistry for liver and kidney functions, serum alkaline phosphatase and electrolytes, thyroxine and/or thyroid stimulating hormone, urinalysis, stool examination for cysts, X-ray of the skull and of the hand. If these did not re- veal a cause for short stature, the following tests were considered (either immediately or after a period of watching growth velocity): tests for growth hormone (GH) deficiency, malabsorption or renal tubular acidosis, and in girls, karyotype to look for Turner syndrome. Children whose height
percentile was within the target height, had normal growth velocity over a year of follow-up, and bone age corresponding. to chronological age, were categorized as having familial short stature. Children who were short for target height, had a bone age delay of more than two years, but had normal growth velocity and investigations, were labelled as having constitutional delay of growth.
The second part of the study was conducted in a central school run by the hospital. All permanent employees of the hospital are given equal opportunity to educate their children here. Two hundred and eighty normal children between the ages of I 3.5 years to 18 years were weighed on a spring balance and measured on a portable Holtain stadiometer. Their height and weight readings were plotted on Agarwal percentile charts for boys and girls. We have prepared these charts in the graph
form from the published references(8,9), for routine use in our clinic.
Results
Of the 188 patients referred during the 2 year period for growth retardation, 155 had sufficient follow up to allow reliable diagnostic categorization. We labelled 129 as short and 26 as normal. Table I shows the etiology and height Z score in the 129 children with short stature. Patients with all categories of physiological and pathological short stature were far more than 2 SD below the mean height for age, at the time of evaluation. The systemic causes included celiac disease (6 cases), severe chronic anemia (4 cases), renal tubular acidosis. (2 children), giardiasis causing malabsorption (2 subjects), steroid dependent nephrotic syndrome (2 cases), chronic renal
failure (1 child), rheumatic heart disease (1 child) and others (6 subjects).
TABLE I
Diagnostic Category, Height Standard Deviation Scores and Height Percentile of 129
Short Children
Diagnosis
|
N(%) |
Height
Z score |
Children between 5th Agarwal and ICMR
centiles N (%) |
|
Physiological |
|
|
|
|
Familial |
25(19.4) |
-2.37 |
12(48) |
|
CDGP |
24(18.6) |
-2.87 |
10(41.7) |
|
Pathological |
|
|
|
|
GH deficiency |
10 (7.8) |
-3.87 |
1(10) |
|
Hypopituitarism |
10(7.8) |
-4.95 |
2(20) |
|
Hypothyroidism |
6(4.7) |
-3.53 |
2(33.3) |
|
Turner syndrome |
13(10.1) |
-3.53 |
4(30.8) |
Genetic (and skeletal
dysplasias)
|
17(13.2) |
-3.64 |
5(29.4) |
|
Systemic illness |
24(18.6) |
-4.55 |
2(8.33) |
|
Total |
129 |
|
38(29.5) |
CDGP = Constitutional delay of
growth and puberty; GH = growth hormone.
Ninety of the 129 short children were
below the 5th ICMR centile
in height.
Another 38 patients (29.4%) were above the 5th percentile in height based on the ICMR charts, but below the 5th percentile of the Agarwal chart (Table I). These patients had undergone evaluation on the basis of either subnormal growth velocity or their height percentile being significantly lower than mid parental height percentile. Only 1 patient (of constitutional delay of growth and puberty) was above the 5th percentile of the Agarwal chart. All except 2 of the 26 patients previously categorized by us as having normal stature, were now also found to fall above the 5th Agarwal percentile. These 2 patients would now be labelled as having familial short stature, using the Agarwal 5th centile cut-off, and the 24 would be labelled
as normal. In contrast, the NCHS 5th centile cut-off would have labelled 13 (50%) of these children as short.
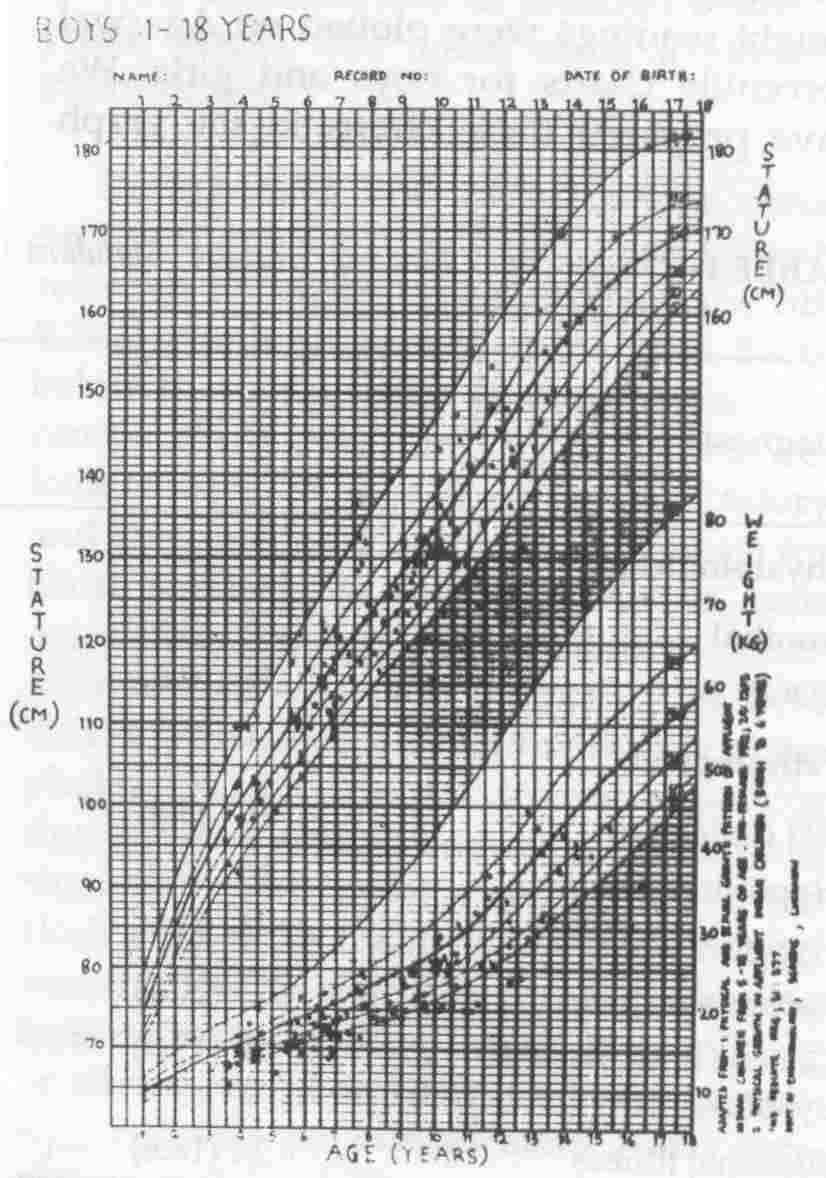
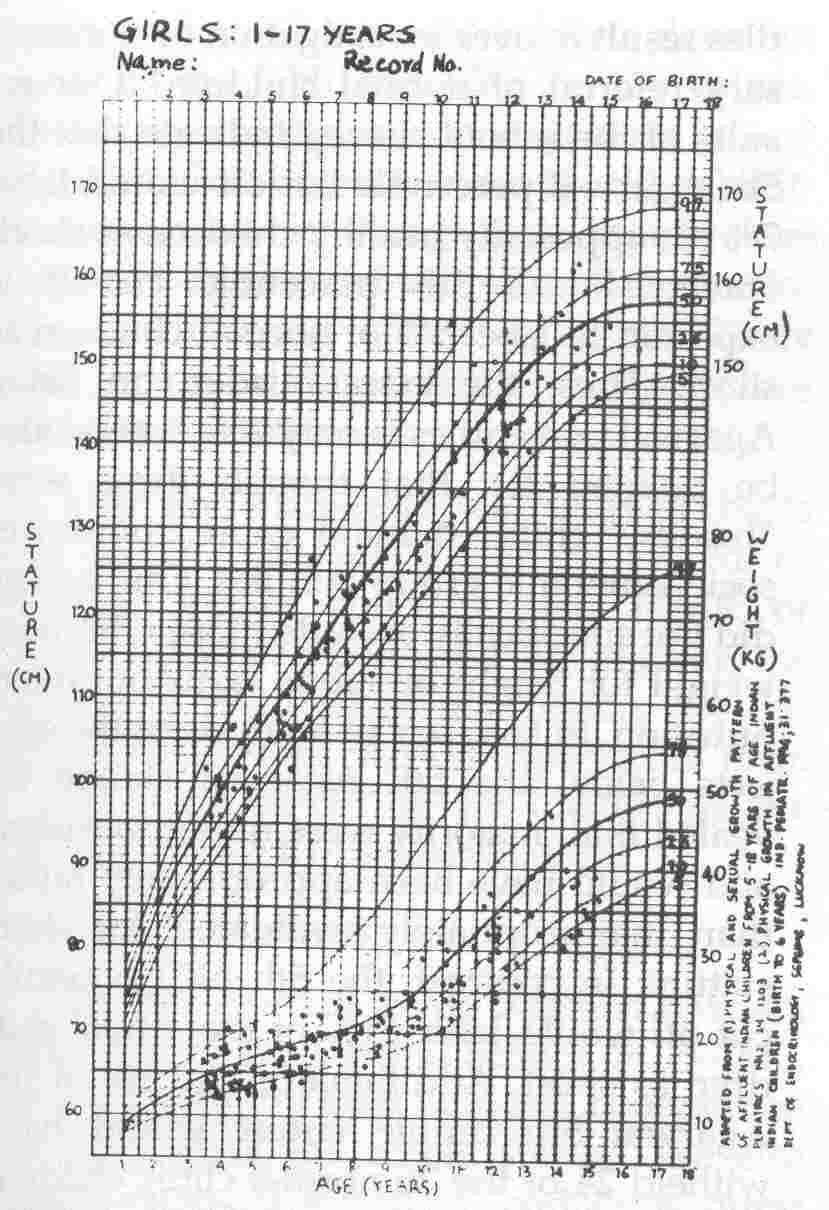
The height distribution of 280 school children is shown in Figures 1 and 2. Twenty of the 280 (7.1%) children were be- low the 5th percentile of the Agarwal charts. These 20 children were re-evaluated by us. Eighteen of them had body weight below 70% of mean weight for age by NCHS standards. They thus had Grade II or worse degree of undernutrition by criteria of Indian Academy of Pediatrics (lAP). The weight of these children was also be- low 90% of the 50th percentile weight for height of NCHS standards. Two children had Grade I undernutrition by lAP criteria. Their weight was also greater than 90% of mean weight for height, i.e.,
they were normally nourished by weight for height criteria. On further work-up, one of the two children was found to have familial short stature. The other family was not traceable as the child was no longer studying in the school.
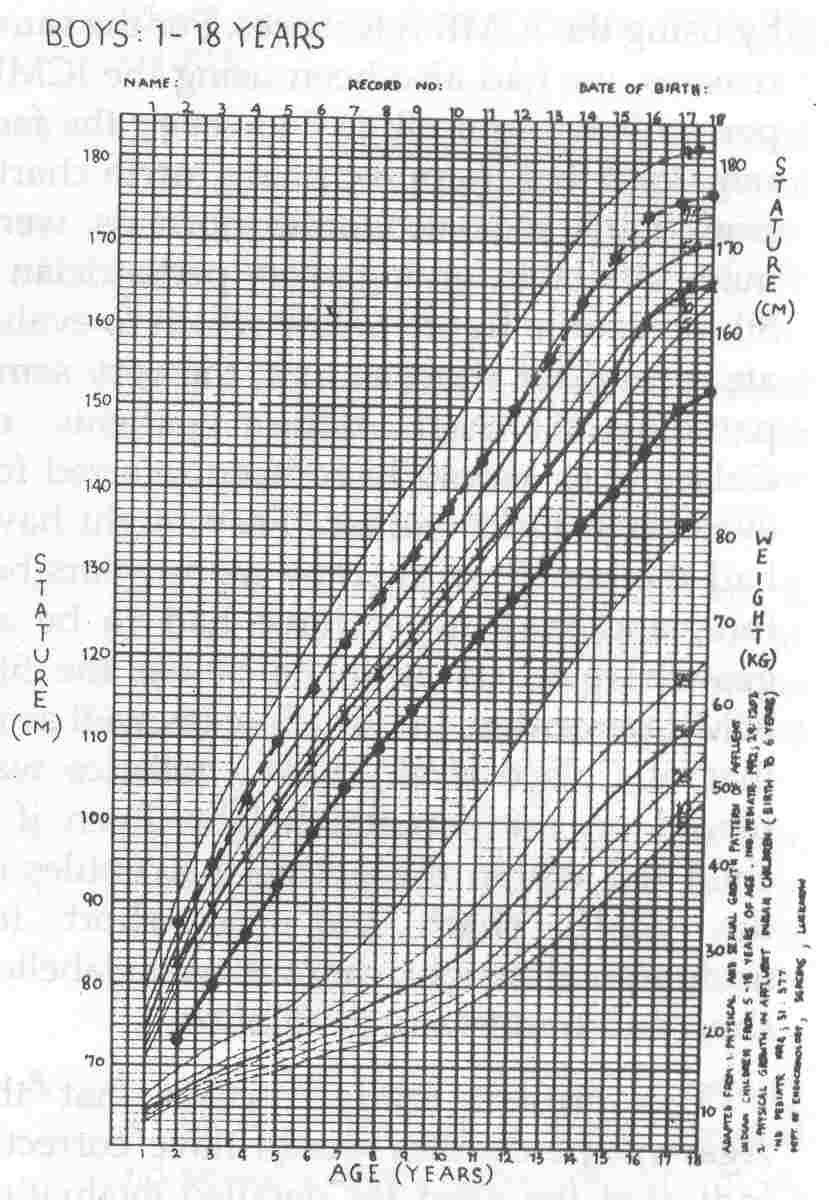
Figure
3 shows the Agarwal boys growth chart, with the 5th and 50th percentiles of American reference charts of the National Center for Health Statistics (NCHS), as well as the 5th percentile of ICMR references, drawn in. It reveals that the 5th and 50th centile American boys fall on 10th and 75th centiles of well nourished Indian boys' references, whereas the 5th ICMR centile falls far below the 5th Agarwal centile.
Discussion
The purpose of recording the height of children is to evaluate whether (a) they fall within the normal range of the reference population, and (b) their interval growth (i.e., growth velocity) is normal. To fulfill
these objectives, it is important to have growth charts depicting the normal percentiles of the reference population. The ICMR had made available such information in a tabular form, these being the result of a multicentre nationwide survey of a large number of children. However, due to the deficiences in these data, it was argued by many that we,' in India, should use NCHS percentiles to evaluate childrens growth.
 |
|
Fig. 1. Height and weight
distribution of
152 normal school boys
plotted
on the Agarwal
growth charts. |
 |
|
Fig. 2. Height and weight distribution of 128 normal school girls plotted on the Agarwal growth charts. |
 |
|
Fig. 3. (-/-/-/-) and 50th (- -
.
- - -
.
-) centiles
of NCHS and 5th (-. - . - . -) centile of
ICMR references plotted on Agarwal growth charts for boys. |
Analysis of Figure 3 reveals that NCHS percentiles do not superimpose over the height percentiles of Indian boys from the high socioeconomic group of India. Recent studies from Delhi and Chandigarh have shown that high socioeconomic group
children from even our tallest ethnic group, the Punjabi, fall short of their American counterparts in the pubertal years(10,11). This underscores the ethnic differences in height between various races of the world. The suitability of the ICMR reference data (despite its drawbacks) in preference to NCHS
data, for evaluating the growth of Indian children, was elegantly demonstrated by Colaco et al.(12) in 1990. They showed that by using NCHS percentiles, they would have unnecessarily investigated a third of their normal population for short stature. Also, the majority of their cases of pathological short stature were below the 5th percentile of ICMR standard in height. Thus, they would not be missed
by using the ICMR references. For the same reasons, we had also been using the ICMR percentiles in our clinic. However, the fact remained that if appropriate growth charts from high socio-economic normals were made available, giving every pediatrician a 5th percentile figure below which to evaluate a child for short stature, the very same pathological short stature patients of Colaco et al. would have been referred for evaluation much earlier. They might have had the benefit of therapy many years before, and may never have had to be so growth retarded as to be below the 5th ICMR percentile. In our clinic (as well as in that of Colaco et aI.), heavy reliance was placed on midparental height. Even if a child fell within the normal percentiles of the ICMR chart, but was short for midparental height, he/she was labelled short and underwent evaluation.
The present study reveals that the Agarwal, percentiles would have correctly
indicated the need for detailed evaluation in 128 of the 129 short children we analyzed. The single patient who was above the 5th Agarwal
percentile did not have a pathological cause of short stature. In contrast the ICMR percentiles would have labeled' 38 (20%) of the short children as normal. This number included a third of our patients of GH and thyroid hormone deficiencies, Turner syndrome and other genetic causes of short stature. In fact, the group of 24 children with growth retardation due to systemic disease (of whom 22 were below the 5th ICMR percentile) form the most compelling argument in favour of the Agarwal percentiles. Had they been evaluated when they were below the 5th or 3rd Agarwal percentile, their primary condition (anemia, renal tubular acidosis,
celiac disease,
etc.)
would have been
corrected many years before.
Would the use of the Agarwal percentiles result in over investigation or unnecessary
referral of' normal children? Our results of the school survey indicate that the 5th Agarwal percentile cut off would label 7% of supposedly healthy children as short. Statistically, a 5th percentile cut-off is expected to label 5% of normal children as short. Thus, the extra burden on using Agarwal percentiles is only 2%. It must also be pointed out that though these were "healthy" children, many came from lower socio-economic group families. Our survey did not specifically exclude those with poor weight for height or subtle signs of under- nutrition. In fact, our re-analysis of the sub- jects below the 5th Agarwal centile
revealed that majority were undernourished and would have been appropriately rather than inappropriately evaluated for short stature. In contrast, the 5th NCHS centile cut off would label 21 % of the school children as short. Additionally, the use of the Agarwal 5th centile cutoff would have witheld 24 of the 26 normal clinic children from referral, whereas the 5th NCHS centile cutoff would have sent on 13 (50%) for referral or investigation.
A few drawbacks of the Agarwal references must be borne in mind by the users of these charts. The semilongitudinal study of subjects from birth to 6 years was carried out by different centres than those carrying out the cross sectional study on 5 to 18 year old subjects, though the planning and data coordination was common to both. The subject numbers were not very large, approximately 500 to 1000 at each data point. The two charts (birth to 6 years and 5 to 18 years), between 5 and 6 years, did not superimpose perfectly. North India is well represented, East and West India next but South India very poorly. However, due to heterogeneity of the Indian population and regional differences in growth, every region must evaluate the applicability of the averaged reference values for itself. The
data on 5 to 18 year old subjects does not
give us the 90th and 95th centile values. Most importantly, however, it must be recognized
that because India is still exhibiting a secular trend in growth, these values
may not represent the best growth that India children can ultimately attain. There will be a need for revised reference values in future decades.
Our study suggests that Agarwal charts are better representative of the growth of normal Indian children than ICMR or NCHS charts. When used for plotting the height of children in our region, the 5th percentile of this chart is expected to form an appropriate cut off for identifying the short child for further evaluation.
Acknowledgement
We are grateful to Ms. Krishna Razdan, principal of the Central School, SGPGIMS, and her staff, for their help and cooperation in conducting the school survey. We also thank Nirmala Verghese, endocrine nurse and diabetes educator, for the same. Anil Kumar's assistance in construction of the growth charts is gratefully acknowledged.
|
1.
Indian Council of Medical Research. Growth and
Physical Development of Indian Infants and Children. Technical Re- port Series No. 18, 1989.
2.
Lindsay R, Feldkamp M, Harris D, Robertson J, Rallison M. Utah growth study: Growth standards and prevalence of growth hormone deficiency.
J
Pediatr 1994; 125: 29-35.
3.
Tripathi AM, Sen S, Agarwal KN, Katiyar GP. Weight and height percentiles for
school children. Indian Pediatr 1974; 11: 811-815.
4.
Katiyar GP, Sehgal D, Khare BB, Agarwal DK, Tripathi AM, Agarwal KN. Physical
growth characteristics of upper socio-economic adolescent boys of Varanasi.
Indian Pediatr 1985; 22: 915-922.
5.
Datta Banik ND. Semilongitudinal growth evaluation of children from birth to 14 years in different socio-economic groups. Indian Pediatr 1982; 19: 353-359.
6.
Kaul. KK, Taskar AD, Madhavan S, Mukerji B, Parekh P, Sawhney K, et al. Growth in height and weight of urban Madhya Pradesh adolescents. Indian Pediatr 1976; 13: 31-39.
7.
Rath B, Ghosh S, Man Mohan, Ramanujacharyulu TKTS. Anthropometric indices of children (5-15 years) of a privileged community. Indian Pediatr 1978; 15: 653-659.
8.
Agarwal DK, Agarwal KN, Upadhyay SK, Mittal R, Prakash R, Rai
S. Physical and sexual growth pattern of affluent Indian children from 5 to 18 years of age. Indian Pediatr 1992; 29: 1203-1268.
9.
Agarwal DK, Agarwal KN. Physical growth of Indian affluent children (Birth
-
6 years). Indian Pediatr 1994; 31: 377-413.
10.
Qamra SR, Mehta S, Deodhar SD. Physical growth in school girls: Relationship to socioeconomk status and dietary intake. Indian Pediatr 1990; 27: 1051-1063.
11. Growth of Affluent Indian Girls during Adolescence. Nutrition Foundation of
India. Scientific Report No. 10, Delhi, 1989, pp 1-71.
12.
Colaco P, Desai M. Identification of a child with short stature. Indian Pediatr 1990; 27: 1159-1164.
|
