|
|
|
Indian Pediatr 2011;48: 791-796 |
 |
Longitudinal Growth of Infants in Qatar:
Comparison with WHO and CDC Growth Standards |
|
Ashraf Soliman, Mohamed Eldabbagh, Hany Khalafallah, Maryam Alali and
Rania K Elalaily
From the Department of Pediatrics, Hamad Medical Center,
HMC, PO Box 3050, Doha, Qatar.
Correspondence to: Ashraf T Soliman, Professor of
Pediatrics and Endocrinology, Department of Pediatrics,
Hamad Medical Center, P O Box 3050, Doha, Qatar.
Email: [email protected]
Received: April 26, 2010;
Initial review: May 21, 2010;
Accepted: January 05, 2011.
Published online: 2011 May 30.
PII: S097475591000346-2
|
|
Abstract
Longitudinal growth data for infants in Qatar were
compared to growth standards published by the CDC and WHO. 300
randomly selected full-term normal infants (150 males, 150 females) in
Qatar were followed-up and weight and length were sequentially
recorded at 2 months, 4 months, 6 months, 12 months and 18 months age.
The mean length for age of girls was higher than those published by
the CDC and WHO at 12 and 18 months of age. Using the CDC standard for
weight for length detected more wasted infants (9.0% and 6.5%)
compared to using WHO standards (6.27% and 6.0%) for males and
females, respectively. When WHO and CDC standards are compared, more
infants were identified as overweight when the former were used. The
WHO standards are preferable because they are based on a leaner
breastfed reference and because overweight is likely to be a greater
problem in Qatar in the future.
Key words: Growth, Growth chart, Infants, Qatar, Standards.
|
|
T
he Centers for Disease Control
(CDC)
released new growth charts for children in
year 2000, replacing the older charts of
1977. These charts represent the multicentric USA children with mixed
methods of infant feeding [2-4]. The new infant growth charts of World
Health Organization (WHO) were released in 2006 and represent breast fed
infants of non-smoking mothers [5-7]. These standards are recommended for
international comparisons and secular trend analysis in developing
countries [8,9].
The evaluation of child growth trajectories and the
interventions designed to improve child health are highly dependent on the
growth charts used. The WHO charts are based on a prescriptive,
prospective, international sample of infants selected to represent optimum
growth. Comparison of the respective means of growth data distribution of
the WHO and CDC shows differences which are particularly important during
infancy. These are likely due to differences in study design and
characteristics of the sample, such as type of feeding. Shorter
measurement intervals in the WHO charts result in a better tool for
monitoring the rapid and changing rate of growth in early infancy [10].
When feasible, a National Growth reference is also
valuable and such charts need to be compared to the accepted standard
provided by CDC and WHO. To obtain these data in Qatar and to test the
suitability of either CDC and/or WHO standards for wide application, a
longitudinal survey was conducted on infants born in Qatar.
Methods
This prospective study included 300 randomly selected
full-term normal infants (150 males and 150 females) with normal
birthweight (>2.5 kg and <4 kg) and gestational age (>38 weeks and <42
weeks) born in Qatar after January 2006. The mothers were non-smokers and
the babies were breastfed and/or receiving breast and bottle (formula)
feeding. Measurements were done sequentially for weight and length at
birth and at every vaccination visit (2 months, 4 months, 6 months, 12
months and 18 months), with evaluation of their feeding practice. Data
were recorded by two Pediatricians and/or two Pediatric nurses during the
vaccination visits. Weight was measured using a Siemens digital weight
balance accurate to 50 g, and length was measured using Siemens
infantometer accurate to 1 mm. The mean and mean +/- 2SD of growth data of
infants were plotted against those published by the WHO and the CDC. In
addition, the differences between these 3 groups, at each time interval
(mean +/- 2SD) were calculated. The difference between the mean (central
tendency) , as well as the mean +/-2SD (dispersion) for weight and length
at the six time intervals was calculated and subtracted from those
published by the CDC and WHO to compare among the 3 groups of data. The
following definitions were used: underweight: (weight-for-age <2SD),
stunting: (length-for age <2SD), wasting: (weight-for-length <2SD),
overweight: weight-for-age >2SD, and obesity: weight-for-length >2SD.
Informed consent was obtained from all parents of the
study infants and the proposal of the study was approved by the Ethics
Research Committee of Hamad Medical Center (HMC), Doha, Qatar.
Results
The number of total observations was 1691 (300/300 at
birth, 291/300 at 2 months, 282/300 at 4 months, 280/ 300 at 6 months,
272/ 300 at 12 months, and 266 /300 at 18 months). In this study, the
percentage of exclusively breast-fed babies was 45.5% at 4 months and 26%
at 6 months. The rate of continued breastfeeding at 12 months was 38.46%.
Linear growth for Qatari infants compared to WHO and
CDC standards for girls and boys are shown in Table I.
Visual inspection of the trajectories for mean length-for-age suggested
that the length for these infants (girls and boys) was closer to those
published by the WHO than to the CDC values. However, the difference
between the means at the 6 point intervals did not differ statistically
among Qatari infants and those published by the WHO or CDC. The mean
length of girls in Qatar was higher than those published by the CDC and
WHO at 12 months (1.17 cm and 0.95 cm, respectively) and at 18 months of
age (1.76 and 1.37 cm, respectively). None of the infants in the study was
stunted.
TABLE I Length for Age for Qatar Infants vs CDC and WHO Standards
| Age (mo) |
0 |
2 |
4 |
6 |
12 |
18 |
Mean of 6 intervals |
SD |
| Q-Girls Mean leanth |
50.14 |
57.02 |
62.49 |
66.37 |
74.96 |
82.06 |
65.51 |
11.68 |
| WHO-Girls Mean length |
49.15 |
57.07 |
62.09 |
65.73 |
74.02 |
80.71 |
64.79 |
11.41 |
| Difference Q-WHO |
0.99 |
–0.04 |
0.40 |
0.64 |
0.95 |
1.36 |
0.71 |
0.49 |
| CDC-Girls Mean length |
49.29 |
56.69 |
61.50 |
65.26 |
73.79 |
80.31 |
64.47 |
11.30 |
| Difference Q-CDC |
0.85 |
0.33 |
0.99 |
1.10 |
1.17 |
1.76 |
1.03 |
0.46 |
| Q-Boy Mean length |
50.49 |
58.51 |
63.86 |
67.78 |
75.29 |
81.70 |
66.27 |
11.29 |
| WHO-boys Mean length |
49.88 |
58.42 |
63.89 |
67.62 |
75.75 |
82.26 |
66.30 |
11.69 |
| Difference Q-WHO |
0.61 |
0.09 |
–0.03 |
0.16 |
–0.46 |
–0.56 |
–0.03 |
0.43 |
| CDC-Boys Mean length |
49.99 |
58.12 |
63.15 |
66.99 |
75.52 |
82.41 |
66.03 |
11.72 |
| Difference Q-CDC |
0.50 |
0.39 |
0.72 |
0.78 |
–0.23 |
–0.71 |
0.24 |
0.59 |
TABLE II Weight for Age for Qatar Infants vs CDC and WHO Standards
| Age (mo) |
0 |
2 |
4 |
6 |
12 |
18 |
Mean of 6 intervals |
SD |
| Q-Girls Mean Wt |
3.15 |
5.04 |
6.41 |
7.71 |
9.40 |
11.57 |
7.21 |
3.03 |
| WHO-Girls Mean Wt |
3.20 |
5.10 |
6.40 |
7.30 |
8.90 |
10.20 |
6.85 |
2.54 |
| Difference Q-WHO |
–0.05 |
–0.06 |
0.01 |
0.41 |
0.50 |
1.37 |
0.36 |
0.55 |
| CDC-Girls Mean Wt |
3.40 |
4.89 |
6.15 |
7.21 |
9.52 |
10.99 |
7.03 |
2.84 |
| Difference Q-CDC |
–0.24 |
0.15 |
0.26 |
0.50 |
–0.12 |
0.58 |
0.19 |
0.33 |
| Q-Boy Mean Wt |
3.18 |
5.33 |
6.77 |
7.85 |
9.91 |
11.85 |
7.48 |
3.12 |
| WHO-boys Mean Wt |
3.30 |
5.60 |
7.00 |
7.90 |
9.60 |
10.90 |
7.38 |
2.74 |
| Difference Q-WHO |
–0.12 |
–0.27 |
–0.23 |
–0.05 |
0.31 |
0.95 |
0.10 |
0.47 |
| CDC-Boys Mean Wt |
3.53 |
5.28 |
6.72 |
7.90 |
10.31 |
11.71 |
7.57 |
3.07 |
| Difference Q-CDC |
–0.35 |
0.05 |
0.06 |
–0.05 |
–0.40 |
0.14 |
–0.09 |
0.23 |
|
Corrected |
Corrected |
|
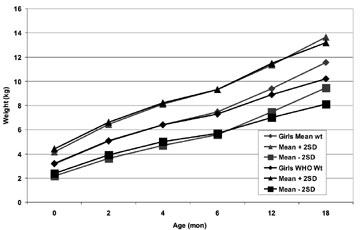
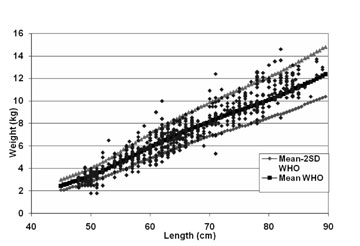
Fig. 1a Weight gain of girls in
Qatar (n=150) vs WHO standards. |
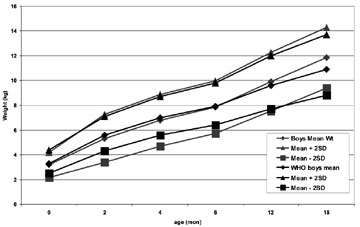
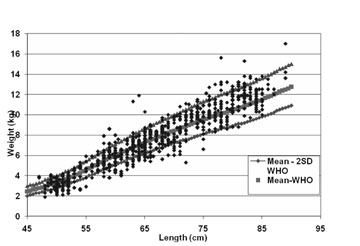
Fig. 1b Weight gain of boys in Qatar
(n=150) vs WHO standards.
|
 |
 |
|
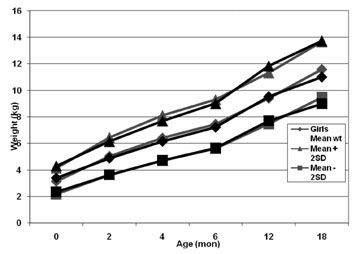
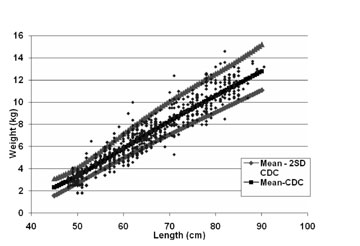
Fig. 1c Weight gain of girls in
Qatar (n=150) vs CDC standards. |
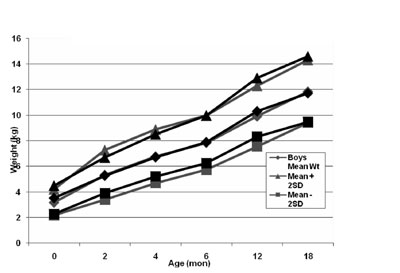
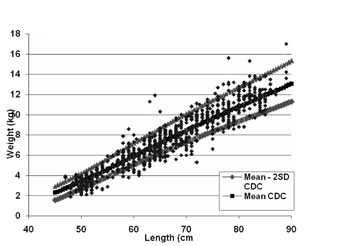
Fig. 1d Weight gain of boys in Qatar
(n=150) vs CDC standards.
|
Weight-for-age growth data of Qatari infants compared
to WHO and CDC standards (Table II and Fig
1c,d) showed that at 12 months of age the mean weight was
higher than WHO standards by 0.7 kg for boys and 0.5 kg for girls. At 18
months, the mean weight was higher than WHO standards by 0.9 kg for boys
and 1.3 kg for girls (Table I). At the age of 12 or 18
months, none of the girls was under-weight compared to the WHO and CDC
standards, and at 18 months, no boy was underweight compared to WHO
standards (Table III).
TABLE III Growth data for Qatar Infants vs CDC and WHO standards
| |
Age |
Qatar Males |
Qatar Males |
Qatar Females |
Qatar Females |
| |
(months) |
vs CDC |
vs WHO |
vs CDC |
vs WHO |
| Underweight |
12 |
2.9% |
1.46% |
0% |
0% |
| |
18 |
2.27% |
0% |
0% |
0% |
| Overweight |
12 |
1.49% |
2.2% |
1.45% |
2.18% |
| |
18 |
1.5% |
3% |
1.5% |
3% |
| Wasting |
2-18 |
9% |
6.27% |
6.5% |
6% |
| Obesity |
2-18 |
4.26 % |
5.2% |
2.6% |
3.19% |
At all time intervals, comparing the weight-for- length
data of the Qatari infants to CDC standards diagnosed more wasted infants
(9.0% and 6.5%) than using WHO standard (6.27% and 6.0%) for males and
females, respectively. Diagnosis of obesity was less when using CDC
standards (4.26 % and 2.6%) versus using the WHO standard (5.1% and 3.19%)
for males and females, respectively (Table III and Fig
2a-d). Observation of longitudinal data of
weight-for-length (Fig 2 c-d) showed
that more obese children (>2SD) are observed on the right hand side of the
curve whereas more wasted infants were diagnosed on the left hand side of
the curve.
 |
 |
|
Fig. 2a Weight for length data for
Qatari girls (n=150) vs WHO standards |
Fig. 2b Weight for length data for
Qatari boys (n=150) vs WHO standards. |
 |
 |
|
Fig. 2c Weight for length data for
Qatari girls (n=150) vs CDC standards. |
Fig. 2d Weight for length data for
Qatari boys (n=150) vs CDC standards. |
Discussion
In this study, visual inspection of the trajectories
for mean length for age suggested that the linear growth (mean values) for
Qatari infants (girls and boys) was closer to those published by the WHO
compared to CDC values. However, the difference between the means at the 6
point-intervals did not differ statistically among these infants, compared
to WHO and CDC standards.
Comparing weight growth data with the WHO
(weight-for-age and weight-for-length) standards has detected more
overweight and obese children at the age of 12 months and 18 months (Table
III). This can be explained by the generally heavier children in
the CDC standards vs WHO standards. The majority of infants in
Qatar, a country with rich economy, were on formula or mixed formula and
breast feeding. Therefore, applying the WHO weight standards can pick up
early more obese and overweight children compared to CDC charts [10]. Data
from a cross sectional study suggested that the risk of obesity in
children at the time of school entry can be reduced by breast feeding and
35% reduction occurs if children are breastfed for 3 to 5 months [11]. In
addition, infants in Qatar have shown greater variability in terms of +/-
SD scores for weight and length. This phenomenon has been observed in
other populations around the world including India and other Asian
countries [12].
It is important to decide which of the two reference
standards is more useful in identifying obesity/overweight. Overweight and
obesity are independent risk factors for increased morbidity and mortality
throughout life and major risk factors for chronic diseases and the
‘metabolic’ syndrome. In addition, obesity in childhood frequently tracks
into adulthood [13,18]. Childhood obesity and overweight is common in
children and adolescents in Qatar [19-21].
In this longitudinal study, the proportion of
underweight infants as well as wasted Qatari infants (Table II,
Fig. 2) decreased gradually between ages of 12 to 18 months.
Our data is supported by a previous cross-sectional survey performed on
infants and preschool children in Qatar, that showed decreased prevalence
of underweight in infants aged 2-3 years compared to those below one year
[22].
Our data showed a small but important differences
between the growth data of Qatari infants and those published by the CDC
and WHO (Tables I, II). Using the WHO standards as a
reference for growth in weight for age and weight for length gives the
advantage of early recognition of overweight and obese infants. This early
recognition of overweight and obesity during infancy and child-hood and
early management of these children are necessary steps to prevent obesity
and its compli-cations in Qatar [17]. Limitation of this study is the
relatively small number of infants (150 boys and 150 girls) followed
longitudinally and the short period of follow up (18 months). Further
follow up for these children can find out more accurately longitudinal
trends of growth in Qatar.
Due to the growing problem of obesity in Qatar, it
appears that the use of WHO standards which are based on a breastfed
infant population as reference for evaluation of growth for infants has
the advantage of detecting more overweight and obese infants early than
the arguably overweight infants in the CDC reference.
Contributors: All authors contributed to concept,
design, data collection, interpretation and drafting of the article.
Funding: None. Competing interests: None
stated.
References
1. Department of Economic and Social Affairs Population
Division. (2009). World Population Prospects, 2008. United Nations.
2. De Onis M, Garza C, Onyango AW, Borghi E. Comparison
of the WHO Child Growth Standards and the CDC 2000 Growth Charts. J Nutr.
2007;137;144-8.
3. Kuczmarski RJ, Ogden CL, Grummer-Strawn LM, Flegal
KM, Guo SS, Wei R, et al. CDC growth charts: United States. Advance
data from vital and health statistics, no. 314. Hyattsville (MD): National
Center for Health Statistics; 2000.
4. Kuczmarski RJ, Ogden CL, Guo SS, Grummer-Strawn LM,
Flegal KM, Mei Z, et al. 2000 CDC growth charts for the United
States: methods and development. Vital Health Stat 11. 2002;246:1–190.
5. Annonymous. 2000 CDC Growth Charts for the United
States: Methods and Development. Series Report 11, No. 246. 201 pp.
6. Babson SG, Benda GI: Growth graphs for the clinical
assessment of infants of varying gestational age. J Pediatr 1976; 89:
814-20.
7. Catrine KF. Anthropometric assessment. In:
Groh-Wargo S, Thompson M, Hovasi-Cox J. Eds. Nutritional Care for High
Risk Newborns, 3rd Edition: Chicago, Precept Press 2000.
8. Yang H, de Onis M. Algorithms for converting
estimates of child malnutrition based on the NCHS reference into estimates
based on the WHO Child Growth Standards. BMC Pediatrics. 2008;8:19.
9. de Onis M, Garza C, Adelheid W. Onyango, Borgh E.
Comparison of the WHO Child Growth Standards and the CDC 2000 Growth
Charts. J Nutr. 2007;137:144-8.
11. von Kries R, Koletzko B, Sauerwald T, von Mutius E,
Barnert D, Grunert V, et al. Breast feeding and obesity: cross
sectional study. BMJ. 1999;319:147-50.
12. Khadilkar V, Khadilkar AV, Chiplonkar SA. Growth
performance of affluent Indian preschool children: A comparison with the
new WHO growth standard. Indian Pediatr. 2010;48:869-72.
13. Curhan GC, Chertow GM, Willlett WC, Spiegelman D,
Colditz GA, Manson JE, et al. Birth weight and adult hypertension
and obesity in women. Circulation. 1996;94:1310-5.
14. World Health Organization: Obesity: Preventing and
Managing the Global Epidemic. World Health Organization Technical Support
Series No. 894. Geneva, Switzerland: World Health Organization, 2000.
15. Dietz WH, Gortmaker SL. Preventing obesity in
children and adolescents. Annual Rev Public Health. 2001; 22:337-53.
16. Martorell R, Kettel Khan L, Hughes ML. Overweight
and obesity in preschool children from developing countries. Int J Obes
Relat Metab Disord.2000;24:959-67.
17. Onis M, Blossner M. Prevalence and trends of
overweight among preschool children in developing countries. Am J Clin
Nutr. 2000;72:1032-9.
18. Williams C. Can childhood obesity be prevented?
In: Primary and Secondary Preventive Nutrition. Bendich A and
Deckelbaum RJ (Eds). Totowa, NJ: Humana Press, 2001. P. 185-204.
19. Kerkadi A, Hassan AS, Eltayeb A, Yousef M. High
prevalence of the risk of overweight and overweight among Qatari children
ages 9 through 11. Nutrition Food Science. 2009;39:36-45.
20. AlKhateeb M, Qotba H, Algemily A, Algawalda A,
Benner A. Obesity in school children in Qatar (2009). Qatar Children
Cultural Center (www.c-c-center.org and WHO publication, 2009, Doha Qatar.
21. Benner A. Prevalence of obesity, overweight, and
underweight in Qatari adolescents. Food Nutr Bull; 2006;27:39-45.
22. Abdulaziz A. Kamal L, Bener A, Ahmed MA, Al-Mulla
K. Growth pattern of Qatari preschool children. Croat Med J 2004;45:461-5.
|
|
|
 |
|
