|
|
|
Indian Pediatr 2011;48:
785-790 |
 |
Childhood T-lineage Acute Lymphoblastic
Leukemia: Management and Outcome at a Tertiary Care Center in
North India |
|
LS Arya, KS Padmanjali, S Sazawal, R Saxena, M Bhargava, KP Kulkarni, M
Adde and I Magrath
From Department of Pediatrics, Division of Pediatric
Oncology, All India Institute of Medical Sciences, New Delhi, India.
Correspondence to: Dr LS Arya, Senior Consultant,
Pediatric Oncology & Hematology, Apollo Center for Advanced Pediatrics,
Indraprastha Apollo Hospital, Sarita Vihar, New Delhi 110 076, India.
Email: [email protected]
Received: December 4, 2009;
Initial review: January 11, 2010;
Accepted: October 19, 2010.
Published online: 2011 March 15.
PII: S097475590900859-1
|
Objective: To assess the clinical features, prognostic factors and
outcome of childhood T-ALL in comparison with B-lineage ALL, treated with
a uniform treatment regimen (MCP 841).
Setting: Pediatric oncology division of a tertiary
care institution in Northern India.
Design: Retrospective analysis of clinical data and
survival outcome.
Participants: 60 children with T-ALL and 139 with
B- lineage ALL, and less than 15 years of age treated over 15 years.
Results: T-ALL was observed in 30%. High risk
features at presentation (age ≥10 years, WBC
>50,000/mm3, mediastinal mass, and CNS leukemia) were
significantly more frequent in T-ALL as compared to B-lineage ALL (P=0.049,
P<0.001, P<0.001 and P=0.02, respectively). Fifty
five of 60 T-ALL patients (91.7%) achieved complete remission after
induction therapy. There were 3 induction and 10 remission deaths while 11
(18.3%) relapsed. The overall survival and event-free survival of
T-lineage ALL (61.5±7.6 and 49.9±7.4, respectively) were similar to that
of B-lineage patients (68.7±4.7 and 47.1±5.1, respectively). National
Cancer Institute risk groups emerged as significant prognostic factor for
event free survival only in B-lineage patients.
Conclusions: Even though high risk features were
significantly more frequent in T-ALL, survival outcome was similar to that
of B-lineage patients. None of the routinely described prognostic
parameters significantly impacted survival.
Key words: Acute lymphoblastic leukemia,
B-lineage, Child, Prognosis, Relapse, Survival, Outcome, T-lineage.
|
|
T-lineage acute lymphoblastic
leukemia (T-ALL) is described to constitute about 15%
of childhood ALL [1-4]. Authors from
developing countries report it more frequently than in developed
countries, possibly due to yet unidentified genetic and environmental
factors [5-12].
Several studies conducted over the past two decades,
from the developed countries have shown that the prognosis of T-ALL has
improved significantly in the era of risk-adapted therapy with early
intensification and timely and adequate CNS prophylaxis [13-17]. Majority
of the study groups have stratified patients with T-ALL into a separate
risk group for therapy and/or prognostication. Although this provides an
excellent opportunity for evaluating unique contributions of prognostic
factors within each immuno-phenotype group, direct comparison of outcome
between T and B lineage becomes difficult because of the different
treatment regimen used. Furthermore, there is paucity of data addressing
clinical features, prognostic parameters and outcome of T-ALL in
developing countries like India, where this ALL subtype is more frequently
observed than in the developed nations [18,19].
In this communication, we attempt to determine the
frequency, clinical features and outcome of patients with T-ALL in
comparison with B lineage ALL, treated on a uniform therapeutic regimen
and to identify poor prognostic factors in T-ALL patients.
Methods
Two hundred and fifty four children aged <15 years with
newly diagnosed ALL received therapy in the Pediatric Oncology Division of
the Department of Pediatrics, All India Institute of Medical Sciences, New
Delhi from June 1992 to June 2002. Diagnosis of ALL was confirmed by bone
marrow examination at presentation. Cytochemistry using myeloperoxidase
and sudan black was performed on all bone marrow aspirate/touch smear
specimens.
For the purpose of evaluation, presence of one or more
lymph node more than 1cm diameter was considered as lymphadenopathy;
hepatomegaly was defined as liver palpable at least 2 cm below the costal
margin and splenomegaly as palpable spleen. Presence of unequivocal blasts
in the CSF at the time of presentation, irrespective of CSF cell count was
considered as CNS leukemia.
Pre-treatment bone marrow or peripheral blood sample
(of patients with WBC count >30,000/mm 3
with >75% blasts) were separated on Ficoll-Hypaque gradients and
immunophenotyping was performed by using a panel of monoclonal antibodies
(when sufficient sample was available), which included
CD2,3,4,5,7,8,10,19,20,33,34, HLA-DR and surface immunoglobulin (SIg) by
indirect immunoflourescence method. In cases where sample was
insufficient, a minimum panel of monoclonal antibodies, which included
CD3,5,7,10,19 and 33, were used.
T-ALL was defined as >20% blasts expressing at least 2
of the antigens CD2,3,5 and 7 or expressing only CD7 in the absence of B
lineage and myeloid antigens; B-precursor was defined as CD19 positive,
CD10 positive or negative and CD7 and 5 negative. T-ALL maturational
stages were defined as pro-thymocyte leukemia (pro-TL) - CD7 +,
CD2-, 3-
and 5-;
Immature TL- CD7+, (CD2 or 5)+
and CD3-; Mature TL – CD3+,
and (CD7, 2,5)+ [20].
Treatment: All patients were uniformly treated on
MCP 841 protocol. CNS prophylaxis included intrathecal methotrexate given
at weekly intervals for first 3 months and 1800cGy cranial irradiation for
children more than 3 years. In lieu of irradiation, CNS prophylaxis in
children less than 3 years of age consisted of triple intrathecal therapy
with metho-trexate, cytosine arabinoside and hydrocortisone, weekly during
first 3 months of therapy and twice at monthly interval, during each
maintenance cycle.
Evaluation of response: Bone marrow examination was
performed at the end of induction therapy. Com-plete remission (CR) was
defined as <5% lymphoblasts in a normocellular bone marrow with normal
blood counts in the absence of clinical evidence of disease. Patients with
blast percentage >5% at the end of induction were considered as
non-responders. For purpose of evaluation, relapses were divided into
on-therapy relapses occurring during the course of cancer chemotherapy and
posttherapy rela-pses, occurring after completion of chemotherapy.
Statistical analysis: Data were retreived from
hospital records and analyzed. The overall survival (OS), event free
survival (EFS) and disease-free-survival (DFS) rates were calculated by
the Kaplan-Meier method. OS was calculated from the date of commencement
of treatment to the date of last follow-up. EFS was calculated from the
date of commencement of treatment to the date of last follow-up or an
event (induction death, induction failure, remission death or relapse).
DFS was calculated for CR patients from the date of attainment of complete
remission to the date of relapse or the date the patient was last known to
be in complete remission. For the analysis of DFS, patients dying from
causes other than relapse were censored at the time of death. Prognostic
factors were analyzed with respect to their influence on outcome using the
log-rank statistics and trend test for univariate analysis for both T and
B lineage patients.
Results
Immunophenotyping was performed in 199 (78.3%) of the
254 patients accrued in the study. Sixty of these had T lineage ALL. Their
male to female ratio was 6.5:1 while mean age was 7.6 years (range 1-14
years) and the mean WBC count was 1,27,892/mm 3.
139 patients (70%) had B–lineage ALL. Male to fe-male ratio in B–lineage
ALL was 3.2:1; mean age of children with B–lineage ALL was 5.84 years
(range: 1-14 years) and mean WBC count was 51,902 /mm3.
When the clinical and laboratory parameters at
presentation of patients with T-ALL were compared with those with
B–lineage ALL, poor prognostic features like age >10 years, WBC count
>50,000/mm 3, mediastinal
lymphadenopathy and CNS leukemia were significantly more frequent in
patients with T-ALL (Table I). When patients were stratified
in to risk groups based on NCI Consensus Group’s age and WBC
criteria [24], 68.3% of patients with T-lineage belong to the high risk
group as compared to 36.7% of those with B-lineage ALL (P<0.005).
Fifty five of 60 (91.7%) T-ALL patients attained CR after induction
therapy. One patient was non responder while 3 and 10 patients died in
induction and remission, respectively (as opposed to 19 and 16 induction
and remission deaths, respectively in B-lineage patients).
Infection and bleeding were the predominant causes of death in these
patients (38.4%, 30.7%, respectively). Two patients were lost to follow
up. Eleven of these 55 patients relapsed (20%), of which 5 (9.1%) relapsed
on therapy and 6 (10.9%) relapsed after completion of the treatment. There
were 8 (14.5%) bone marrow relapses, one each of CNS, bone marrow and CNS
and extramedullary relapse.
TABLE I Clinical Features of T-ALL and B-Lineage ALL
|
Clinical feature |
T-ALL |
B-lineage |
| |
(n=60)(%) |
(n=139)(%) |
|
Age <10 yrs‡ |
46 (77) |
123 (88.5) |
|
Male sex |
52 (87) |
106 (76) |
|
Lymphadenopathy |
54 (90) |
117(84) |
|
Mediastinal# |
27 (45) |
10 (7) |
|
Hepatosplenomegaly |
55 (91.6) |
132 (95) |
|
WBC <50,000/mm# |
34 (57) |
102 (73) |
|
CNS leukemia‡ |
9 (15) |
5 (3.5) |
|
Low Risk* |
19 (31.7) |
88 (63.3) |
|
WBC: White blood cells; CNS: Central nervous system; *National
Cancer Institute risk group; #P<0.001; ‡P<0.05: $P<0.005. |
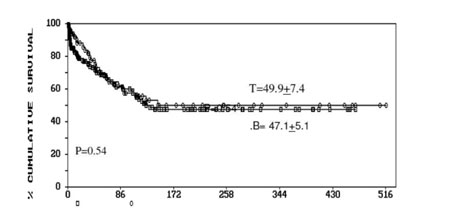
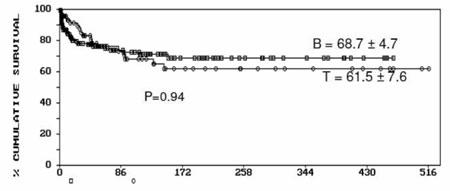
The OS, EFS and DFS were 61.5±7.6, 49.9±7.4 and
71.3±7.9, respectively. There was no significant difference in OS and EFS
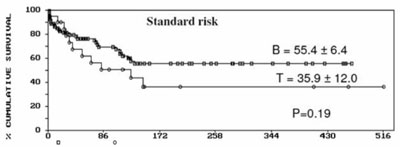
in T and B lineage ALL (Fig. 1). The T lineage and B
lineage patients were stratified into standard and high risk groups based
on National Cancer Institute (NCI), USA consensus group [15]. EFS was
35.9±12.0 for standard risk T-ALL and 55.4±6.4 for standard risk group
with B lineage ALL. Although the trend of better survival in B lineage
patients was in the expected direction the difference was not
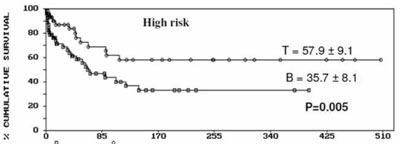
statistically significant (P=0.19) (Fig. 2). On the
contrary, EFS of T lineage patients in the high risk group was 57.9±8.1 as
against 35.7± 8.1 for high risk patients with B lineage (P=0.005) (Fig.
2). The standard risk patients in B lineage group had a
significantly favorable outcome than the high risk patients with B lineage
ALL (P=0.02). In contrast, T lineage patients in high risk group
had a better EFS than standard risk group patients, however the difference
was not statistically significant (P=0.19).
|
 |
|
(a) |
 |
|
(b) |
|
Fig. 1 Event Free Survival (a) and overall
survival (b) in T-ALL and B lineage ALL. |
|
 |
|
(a) |
|
 |
|
(b) |
|
Fig. 2 Event Free Survival in the study
population according to NCI risk groups. |
We also stratified patients into different groups based
on maturational stage of T lymphocyte. Majority of patients were in mature
T cell group (53.3%) while a small subset belonged to pro-thymocyte group
(8.3%). There was no significant difference in presenting clinical
features and laboratory parameters with in the maturational stages of T
cell (Table II). Patients in the immature T cell group had a
better EFS (61.4±10.8) compared to mature stage (50.2±9.6) even though the
difference was not statistically significant (P=0.46). All 5
patients in Pro T-ALL group died during first few months of therapy, cause
of death being toxicity related events in 4 of 5 patients (80%).
TABLE II Comparison of Clinical Characteristics and Outcome in T-cell Maturational Stages
|
Characteristic |
Pro T |
Immature T |
Mature T |
P |
| |
(n=5) |
(n=23) |
(n=32) |
value |
|
Age |
|
<10 years |
3 |
17 |
23 |
|
|
≥10 years |
2 |
6 |
9 |
0.82 |
|
WBC ( ×103/mm3) |
|
<50 |
2 |
8 |
15 |
0.92 |
|
≥50 - ≤100 |
1 |
4 |
7 |
0.67 |
|
>100 |
2 |
11 |
10 |
0.46 |
|
Male sex |
5 |
20 |
27 |
|
|
Mediastinal |
1 |
14 |
11 |
0.08 |
| lymphadenopathy |
|
CNS leukemia |
0 |
4 |
5 |
0.59 |
|
Relapse |
1 |
4 |
7 |
0.89 |
|
EFS |
0.00 |
61.4±10.8 |
50.2±9.6 |
0.46 |
|
EFS: Event free survival; WBC: White blood cell count. |
On univariate analysis for EFS, none of the
traditionally described prognostic factors like age, sex, WBC count,
organomegaly, CNS leukemia and NCI consensus groups were significant for
EFS in the T-ALL patients. In the B-lineage group, NCI consensus risk
grouping was the only factor significant for prognosis (P<0.05).
Discussion
According to this study, T-ALL was at least more than
twice as frequent in our patient population (30%) as that in Western
countries [1-4,13-17]. Frequency of T-ALL in our study (30%) was similar
to studies from Tata Memorial Hospital (TMH) (21% in patients <21 years)
and Cancer Institute, Chennai (46% in children <15 years) [9,18]. The high
occurrence of T-ALL in our patients is probably related to the
socio-demographic characteristics of the patient population. The majority
of our patients belonged to the low socioeconomic group (58.3%). Studies
have shown that T-ALL is more commonly associated with low socioeconomic
status. This finding may be related to increased frequency of viral
infections [11,21,22]. The male preponderance in our patients was probably
another important contributory factor for increased occurrence of T ALL in
our patients. Akin to our observations, other studies have also
demonstrated the differences in clinical and laboratory parameters between
T and B-lineage ALL patients [3,4]. Even though males were more frequent
in the T-ALL group as compared to B lineage ALL group, the difference was
not statistically significant due to high degree of male preponderance
(male: female-3.4: 1) in the study population.
Contemporary studies from major centers in the world
have stratified T-ALL into a different risk group for treatment and most
investigators report an overall inferior outcome in it compared to
B-lineage ALL [13-17]. In a study by Children Cancer Group (CCG) where
patients were stratified into risk groups based on age, WBC criteria
irrespective of the immunophenotype, T-lineage patients treated with
CCG-1800 protocol had a slightly better outcome than B-lineage patients (5
year EFS of 75.2 vs 70.9, respectively) [20]. The EFS of T lineage
patients (49.9±7.4) was much similar to that of B lineage patients
(47.5±5.1) in our study group, even though inferior to that of T-lineage
patients from Western studies. In another study from TMH, Mumbai, in which
all patients were uniformly treated with the MCP 841 protocol,
immunophenotype was not a significant predictor of EFS [19]. The inferior
survival outcome as compared to western series is probably due to high
risk features at presentation and social, demo-graphic, financial,
infrastructual and epidemio-logical constraints [21-23].
In our study the NCI high risk patients in the T-ALL
had a significantly better EFS than the high risk patients in the B
lineage ALL. These findings were in consonance with the observations by
CCG group, where a subset of patients with high risk leukemia and
T-lineage immunophenotype was associated with a significantly more
favorable outcome than B lineage immunophenotype, but with T subtype
getting more intensive therapy.
Since all our patients were treated uniformly with a
single treatment regimen, it would be tempting to conclude that T
immunophenotype did not have an adverse impact on prognosis. However, the
markedly inferior outcome in the high risk B lineage ALL and standard-risk
T-ALL group contributed to the similar outcomes seen in the T and B
lineage ALL. Our data showed that none of the traditionally
described clinical and laboratory prognostic factors were predictive of
outcome in T-ALL, akin to the observations of Pullen, et al. [24].
In contrast, other investigators have reported gender and WBC count as
significant predictors of outcome in T-ALL [13, 25]. In our study, the
lack of significance of any risk factor may be explained by the small
sample size; a high toxicity-related death rate, especially in the
B-lineage ALL group; and the presence of extensive disease at presentation
in the majority of our patients. These could also plausibly indicate the
limitations and consequences of use of a single therapy regimen in all
risk groups instead of contemporary risk-adapted therapy.
Different studies have used different criteria for
maturational stage stratification. The criteria used to define
maturational stages of T cell ALL in our study were similar to that by
Uckun, et al. [26]. Majority of their patients belong to immature
T-ALL group (248/407, 60.9%) unlike our study, where mature T-ALL was the
commonest (53.3%). The mature T-ALL patients had the best outcome
(6 year EFS 77.7%) unlike our patients where immature T-ALL had the better
outcome (61.4±10.8). Small numbers plausibly preclude identification of
specific prognostic factors in these subgroups.
In conclusion, T-ALL occurred more frequently in our
population and was clearly associated with high-risk features at
presentation. The dismal prognosis of high risk B-lineage and standard
risk T-lineage ALL patients indicates the need to select this group for
treatment modification and indicate the need of reappraisal of out
protocols.
Contributors: LSA: Conceptualized the idea, guiding
clinician, edited and approved the final manuscript draft. He will act as
guarantor. KSP: Data collection, manuscript writing. SS: Data collection,
contributed to methodology. RS: Data collection, contributed to
methodology. MB: Manuscript review, data collection and methodology. KPK:
reviewed the literature and drafted the manuscript. AM: Clinical advisor,
manuscript review. MI: Clinical advisor and manuscript review.
Funding: None.
Competing interests: None stated.
|
What is Already Known?
• T-lineage ALL is associated with high-risk
features and adverse prognosis
What This Study Adds?
• Using traditional risk group criteria to
prognosticate pediatric leukemia patients may not be appropriate,
especially in Indian children. T-cell ALL has survival outcome
equivalent to B-lineage ALL in the present study.
|
References
1. Pui CH, Evans WE. Treatment of acute lymphoblastic
leukemia. N Engl J Med. 2006;354:166-78.
2. Vrooman LM, Silverman LB. Childhood acute
lymphoblastic leukemia: update on prognostic factors. Curr Opin Pediatr.
2009;21:1-8.
3. Uckun FM, Sensel MG, Sun L, Steinherz PG, Trigg ME,
Heerema NA, et al. Biology and treatment of childhood T- lineage
acute lyphoblastic leukemia. Blood. 1998;91:735-46.
4. Heerema NA, Sather HN, Sensel MG, Kraft P, Nachman
JB, Steinherz G, et al. Frequency and clinical significance of
cytogenetic abnormality in pediatric T-Lineage acute lyphoblastic
leukemia: A Report from the children’s Cancer Group. J Clin Oncol.
1998;16:1270-8.
5. Shanta V, Mitreyan V, Sagar TG, Gajalakshmi CK,
Rajalekshmy KR. Prognostic variables and survival in pediatric acute
lyphoblastic leukemias; cancer institute experience. Pediatr Hematol Oncol.
1996;13:205-16.
6. Rajalekshmy KR, Abitha AR, Premila R, Gnanasagar T,
Maitreyan V, Shanta V. Immunophenotyping of acute lyphoblastic leukemia in
Madras, India. Leuk Res. 1994;18:183-90.
7. Bhargava M, Kumar R, Karak A, Kochupillai V, Arya
LS, Mohanakumar T. lmmunological subtypes of acute lymphoblastic leukemia
in North India. Leuk Res. 1988;12:673-8.
8. Magrath IT, Shanta V, Advani S, Adde M, Arya LS,
Banavali S, et al. Treatment of acute lymphoblastic leukemia in
countries with limited resources; lessons from a use of single protocol in
India over a twenty years period. Eur J Cancer. 2005;41:1570-83.
9. Rajalekshmy KR, Abitha AR, Pramila R, Gnanasagar T,
Shanta V. Immunophenotypic analysis of T-cell acute lyphoblastic leukemia
in Madras, India. Leuk Res. 1997;21:119-24.
10. Kamel AM, Assem MM, Jaffer ES, Magrath MI, Dneen A,
Hindway DS. Immunological phenotypic pattern of acute lymphoblastic
leukemia in Egypt. Leuk. 1989;13:519-25.
11. Ramot B, Magrath IT. The environment is a major
determinant of the immunological subtype of lymphoma and acute
lymphoblastic leukemia in children. Br J Haemat. 1982;50:183.
12. Naeem S, Hayee A. Acute lymphoblastic leukemia- a
study of immunophenotypes. J Pak Med Ass. 1992;42:83-86.
13. Salzer WL, Devidas M, Carroll WL, Winick N, PullenJ,
Hunger SP, et al. Long-term results of the Pediatric Oncology Group
studies for childhood acute lymphoblastic leukemia 1984–2001: a report
from the Children’s Oncology Group. Leukemia. 2009 Dec 17 [Epub ahead of
print].
14. Gaynon PS, Angiolillo AL, Carroll WL, Nachman JB,
Trigg ME, Sather HN, et al. Long-term results of the Children’s
Cancer Group studies for Childhood acute lymphoblastic leukemia 1983–2002:
A Children’s Oncology Group Report. Leukemia. 2009 Dec 17 [Epub ahead of
print].
15. Pui CH, Pei D, Sandlund JT, Ribeiro RC, Rubnitz JE,
Raimondi SC, et al. Long-term results of St Jude Total Therapy
Studies 11, 12, 13A, 13B, and 14 for childhood acute lymphoblastic
leukemia. Leukemia. 2009 Dec 17 [Epub ahead of print].
16. Kamps WA, van der Pal-de Bruin KM, Veerman AJ,
Fiocco M, Bierings M, Pieters R. Long-term results of Dutch Childhood
Oncology Group studies for children with acute lymphoblastic leukemia from
1984 to 2004. Leukemia. 2009 Dec 17 [Epub ahead of print].
17. Goldberg JM, Silverman LB, Lewy DE, Dalton VK,
Gelber RD, Lehman L et al. Childhood T-cell acute lymphoblastic
leukemia: The Dana-Farber Cancer Institute Acute Lymphoblastic Leukemia
Consortium experience. J Clin Oncol. 2003;21:3618-22.
18. Advani SH, Kamat DM, Rao DN, Gopal R, Nair CN,
Saikia T. T cell acute lymphoblastic leukemia: a report of 60 patients
from India. Oncology. 1985;42: 282-6.
19. Advani SH, Pai S, Venzon D, Adde M, Kurkure PK,
Nair CN, et al. Acute lymphoblastic leukemia in India: An analysis
of prognostic factors using a single treatment regimen. Ann Oncol.
1999;10:167-99.
20. Uckum FM, Reaman G, Steinherz PG, Arthur DC, Sather
H, Trigg M, et al. Improved clinical outcome for children with
T-Lineage acute lyphoblastic leukemia after contemporary chemotherapy: A
Children’s Cancer Group study. Leukemia Lymphoma. 1996;24:57-70.
21. Paes CA, Viana MB, Freire RV, Martins-Filho OA,
Taboada DC, Rocha VG. Direct association of socio-economic status with
T-cell acute lymphoblastic leukemia in children. Leuk Res. 2003;27:789-94.
22. Viana MB, Fernandes RAF, Oliveria BM, Murao M, de
Andrade Paes C, Duarte AA, et al. Nutritional and socio-economic
status in the prognosis of childhood acute lymphoblastic leukemia.
Haematologica. 2001;86:113-20.
23. Kulkarni KP, Marwaha RK, Trehan A, Bansal D.
Survival outcome in childhood ALL: experience from a tertiary care centre
in North India. Pediatr Blood Cancer. 2009;53:168-73.
24. Pullen DJ, Shuster JJ, Link M, Borowitz M, Amlyon
M, Carroll AJ, et al. Significance of commonly used prognostic
factors differs for children with T cell acute lymphoblastic leukemia
(ALL), as compared to those with B-precursor ALL. A Pediatric Oncology
Group (POG) study. Leukemia. 1999;13:1696-1707.
25. Dakka N, Bellaoui H, Bouzid N, Khattab M, Bakri Y,
Benjouad A. CD10 and CD34 expression in childhood acute lymphoblastic
leukemia in Morocco: clinical relevance and outcome. Pediatr Hematol Oncol.
2009;26:216-31.
26. Uckun FM, Gaynon PS, Sensel MG, Nachman J, Trigg
ME, Steinherz PG, et al. Clinical features and treatment outcome of
childhood T-Lineage acute lymphoblastic leukemia according to the apparent
maturational stage of T- Lineage leukemia blasts: A Children’s Cancer
Group Study. J Clin Oncol. 1997;15: 2214-21.
|
|
|
 |
|
