|
|
|
Indian Pediatr 2010;47: 851-856 |
 |
Growth of Very Low Birth-Weight Indian Infants
During Hospital Stay |
|
Satish Saluja, Manoj Modi, Avneet Kaur, Anil Batra, Arun Soni, Pankaj Garg
and Neelam Kler
From the Department of Neonatology, Centre for Child
Health, Sir Ganga Ram Hospital, New Delhi, India.
Correspondence to: Satish Saluja, Department of
Neonatology, Sir Ganga Ram Hospital, New Delhi 110 060, India.
Email: [email protected]
Received: July 26, 2009;
Initial review: August 13, 2009;
Accepted: November 23, 2009.
Published online: 2010 March 15.
PII: S097475590900516-1
|
|
Abstract
Objectives: To evaluate the growth pattern of
Very Low Birth Weight (VLBW) infants (birthweight <1500g) during
hospital stay and to compare the growth of Small for gestational age (SGA)
and Appropriate for gestational age (AGA) infants.
Study design: Prospective observational
study.
Setting. Level III Neonatal Intensive Care
Unit (NICU) in Northern India.
Participants: A cohort of 97 VLBW infants,
admitted to NICU at Sir Ganga Ram Hospital, from 1 January, 2007 to 31
July, 2008.
Intervention/Measurement: Weight, length and head
circumference (HC) were serially measured from birth till discharge and
respective Z scores were calculated as per data from Fenton’s
references. Growth was also assessed by superimposing these trends on
Ehrenkranz’s postnatal growth charts.
Results: The mean Z scores for
weight, length and HC at birth were –1.17, –1.09 and –0.54,
respectively. These decreased to –2.16, –2.24 and –1.35, respectively by
discharge. Both SGA and AGA infants exhibited a decrease of
approximately 1 Z score in all parameters. On postnatal charts,
growth of infants remained at or above respective reference lines,
except in those below 1000g at birth. Average daily weight gain after
regaining birth weight was 15.18 ± 1.7 g/kg/d, whereas the increase in
HC and length were 0.48 ± 0.2 cm/week and 0.60 ± 0.4 cm/week,
respectively. These increments when compared to the intrauterine growth
rates, indicated discrepant growth trends.
Conclusions: VLBW infants suffered
significant growth lag during NICU stay and exhibited disproportionately
slow growth of HC and length.
Key words: VLBW infants, Growth, Z score, Weight, Length, Head
circumference, India.
|
|
P
ostnatal growth of Very Low Birth
Weight (VLBW) infants (birthweight <1500g) remains a subject of concern
for neonatologists. Infants born VLBW are at increased risk for impaired
growth, due to certain factors during intrauterine life, exposure to
hostile ex-utero environment and poorly understood nutritional needs.
Despite improvement in care of VLBW infants, they continue to suffer
growth lag during neonatal period and early infancy. Most of these infants
experience catch up growth much later, by 8-20 years(1). Poor postnatal
growth has been associated with subnormal long-term physical growth and
neurodevelopment outcomes (2-4). The postnatal growth pattern in VLBW
infants during hospital stay and beyond has not been reported from this
subcontinent.
We conducted this study to document and describe the
growth patterns of VLBW infants during NICU stay and to analyze the
difference, if any, between those born appropriate or small for
gestational age (AGA or SGA).
Methods
VLBW infants admitted to neonatal intensive care unit
at Sir Ganga Ram Hospital, New Delhi from 1st January 2007 to 31st July
2008 were followed prospectively from birth till discharge. Infants who
stayed in the hospital for less than 10 days or those admitted after 24
hours of birth or with major congenital malformations were excluded. This
study was approved by the Institutional Review Board and hospital Ethics
Committee. Parental consent was obtained at the time of enrolment.
Gestational age was recorded as per obstetrical estimates based on first
trimester ultrasonography or if not available, by date of last menstrual
period.
Weight was taken by an electronic weighing scale, which
was calibrated at regular intervals. It was recorded every day till birth
weight was regained and then every week till discharge. Length and head
circumference (HC) were recorded using standard techniques between 12 to
24 hrs initially and then every week till discharge. The minimum range for
recording weight was 10 gms and, 1 mm for length and HC. All the
measurements were taken twice and average of these observations was
recorded. However, if there was a large discrepancy between two readings
(defined as more than 5%), repeat measurements were taken. The maximum
weight loss was calculated from the difference of minimum weight and birth
weight. The age at maximum weight loss and time taken to regain
birthweight were also calculated. For calculation of daily weight gain,
period from regaining birthweight to discharge was used as denominator.
Fluid and nutrition policy: VLBW infants were
started on 80 mL/kg/d (60-120 mL/kg/d) of fluid on first day of life. The
total fluid intake was regulated to allow physiological weight loss.
Enteral feeds were initiated as soon as possible, preferably on first day
of life, if haemodynamically stable. Increments of 20-30 mL/kg/d were made
as tolerated. Human milk was preferred and once infants reached an enteral
intake of 100mL/kg/d, human milk fortifier (Lactodex HMF, manufactured by
Raptakos, Brett & Co, with 6.5 Calories, 0.2 g protein and 0.1 g fat in
each sachet) were added to increase the calories to 80 kcal/100ml with an
additional protein intake of 0.6g/kg/d. However if human milk was not
available, a low birth weight infant formula (Dexolac special care,
manufactured by Wockhardt Ltd, Mumbai, India) was used with a calorie
content of 80 kcal/100ml and 2.67g of protein in 100ml of reconstituted
formula. Infants who were not expected to be on total enteral feeds within
first 5 days of life, were started on parenteral nutrition (PN) on first
day with protein and lipid intake of 1g/kg/d. Daily increments of 1g/kg/d
were made with a maximum intake of 3 g/kg/d, targeting a parenteral
calorie intake of 90 kcal/kg/d.
Statistical methods: The Z scores for
weight, length and HC for each gestation were calculated based on means
and standard deviations from Fenton’s reference data(5,6). Infants were
classified SGA if the birth weight was below 10th centile as per Fenton’s
growth charts. Mean Z scores for weight, length and HC of the whole
cohort, were compared at birth and discharge. Similar comparisons were
made between SGA and AGA infants. For further analysis, the cohort was
classified into three gestational age groups; less than 30 weeks, 30-34
weeks and more than 34 weeks. The infants were also categorized by 100g
birthweight intervals and their weight, length and HC during the hospital
stay were plotted on the Ehrenkranz growth curves for comparison(7). SPSS
version 13.0 was used for statistical analysis. Continuous variables were
compared using student t test or Mann Whitney U test as per the
distribution of data. Paired observations were compared by paired t test
or equivalent non parametric test, as applicable.
Results
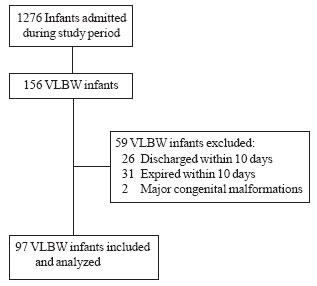
Enrolment and characteristics of the study population
including prenatal factors and neonatal morbidities are depicted in
Fig. 1 and Table I, respectively. Table II
depicts the average increase in weight, length and HC for different
gestational age categories.
 |
|
Fig. 1 Study flow chart. |
TABLE I


Characteristics of VLBW infants (N = 97)
|
Maternal factors |
|
|
gestational hypertension, n (%) |
52 (53.6) |
|
gestational diabetes / IDM, n (%) |
3 ( 3.1) |
| Birth weight, mean (SD) g |
1257 (190.7) |
| Gestational age, mean (SD) wk |
31.7 (2.35) |
| Male, n(%) |
57 (58.8) |
| Infants < 30 weeks (n=25): AGA, n(%) |
25 (100) |
|
Infants 30-34 weeks (n=56) |
|
|
AGA, n (%) |
25 (44.6) |
|
SGA, n (%) |
31 (55.4) |
| Infants >34 weeks (n=16); SGA, n (%) |
16 (100) |
| Respiratory distress, n (%) |
58 (59.7) |
| Culture positive sepsis, n (%) |
28 (28.9) |
| Weight at discharge, mean (SD) g |
1695 (158.9) |
| Gestation at discharge, mean (SD) wk |
36.35 (2.45) |
| Hospital stay, median (range) d |
27 (11-105) |
TABLE II


Growth Pattern in VLBW Infants During Hospital Stay
| |
< 30 wk |
30 – 34 wk |
> 34 wk |
Total |
| |
(all AGA) |
AGA |
SGA |
(all SGA) |
AGA |
SGA |
| |
(n=25) |
(n=25) |
(n=31) |
(n=16) |
(n=50) |
(n=47) |
| Maximum
weight loss (%) |
7.3 (4.5) |
6.8 (3.2) |
6.6 (3.7) |
5.24 (3.07) |
7.1 (3.8) |
6.1 (3.5) |
| Age to
regain birthweight (d) |
10.2 (4.4) |
9.8 (3.1) |
8.8 (3.5) |
8.56 (3.72) |
10.0 (3.7) |
8.7 (3.5) |
| Weight
gain (g/kg/d) |
16.0 (20.3) |
14.8 (4.6) |
13.3 (7.9) |
18.30 (6.6) |
15.3 (14.6) |
14.9 (7.8) |
| HC
increment (cm/wk) |
0.45 (0.21) |
0.45 (0.24) |
0.50 (0.30) |
0.53 (0.29) |
0.45 (0.22) |
0.51(0.29) |
| Length
increment (cm/wk) |
0.53 (0.33) |
0.59 (0.46) |
0.70 (0.45) |
0.51(0.32) |
0.56 (0.39) |
0.63 (0.42) |
|
* VLBW: very low birth weight; AGA: appropriate for gestational
age; SGA: small for gestational age; *Difference between AGA and SGA
infants for all parameters was not significant (P > 0.05); All values
are show as mean (SD); HC: head circumference. |
 |
|
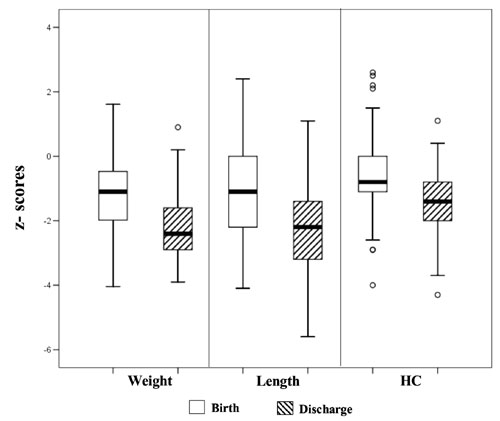
Fig. 2 Box and Whisker plot for z scores
for weight, length and HC in VLBW infants. Solid line in the box
shows median, top and bottom of the box are the interquartile range
with the range of the data. |
The mean Z scores for weight, length and HC at
birth in all subjects as calculated from the data from Fenton’s
references, were –1.17, –1.09 and –0.54, respectively. These decreased to
–2.16, –2.24 and –1.35, respectively by discharge (Fig. 2).
The mean fall in Z scores for each parameter from birth to
discharge were significantly lower in SGA as compared to AGA infants (P<0.01).
TABLE III


Characteristics and Growth Velocity of VLBW Infants as 100 g Birthweight  Category
| Category
(n) |
Birthweight |
GA |
Mean weight gain (SD) |
HC increment |
Length
increment |
| |
(g) |
(wk) |
g/d |
g/kg/d |
cm/wk |
cm/wk |
| |
mean (SD) |
mean (SD) |
|
|
mean (SD) |
mean
(SD) |
| Overall
(97) |
1257 (190.7) |
31.72 (2.3) |
22.58(17.1) |
15.18 (1.7) |
0.48 (0.2) |
0.60
(0.4) |
| 701- 800
(1) |
760 |
26.71 |
6.47 |
6.60 |
0.27 |
0.45 |
| 801-900
(3) |
853.3 (45.4) |
29.81 (2.4) |
15.80(2.6) |
12.50 (1.88) |
0.44 (0.13) |
0.66
(0.27) |
| 901-1000
(5) |
951.0 (24.6) |
30.09 (2.16) |
15.11(3.82) |
11.42 (2.92) |
0.37 (0.13) |
0.40
(0.21) |
| 1001-1100
(15) |
1051.7 (27.1) |
30.05 (2.12) |
27.41(36.26) |
19.48 (25.73) |
0.48 (0.24) |
0.54
(0.24) |
| 1100-1200
(14) |
1152.7 (23.1) |
31.29 (1.57) |
18.60(4.78) |
13.15 (3.25) |
0.45 (0.18) |
0.58
(0.36) |
| 1201-1300
(12) |
1258.3 (33.8) |
33.70 (2.47) |
22.60(4.42) |
15.25 (2.41) |
0.53 (0.20) |
0.82
(0.44) |
| 1301-1400
(16) |
1351.8 (33.1) |
32.06 (2.09) |
19.80(11.33) |
13.11 (7.91) |
0.46 (0.32) |
0.54
(0.33) |
| 1401-1500
(31) |
1457.9 (31.4) |
32.53 (1.96) |
25.71(13.49) |
16.21(8.59) |
0.51 (0.31) |
0.61
(0.53) |
|
GA: Gestation at Birth, g/d: weight gain in gram/day after
regaining birthweight, g/kg/d: weight gain/kg/day after regaining
birthweight. |
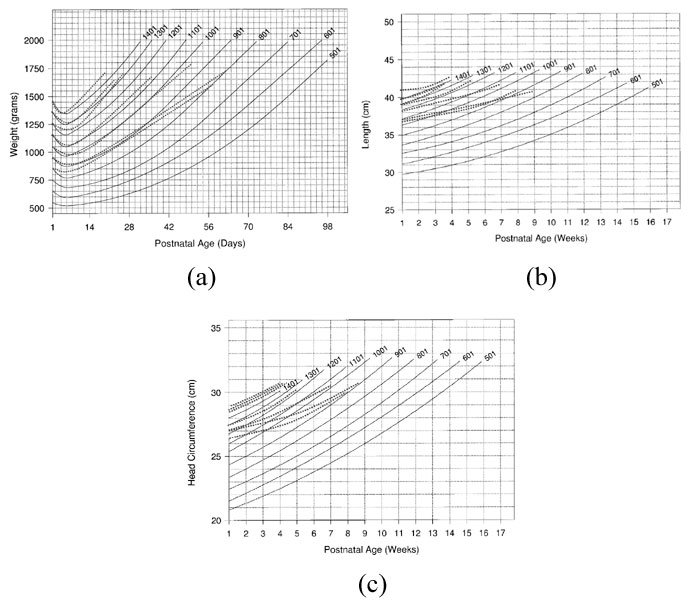
Infants were categorized by 100 g birth weight
intervals. Their gestation, birth weight, and growth velocity in each of
these categories is depicted in Table III. Maximum weight
loss, time taken to regain birth weight and later weight gain pattern
followed the Ehrenkranz postnatal growth curves except in infants with
birth weight below 1000 g who experienced slower growth (Fig. 3)(7).
The length and HC in this cohort were higher at birth and fell well below
respective reference lines by discharge, except in infants with
birthweight more than 1200g.
 |
|
Fig. 3 Postnatal growth of VLBW infants
categorized by 100g birth weight superimposed on reference growth
curves. Bold lines are reference lines and dotted lines are growth
pattern of study subjects. Adapted from Longitudinal growth of
hospitalized very low birth weight infants. (1999)(7). The lowest
dotted line indicates infants with birth weight between 801 – 900g
and each of above lines with 100g weight difference. a – Weight, b –
Length, c - HC.
Reproduced with permission from Pediatrics 1999; 104: 280-289.
Copyright (e) by AAP. |
Discussion
Infants in our study were smaller at birth in all three
parameters as compared to Fenton’s intrauterine growth references. This
difference could be due to racial and ethnic factors or due to nutritional
and life style differences in this population. Lower birth Z scores
for weight and length as compared to HC suggest brain sparing growth
restriction in this cohort. These infants exhibited slow growth during
hospital stay as indicated by a fall of approximately one Z score
in each of the three parameters from birth to discharge. This observation
is similar to the decline reported by Hack, et al.(1) in
VLBW infants from birth to 40 weeks.
With the nutritional practices used in this study, our
infants experienced a daily weight gain of 15.18+1.7 g/kg/d, which
is comparable to intra-uterine growth rate and other reports. However, the
weekly increments in HC and length were almost half of the intrauterine
growth expectations and other reports(7-9). This discrepant growth could
be due to relatively more accumulation of body fat as com-pared to muscle
mass and bone growth. Larger proportion of SGA infants in this study may
have contributed towards this trend. Whether this is due to variation in
quality and composition of low birth-weight feeding-formula, human milk
fortifiers, or due to poor growth potential of SGA infants in this ethnic
group, needs to be investigated.
Since most VLBW infants do not achieve intrauterine
growth rates during postnatal life, it seems more appropriate to monitor
their growth on postnatal charts. When we plotted the growth of our
infants on Ehrenkranz’s charts, it matched reference lines for each 100g
category, except in those below 1000g at birth(7). This could be due to
higher morbidity in extremely low birth weight infants in the present
setting. Growth comparable to these references in infants above 1200g is
possibly due to better maturity and feed tolerance, and lesser neonatal
morbidity. Higher length and HC at birth in each 100g category could be
due to higher gestational age in our cohort as compared to NICHD data(7).
However, even in these parameters, weekly increments were less than
expected(5,7).
SGA infants are at double jeopardy; in addition to
intrauterine growth restriction, many are born pre-maturely(10). They
continue to grow slow during early postnatal life(11,12). We noted that
both AGA and SGA infants had a significant drop in their growth Z
scores during hospital stay. Even though SGA infants experienced lesser
fall in their growth parameters as compared to AGA, they did not exhibit
desired catch up growth during hospital stay and continued to grow at a
lower trajectory. Both SGA and AGA VLBW infants in our study had
comparable growth velocity during hospital stay. This is in contrast to an
earlier observation which reported faster weight gains in SGA infants(7).
This could possibly be due to more growth restriction or poor growth
potential of SGA infants in our study popu-lation. Further analysis of a
category of infants bet-ween 30-34 weeks, which had comparable number of
SGA and AGA infants, revealed similar growth trends.
Slower brain growth during infancy is a predictor of
poor neurodevelopment outcome and has been shown to be associated with
poor school performance(13,14).
Smaller increments in HC during hospital stay in this cohort is a cause
for concern and there is a need for continued follow up of these infants
to monitor for catch up in head growth, along with their cognitive and
learning abili-ties. VLBW infants in this study also experienced slower
linear growth during hospital stay. They need a long term follow up for
catch up, as poor growth during early infancy has been shown to be
associated with persistent stunting in later life(15).
This study highlights the growth trends of VLBW infants
in a setting where incidence of low birth weight and growth restriction is
high. The disproportionate postnatal
growth pattern observed in this study may reflect altered body composition
with increased fat and lesser lean body mass, which may predispose them to
metabolic syndromes(16). This observation needs further validation, to
know the real growth potential of VLBW infants from this subcontinent. The
limitations of this study are small sample size, recruitment from a single
centre, and comparison of their growth with references from ethnically
different population. Another limitation is that almost 17% of the VLBW
infants were not available for follow up.
Contributors: SS and MM were responsible for the
study idea, design, data collection and analysis. AK and AB helped in data
collection and analysis. AS and PG helped in editing manuscript. NK
supervised and helped in review and editing the manuscript. All authors
approved the final content of the manuscript.
Funding: None.
Competing interest: None stated.
|
What is Already Known?
•
VLBW infants suffer growth lag during early postnatal period.
What This Study Adds?
• A
disproportionate growth was found in the VLBW infants studied.
|
References
1. Hack M, Schluchter M, Cartar L, Rahman M, Cuttler L,
Borawski E. Growth of very low birth weight infants to age 20 years.
Pediatrics 2003; 112: 30-38.
2. Astbury J, Orgill AA, Bajuk B, Yu VYH. Sequelae of
growth failure in appropriate for gestational age, very low birth weight
infants. Dev Med Child Neurol 1986; 28: 472-479.
3. Lundgren EM, Cnattingius S, Jonsson B, Tuvemo T.
Intellectual and psychological performance in males born small for
gestational age with or without catch-up growth. Pediatr Res 2001; 50:
91-96.
4. Hajnal BL, Siebenthal KV, Kovari H, Bucher HU, Largo
RH. Postnatal growth in VLBW infants: Significant association with
neurodevelopmental outcome. J Pediatr 2003; 143: 163-170.
5. Fenton TR. A new growth chart for preterm babies:
Babson and Benda’s chart updated with recent data and a new format. BMC
Pediatr 2003; 3: 13-22.
6. Fenton TR. Preterm Growth Chart 2003 calculations.
Available from http://members. shaw.ca/growthchart/Fenton Growth Chart
calculations.xls. Accessed on 10 February, 2009.
7. Ehrenkranz RA, Younes N, Lemons JA, Fanaroff AA,
Donovan EF, Wright LL. Longitudinal growth of hospitalized very low birth
weight infants. Pediatrics 1999; 104: 280-289.
8. American Academy of Pediatrics, Committee on
Nutritional Needs of Low-Birth-Weight Infants. Pediatrics 1977; 60:
519-530.
9. American Academy of Pediatrics, Committee on
Nutritional Needs of Low-Birth-Weight Infants. Pediatrics 1985; 75:
976-986.
10. Gutbrod T, Wolke D, Soehne B, Ohrt B, Riegel K.
Effects of gestation and birth weight on the growth and development of
VLBW small for gestational age infants: A matched group comparision. Arch
Dis Child Fetal Neonatal Ed 2000; 82: F 208-214.
11. Bertino E, Coscia A, Boni L, Rossi C, Martano C,
Giuliani F, et al. Weight growth velocity of very low birth weight
infants: role of gender, gestational age and major morbidities. Early Hum
Dev 2009; 85: 339-347.
12. Radmacher PG, Looney SW, Rafail ST, Adamkin DH.
Prediction of extrauterine growth retardation (EUGR) in VVLBWI. J
Perinatol 2003; 23: 392-395.
13. Powls A, Botting N, Cooke RWI, Pilling D, Marlow N.
Growth impairment in very low birthweight children at 12 years:
correlation with perinatal and outcome variables. Arch Dis Child 1996; 75:
F152-F157.
14. Hack M, Breslau N, Weissman B, Aram D, Klein N,
Borawski E. Effect of very low birth weight and subnormal head size on
cognitive abilities at school age. N Engl J Med 1991; 325: 231-237.
15. Knops NBB, Sneeuw CAK, Brand R, Hille ETM, Ouden
AL, Wit JM, et al. Catch-up growth up to ten years of age in
children born very preterm or with very low birth weight. BMC Pediatr
2005; 5: 26-34.
16. Yajnik CS, Fall CHD, Coyaji KJ, Hirve SS, Rao S,
Barker DJP, et al. Neonatal anthropometry: the thin-fat indian
baby. The Pune Maternal Nutrition Study. Int J Obes 2003; 27: 173-180.
|
|
|
 |
|
