Sandhoff disease is a rare autosomal recessive metabolic disorder of GM2 gangliosides. Recently, a 10-month-old female child of nonconsanguineous marriage presented with developmental delay. She had
attained social smile and approach to objects. There was no head
control. She was not able to recognize her parents. There were no
seizures. Vision and hearing were normal. However parents denied any
deterioration in the neurological state. Growth parameters including
head circumference were within normal limits. She had mild hypotonia.
Deep tendon reflexes were normal and plantar responses were flexor
bilaterally. She had bilateral cherry red spots in the fundus. Enzyme
assay from two separate laboratories showed marked reduction of
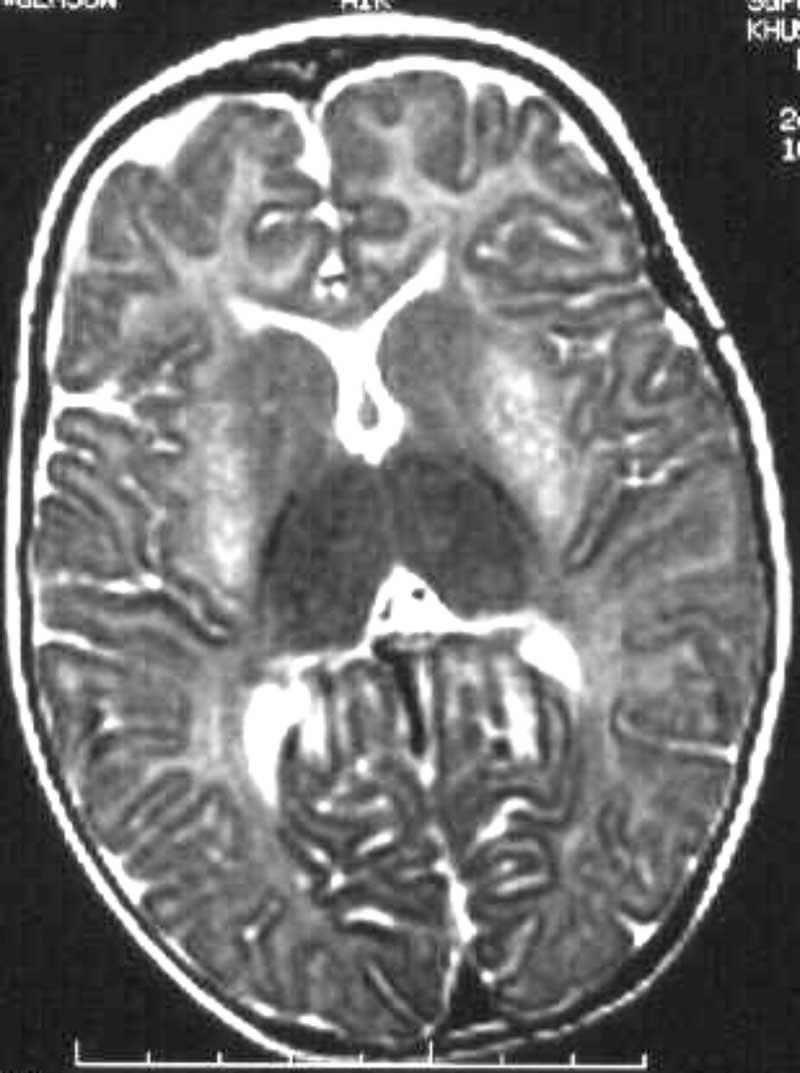
hexosaminidase A and B levels in the serum. Magnetic resonance imaging (MRI)
showed unmyelinated large parts of white matter of centrum semiovale.
Striking putaminal hyperintensity was seen on T2 weighted images
bilaterally (Fig. 1). Thalami also showed low signal on T2
weighted images bilaterally.
 |
|
Fig.1. Bilateral putaminal hyperintensity on T2 weighted images
|
Studies on magnetic resonance imaging in Sandhoff
disease are scant in literature. However as early as in 1993, Caliskan,
et al.(1) have suggested bilateral thalamic hyperdensity on computed
tomography as a diagnostic marker of Sandhoff disease. Several other
reports have shown involvement of thalamus, basal ganglia (caudate,
putamen, globus pallidus) and cerebellum in this condition with rare
involvement of other parts of brain(2-5). A review of these works
suggests basal ganglia are more consistently involved than the other
regions of the brain. Based on findings in three patients with GM2 gangliosidosis Grosso, et al. have suggested that MRI
pattern peculiar to GM2 gangliosidosis can be defined(4). There have been a few
attempts at clinical correlation with neuroimaging(3,4).
Our case shows further evidence to basal ganglia
involvement in Sandhoff disease. We alert our fellow physicians involved
in evaluation of neurometabolic diseases to look for these findings in
more cases and perform enzyme assay when such lesions are noted on MRI.
Any neuroimaging clue for the diagnosis of neurometabolic disorders are
of paramount importance as diagnosis based on clinical information is
very difficult and lack of access to biochemical assays in Indian
scenario.
Acknowledgements
The authors thank Dr. Rajendra V. Phadke, Professor
of Radiodiagnosis, Sanjay Gandhi Postgraduate Institute of Medical
Sciences for the radiological evaluation.
K.M. Girisha,
Shubha R. Phadke,
Department of Medical Genetics,
Sanjay Gandhi Postgraduate Institute of Medical Sciences,
Lucknow 226 014, (U.P.), India.
E-mail: [email protected]
1. Caliskan M, Ozmen M, Beck M, Apak S. Thalamic
hyperdensity- is it a diagnostic marker for Sandhoff disease? Brain
Dev 1993; 15: 387-388.
2. Koelfen W, Freund M, Jaschke W, Koeing S,
Schultze C. GM-2 gangliosidosis (Sandhoff’s disease): Two year follow
up by MRI. Neuroradiol 1994; 36: 1524.
3. Yuksel A, Yalcinkaya C, Islak C, Gunduz E, Seven
M. Neuroimaging findings of four patients with Sandhoff disease.
Pediatr Neurol 1999; 21: 562-565.
4. Grosso S, Farnetani MA, Berardi R, Margollicci
M, Galluzzi P, Vivarelli R, et al. GM2 gangliosidosis variant
B1 neuroradiological findings. J Neurol 2003; 250: 17-21.
5. Streifler JY, Gornish M, Hadar H, Gadoth N. Brain imaging in
late-onset GM2 ganglio-sidosis. Neurology 1993; 43: 2055-2058.
