The prevalence of obesity, and its associated
metabolic disorders, is increasing dramatically in developing countries,
including India [1-3]. Although body mass index (BMI) is a simple
indicator of overweight or obesity, body fat distribution plays a major
role in cardio-metabolic health during childhood [4-7]. An increased
proportion of fat mass and a decreased proportion of fat-free mass (FFM)
during childhood have both been associated with increased risk of
developing chronic disease in later life [8]. Thus, evaluating body
composition is necessary to predict metabolic risk in childhood.
Amongst body composition assessment techniques,
Bioelectric impedance analysis (BIA) and dual-energy X-ray
absorptiometry (DXA) are the most commonly used. DXA provides acceptable
accuracy in measuring body composition among children [9]. However,
since measuring body composition using the DXA requires expertise, is
expensive, and is often not available in clinical and epidemiological
settings, the BIA is a preferred tool.
Accuracy of body composition estimation by BIA has
been evaluated in Western or Asian populations in comparison with the
DXA [10-13], but the results are inconsistent [10], presumably due to
ethnic and phenotypic differences in the study cohorts. The present
study therefore attempted to validate body composition measurements by
BIA against DXA as the reference method in healthy Indian children and
adolescents.
Methods
A random sample of 210 children (114 boys; age 5-18
y) was selected from schools in and around Pune city, India. Stratified
random sampling method was used in the selection of schools and
subjects; participants were selected gender-wise over the age range of
5-18 years. A written informed consent from the parent and an assent
from each participant were obtained. The study was approved by the
Ethics Committee of the Hirabai Cowasji Jehangir Medical Research
Institute.
Height and weight were measured with participants in
light clothes and without shoes. Standing height was measured using a
portable stadiometer (Leicester Height Meter, Child Growth Foundation,
UK) to the accuracy of 1 mm. Weight was measured using an electronic
digital scale to the nearest 0.1 kg (Salter India). Body mass index
(BMI) was calculated (Weight (kg)/Height (meter)2),
and height for age z-scores (HAZ), weight for age z-scores (WAZ), and
BMI for age z-scores (BAZ) were computed using recent Indian growth
references [14]. A pediatric endocrinologist assessed Tanner stage (TS).
Body composition was assessed by GE-Lunar DPX Pro (GE
Healthcare, Waukesha, WI, USA) Pencil Beam DXA scanner (software version
encore 2005, 9.30.044) to measure total %BF, total Body Fat Mass (g),
Fat free Mass (FFM) (g) and Bone mineral content (BMC) (g).
Reproducibility of DXA measurements for %BF in children was 0.47 (2.78)%
[15]. Daily quality assurance scans were run as per standard protocols.
Body composition of the subjects was also measured by
BIA (Model BC-420MA, Tanita) after at least 3 hours of fasting and
voiding before measurements, as per manufacturer’s instructions to
ensure equivalent hydration state. The Tanita Body Composition Analyzer
measures body composition using a constant current source with a high
frequency current (50 kHz, 90µA). The eight electrodes are positioned so
that electric current is supplied from the electrodes on the tips of the
toes of both feet, and voltage is measured on the heels of both feet.
BIA measures body composition as fat%, fat mass, fat-free mass, total
body water, bone-free lean tissue mass (LTM), bone mineral amount
included in the entire bone (bone mass) by measuring bioelectrical
impedance in the body. BIA measurements were tested for test-retest
reliability on a pilot sample of ten subjects separately by measuring
them on BIA at two different time points. Reliability coefficient was
significant for body fat percent, fat mass, fat free mass, lean mass
(intra class correlation coefficient = 0.99, 0.98, 0.99, 0.96,
respectively P=0.0001).
Statistical analysis: All statistical analyses
were performed using SPSS version 21.0. An independent t test was
used to determine gender differences in the participants’ physical
characteristics, DXA measure-ments and BIA measurements. P values
<0.05 were considered significant. Pearson’s correlation coefficients
between %BF, FM, FFM, LM predicted by BIA and that measured by DXA as
also with BMI were estimated. Linear regression model analysis was
performed to adjust the body composition parameters for age, BMI and TS.
Differences in body composition measurements by BIA and DXA were
examined using a paired t-test. Bland-Altman plots were used to
determine the agreement between BIA and DXA measurements [16]. The
agreement between methods is represented by the mean difference, and the
SD of the differences along with the 95% limits of agreement as the mean
difference ±1.96 SD of the differences between methods. Lin’s
concordance correlation coefficient (Rc)
was used to measure the bivariate relationship of %BF and FFM obtained
from DXA with those obtained by BIA. The degree of agreement by Lin’s
coefficient was judged by using McBride’s scale for continuous
variables; <0.90 poor, 0.90–0.95 moderate, 0.95–0.99 substantial, and
>0.99 almost perfect [17].
Results
Physical characteristics of the study cohort of 210
children and adolescents (114 boys) (mean (SD) age 11.3(2.5) yr) are
presented in Table I. Almost all (94%) children and
adolescents had normal Z scores for height, weight and BMI [14].
When compared with adult-equivalent cut-offs of BMI for Asians
corresponding to 23 and 28 kg/m2
[18], majority (78%) of the participants were in normal BMI category and
14% were overweight (Table II).
TABLE I Physical Characteristics of the Study Participants (N=210)
|
Parameter |
Age group |
|
Boys |
5-9 y |
10-13 y |
14-18 y |
|
No. |
28 |
67 |
19 |
|
Age (yr) |
8.2 (1.5) |
11.9 (1.1) |
15.2 (1.1) |
|
Weight (kg) |
24.8 (6.0) |
35.5 (9.6) |
45.2 (9.2) |
|
Height (cm) |
125.0 (10.4) |
143.7 (11.0) |
159.4 (9.3) |
|
BMI (kg/m2) |
15.6 (2.1) |
16.9 (2.7) |
17.7 (2.6) |
|
HAZ |
-0.3 (0.9) |
-0.6 (1.1) |
-0.7 (1.1) |
|
WAZ |
-0.3 (0.8) |
-0.5 (1.0) |
-0.8 (0.8) |
|
BAZ |
-0.1 (0.8) |
-0.4 (0.9) |
-0.6 (0.8) |
|
Girls |
5-9 y |
10-13 y |
14-18 y |
|
No. |
34 |
52 |
10 |
|
Age (yr) |
8.5 (1.3) |
11.9 (1.0) |
15.0 (1.3) |
|
Weight (kg) |
25.4 (6.4) |
35.2 (8.7) |
42.1 (7.8) |
|
Height (cm) |
126.8 (10.0) |
144.1 (9.2) |
148.1(5.8) |
|
BMI (kg/m2) |
15.5 (2.1) |
16.8 (2.9) |
19.1 (3.5) |
|
HAZ |
-0.2 (0.9) |
-0.4 (1.0) |
-1.1 (0.8) |
|
WAZ |
-0.2 (0.9) |
-0.6 (0.9) |
-0.8 (1.0) |
|
BAZ |
-0.2 (0.8) |
-0.5 (0.9) |
-0.3 (1.1) |
*Results are expressed as mean (SD), HAZ: Height for Age
z-score,
WAZ: weight for Age z-score, BAZ: BMI for Age z-score.
|
TABLE II Classification of Children According to BMI and Tanner Stage
|
Boys |
Girls |
All |
|
(n=114) |
(n=96) |
(N=210) |
|
Adult equivalent BMI |
Proportion of children (%) |
|
|
|
Under weight |
5.3 |
3.2 |
4.3 |
|
Normal weight |
76.1 |
80.0 |
77.9 |
|
Over weight |
15.9 |
11.6 |
13.9 |
|
Obese |
2.7 |
5.3 |
3.8 |
|
Tanner stage |
|
|
|
|
I |
45.5 |
30.5 |
38.6 |
|
II |
22.3 |
20.0 |
21.3 |
|
III |
17.0 |
14.7 |
15.9 |
|
IV |
11.6 |
12.6 |
12.1 |
|
V |
3.6 |
22.1 |
12.1 |
|
BMI: body mass index. |
TABLE III Body Composition of the Study Participants by BIA and DXA
|
Parameter |
BIA |
DXA |
|
Boys |
Girls |
Boys |
Girls |
|
Age-group:5-9 years |
(n=28) |
(n=34) |
(n=28) |
(n=34) |
|
Body fat % |
11.5 (7.2) |
16.3 (6.5) |
17.6 (7.5)** |
25.7 (11.7)**a |
|
Fat free Mass (kg)a |
21.4 (3.7) |
20.4 (4.0) |
19.6 (3.4)** |
18.2 (3.4)** |
|
Lean Mass (kg) |
20.4 (3.5) |
19.4 (3.7) |
18.8 (3.2)** |
17.3 (3.2)** |
|
Bone mineral content (kg) |
1.0 (0.2) |
1.0 (0.3) |
0.9 (0.2)** |
0.8 (0.2)** |
|
Age-group:10-13 years |
(n=67) |
(n=52) |
(n=67) |
(n=52) |
|
Body fat % |
13.2 (9.5) |
20.5 (8.9) |
21.1 (8.9)** |
27.3 (9.3)** |
|
Fat free Mass (kg) |
29.5 (5.7) |
27.9 (5.1) |
26.9 (6.1)** |
25.4 (5.2)** |
|
Lean Mass (kg) |
28.0 (5.4) |
26.4 (4.7) |
25.6 (5.8)** |
24.1 (4.9)** |
|
Bone mineral content (kg) |
1.5 (0.4) |
1.5 (0.4) |
1.3 (0.3)** |
1.3 (0.3)** |
|
Age-group: 14-18 years |
(n=19) |
(n=10) |
(n=19) |
(n=10) |
|
Body fat % |
12.9 (9.7) |
30.8 (12.2) |
21.3 (9.8)** |
35.2 (9.1)** |
|
Fat free Mass (kg) |
36.4 (7.2) |
30.4 (3.4) |
34.4 (6.5)** |
28.4 (3.4)** |
|
Lean Mass (kg) |
34.6 (6.8) |
28.8 (3.2) |
(6.2)** |
26.7 (3.0)** |
|
Bone mineral content(kg) |
1.9 (0.4) |
1.7 (0.2) |
1.6 (0.4)** |
1.7 (0.4)** |
|
Adjusted means# |
|
Adjusted Body fat % |
13.6 (7.6) |
20.0 (8.0) |
20.0 (6.7)** |
26.9 (6.8)** |
|
Adjusted Fat free Mass (kg) |
29.3 (7.6) |
26.0 (4.2) |
27.2 (7.2)** |
23.6 (4.3)** |
|
Adjusted Lean Mass (kg) |
27.9 (7.1) |
24.7 (3.9) |
26.0 (6.9)** |
22.4 (4.0)** |
|
Adjusted Bone mineral content (kg) |
1.4 (0.4) |
1.4 (0.3) |
1.2 (0.3)** |
1.2 (0.3)** |
|
Results are expressed as mean (SD); Level of Significance =
** P<0.001, a: Estimate of FFM by DXA; # means from linear
regression analysis adjusting for age, BMI and TS; BIA:
Bioelectric impedance analysis; DXA: Dual-energy X-ray
absorptiometry. |
The comparison of body composition measurements by
BIA and DXA in the study participants is shown in Table III.
The estimation of body fat% by BIA was significantly lower than the body
fat% measured by DXA in both boys and girls across all age groups (P<0.001)
(Table III). The estimates of fat-free mass, bone mineral
content and lean mass by BIA were significantly higher than by DXA (P<0.001).
These differences in estimates of FFM, BM, LM and %BF were of similar
magnitude after predicting the adjusted means for age, BMI and TS by
linear regression model (Table III). The correlations
between BMI and body composition measured on BIA were r=0.527, r=0.895,
r=0.524 and r=0.847 (P< 0.01) for FFM, FM, LM and %BF
respectively. Similarly, correlations between BMI and body composition
measured on DXA were r=0.537, r=0.885, r=0.531 and r=0.767 (P<0.01)
for FFM, FM, LM and %BF respectively. The correlations between BIA and
DXA were r=0.98, r=0.965, r=0.98, r=0.941 and r=0.917 (P<0.01)
for FFM, FM, LM, BM and %BF, respectively. The Lin’s concordance
correlation coefficients for %BF in boys and girls were low and showed a
poor agreement between DXA and BIA measurements (Rc<
0.90) (Web Table I). The FFM determined by
DXA and BIA showed a moderate agreement (Rc
between 0.90-0.95) in boys but poor agreement in girls. Similar moderate
agreement in boys and poor agreement in girls was seen for lean mass.
Bone mineral content by DXA and BIA also showed poor agreement in both
boys and girls. Overall, the mean difference between %BF by DXA and BIA
was 6.7 (3.7)%. The 95% limits for differences between the two methods
were (-0.8%, 14.2%). The width of the interval suggests that the degree
of agreement is not acceptable for using the two measurement methods
interchangeably (Fig.1a). Percentage body fat by BIA was
lower by 5.9 (3.5)% than the DXA estimate in overweight children.
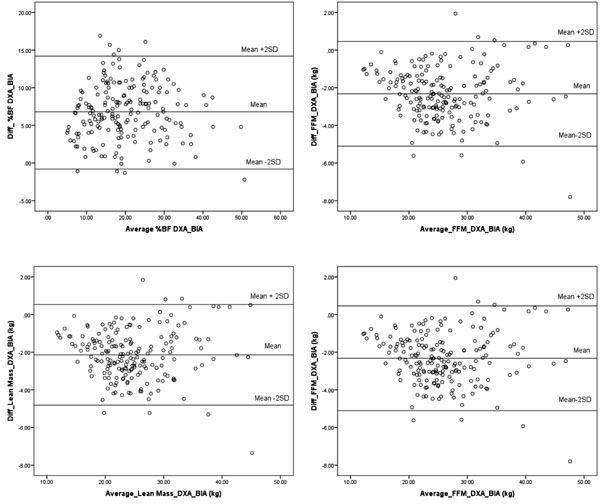 |
|
Fig. 1 Comparison of BIA with DXA by Bland-Altman
plots for (a) percent body fat, (b) fat-free mass, (c) lean
mass, (d) bone mass in children and adolescents.
|
BIA overestimated lean mass than the DXA with a mean
difference of -2.15 (1.34) kg. The 95% limits of agreement between the
two methods were (-4.82 kg, 0.51 kg) (Fig. 1b). The mean
difference between DXA estimate of FFM and BIA was -2.32(1.39) kg. The
95% limits of agreement between the two methods were (-5.11 kg, 0.46 kg)
(Fig. 1c).
The mean difference between BMC by DXA and BIA was
-0.18 (0.15) kg. The 95% limits of agreement between the two methods
were (- 0.48kg, 0.12 kg) (Fig. 1d). The bias for BIA
estimates of BMC as compared to DXA estimates was lower in children with
normal bone mass for bone area (n = 169, -0.15 (0.14) kg), than
those with low bone mass for bone area (n = 32, -0.26 (0.15) kg)
or children with poor bone mass for bone area (n = 9, -0.34
(0.16) kg) as per DXA 85th
and 95th cut offs (14), (P<0.001)
(Fig. 2). Thus, BIA overestimated lean mass, FFM and bone
mass as compared to DXA.
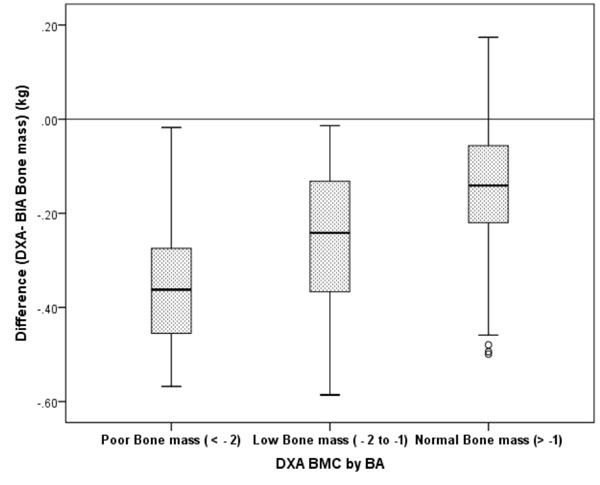 |
|
BMC: Bone Mineral content; BA: Bone Area.
BMC by BA: Z score calculated using DXA measurements. Data are
presented as the mean difference ±SE. Mean difference among
three groups of BMC by BA was statistically significant (P<
0.1).
Fig. 2 Bone mineral content-dependent
bias of BIA compared with DXA in children and adolescents.
|
When children were classified as normal fat, over fat
and excess fat using DXA body fat percentile cut-offs [7] and cut-offs
for BIA by McCarthy, et al (of 85th and 95th percent body fat
percentile) [21], 93% children
were below 85th percentile for DXA cut-offs as also below
85th percentile by McCarthy, both indicating normal percent body fat.
However, 64% of excess fat children by McCarthy’s cut-offs were verfat
(between 85th and 95th percentile) or excess fat (>95th percentile) by
DXA cut-offs.
Discussion
Our findings indicate that while BIA underestimated
percentage body fat by 6.7 (3.8)% as compared to DXA measurements in
apparently healthy children and adolescents, it overestimated fat-free
mass, lean mass (muscle mass) and bone mass as compared to DXA. These
differences were of similar order after adjusting for influence of age,
BMI and Tanner stage. The accuracy and correlations between BIA and DXA
for FFM, FM, and %BF were higher than those between BMI and DXA. Even
so, both methods were similar in identifying normal fat children and
children with increased fat as per the respective available cut-offs.
One of the limitations of the present study was that
majority of the children and adolescents in the study were normal weight
children and therefore, comparison of the lean and obese children and
adolescents for the same age and gender could not be performed. However,
amongst overweight children and adolescents, underestimation of %BF by
BIA and DXA was of similar order; 5.9% in boys and 5.8% in girls.
Measurement of body composition may be performed by
several methods such as by underwater weighing, air-displacement,
dual-energy X-ray absorptiometry (DXA), magnetic resonance imaging (MRI)
and computerized tomography (CT). However, either anthropometry (mainly
BMI) or BIA is a more practical method of assessing body composition in
the field setting [22]. The body mass index (BMI), although commonly
used as a surrogate measure for BF%, the relationship between BF% and
BMI is different is ethnic groups [23]. Thus, BIA maybe a more
preferable method for measuring body fat in the field setting.
An underestimation of 5% by BIA over DXA body fat%,
as we observed, is also reported in adults [12] and by 2% to 12% in
children [13,19]. The difference in percentage body fat estimates was
variable with different models of BIA devices [11] and also across body
fat ranges. A moderate agreement for FFM with different models of BIA
machines in comparison with the Hologic DXA has also been reported [11].
The underestimation by BIA may also be due to the use of
non-population-specific prediction equations by BIA models for
estimating fat and fat free mass from total body water [20].
Considering the cut-offs for body fat percentiles for
normal or excess body fat percentage [7] for the DXA and BIA (as per
85th and 95th percent body fat percentile) [21], 93% children were below
85th percentile of DXA as also below 85th percentile by McCarthy, both
indicating normal percent body fat. However, 64% of excess fat children
by McCarthy’s cut-offs were overfat (between 85th and 95th percentile)
or excess fat (>95th percentile) by DXA cut-offs. Apart from the
difference in method of assessment, this also could be because the
cut-offs for the DXA that we have used are based on Indian data while
the reference data for the BIA is based on Caucasian children. Hence,
more children were possibly classified as excess fat by the BIA cut-offs
than by the DXA cut-offs. This underlines the need for generating ethnic
specific BIA reference curves for identifying at risk children and
adolescents.
In conclusion, BIA and DXA techniques are not
interchangeable for % BF, FFM, lean mass and bone mass in children.
However, BIA may be used for the assessment of body composition in the
field/clinical setting preferably with the use of ethnic specific
references.
Contributors: SC, AK: concept and designed the
study, analyzed data and drafted the manuscript; NK: helped in data
analysis and manuscript writing; VE, LP, RM: collected data and helped
in data analysis; VK: analyzed data and manuscript writing.
Funding: Novo Nordisk India Pvt. Ltd. RM was
funded by a Fellowship Grant from the University Grants Commission
(UGC), Government of India
Competing Interest: None stated.
|
What is Already Known?
•
DXA is used to assess body
composition due to its precision although BIA is widely used in
clinical settings.
What This Study Adds?
•
BIA and DXA techniques are not interchangeable for
assessment of body composition in children.
•
BIA may be used for the assessment of body composition in
the field/clinical setting preferably with the use of ethnicity
specific references.
|
References
1. Khadilkar VV, Khadilkar AV, Cole TJ, Chiplonkar
SA, Pandit D. Overweight and obesity prevalence and body mass index
trends in Indian children. Int J Pediatr Obes. 2011;6:e216-24.
2. Deleuze Ntandou Bouzitou G, Fayomi B, Delisle H.
Child malnutrition and maternal overweight in same households in poor
urban areas of Benin. Sante. 2005;15:263-70.
3. Siervo M, Grey P, Nyan OA, Prentice AM.
Urbanization and obesity in The Gambia: a country in the early stages of
the demographic transition. Eur J Clin Nutr. 2006;60: 455-63.
4. Jahagirdar R, Hemchand KP, Chiplonkar SA,
Khadilkar VV, Khadilkar AV. Relationship between body mass index, fat
distribution and cardiometabolic risk factors in Indian children and
adolescents. Pediatr Obes. 2012;7: e37-41.
5. Artero EG, Ruiz JR, Ortega FB, España-Romero V,
Vicente-Rodríguez G, Molnar D, et al. Muscular and cardio
respiratory fitness are independently associated with metabolic risk in
adolescents: the HELENA study. Pediatr Diabetes. 2011;12:704-12.
6. Steene-Johannessen J, Anderssen SA, Kolle E,
Andersen LB. Low muscle fitness is associated with metabolic risk in
youth. Med Sci Sports Exerc. 2009;41:1361-7.
7. Khadilkar AV, Sanwalka NJ, Chiplonkar SA,
Khadilkar VV, Pandit D. Body fat reference percentiles on healthy
affluent Indian children and adolescents to screen for adiposity. Int J
Obes. 2013;37:947-53.
8. Barker DJ. The developmental origins of insulin
resistance. Horm Res. 2005;64:2-7.
9. Helba M, Binkovitz LA. Pediatric body composition
analysis with dual216 energy X-ray absorptiometry. Pediatr Radiol.
2009;39:647-56.
10. Sun G, French CR, Martin GR, Younghusband B,
Green RC, Xie YG, et al. Comparison of multi-frequency
bioelectrical impedance analysis with dual-energy X-ray absorptiometry
for assessment of percentage body fat in a large, healthy population. Am
J Clin Nutr. 2005;81:74-8.
11. Wang L, Hui SS, Wong SH. Validity of
bioelectrical impedance measurement in predicting fat-free mass of
Chinese children and adolescents. Med Scie Monitor. 2014;20:2298-310.
12. Li YC, Li CI, Lin WY, Liu CS, Hsu HS, Chen FN,
et al. Percentage of body fat assessment using bioelectrical
impedance analysis and dual-energy X-ray absorptiometry in a weight loss
program for obese or overweight Chinese adults. PloS One. 2013;8:e58272.
13. Gutin B, Litaker M, Islam S, Manos T, Smith C,
Treiber F . Body-composition measurement in 9-11–y-old children by
dual-energy X-ray absorptiometry, skinfold-thickness
measurements, and bio impedance analysis. Am J Clin Nutr.
1996;63:287-92.
14. Khadilkar V, Yadav S, Agrawal KK, Tamboli S,
Banerjee H, Cherian A, et al. Revised Indian Academy of
Pediatrics 2015 growth charts for height, weight and body mass index for
5 to 18-year-old Indian children. Indian Pediatr. 2015;52:47-55.
15. Khadilkar AV, Sanwalka NJ, Chiplonkar SA,
Khadilkar VV, Mughal MZ. Normative data and percentile curves for dual
energy X-ray absorptiometry in healthy Indian girls and boys aged 5-17
years. Bone. 2011;48:810-9
16. Bland JM, Altman DG. Measuring agreement in
method comparison studies. Stat Methods Med Res. 1999;8:135.
17. McBride GB. A Proposal for Strength-of-Agreement
Criteria for Lin’s Concordance Correlation Coefficient. NIWA Client
Report: HAM2005-062; National Institute of Water & Atmospheric Research:
Hamilton, New Zeeland, May 2005.
18. Khadilkar VV, Khadilkar AV, Borade AB, Chiplonkar
SA. Body mass index cut-offs for screening for childhood overweight and
obesity in Indian children. Indian Pediatr. 2012;49:29-34.
19. Hosking J, Metcalf BS, Jeffery AN, Voss LD,
Wilkin TJ. Validation of foot-to foot bioelectrical impedance analysis
with dual-energy X-ray absorptiometry in the assessment of body
composition in young children: The Early Bird Cohort. Br J Nutr.
2006;96:1163-8.
20. Sen B, Mahalanabis D, Kurpad AV, Shaikh S, Bose
K. Total body water and fat free mass: Evaluation of equations based on
bioelectrical impedance analysis in infants and young children in India.
Br J Nutr. 2010;104:256-64.
21. McCarthy HD, Cole TJ, Fry T, Jebb SA, Prentice
AM. Body fat reference curves for children. Int J Obes. 2006;30:598-602.
22. Wang J, Thornton JC, Kolesnik S, Pierson RN Jr.
Anthropometry in body composition. An overview. Ann N Y Acad Sci.
2000;904:317-26.
23. Deurenberg-Yap M, Schmidt G, van Staveren WA,
Deurenberg P. The paradox of low body mass index and high body fat
percentage among Chinese, Malays and Indians in Singapore. Int J Obes
Relat Metab Disord. 2000;24:1011-7.


