|
|
|
Indian Pediatr 2010;47: 925-929 |
 |
School Absenteeism Among Children and its
Correlates: A Predictive Model for Identifying Absentees |
|
Preena Uppal, Premila Paul and V Sreenivas*
From the Department of Pediatrics, Safdarjung Hospital,
New Delhi and *Department of Biostatistics,
AIIMS, New Delhi, India.
Correspondence to : Dr Preena Uppal, C-211, Sarvodya
Enclave, New Delhi 110 017, India.
Email: [email protected]
Received: December 30, 2008;
Initial review: February 4, 2009;
Accepted: October 30, 2009.
Published online 2010 January 15.
PII:S097475590900142-1
|
|
Abstract
Objectives: To determine the magnitude of
absenteeism and its correlates and to develop a model to predict
absenteeism in school children.
Design: A cross-sectional study.
Setting: Three government schools in Delhi.
Participants: 704 students, aged 10 to15 years.
Methods: Students were registered and interviewed
using a pre-designed questionnaire. The frequency and causes of school
absenteeism were ascertained by school records, leave applications and
one month’s recall. The factors were subjected to univariate analysis
and a stepwise multiple logistic regression analysis and a predictive
model was developed.
Results: The average absenteeism of a student
over 6 months was 14.3±10.2 days (95% CI 13.5-15.0). 48% children
absented themselves for more than two days per month on an average. The
main factors associated with school absenteeism were younger age, male
sex, increasing birth order, lower levels of parental education and
income, school truancy, school phobia and family reasons. The
discriminating ability of the predictive model developed was 92.4%.
Conclusions: It is possible to identify potential
absentees in school children.
Key words: Academic performance, Child, India, School
absenteeism.
|
|
S
chool absenteeism has been studied
in detail in relation to various social and physical causes(1,2). School
absenteeism
has been linked to maternal education, residence, and specific illnesses
like asthma, headache, abdominal pain, etc(3-7). However, role of social
pressures like poverty, part-time jobs etc. has not been explored. There
is paucity of literature comprehensively assessing the various factors
leading to school absenteeism.
We conducted this study to assess the magnitude of
school absenteeism and to study its correlates. Identification of social,
demographic and medical correlates may help in predicting children at
higher risk of absenting themselves and ensuring timely preventive
interventions.
Methods
A cross-sectional, school based study was conducted in
three government schools in South Delhi. The absenteeism was studied over
a 6 month period from July to December 2006. Total of 704 children, of
both sexes in the age group 10-15 years were registered in standards 6 to
9, in all the three schools. Each standard had 3 to 5 sections, varying
across schools. Of the standards having 3 sections, one section per
standard was randomly selected and all students in selected classes were
eligible to be enrolled. Where there were more than 3 sections per
standard, 2 were chosen randomly. Participants were included following an
informed written consent. Repeat visits were undertaken to interview those
who were absent at the first visit. Students who contributed only a few
school days due to late admission in the current session or who left the
school were excluded.
At enrolment, information on socio-demographic profile
of the students was collected. It included age, sex, class,
education and occupation of the parents, their family structure and
income. The socio-economic status was calculated as per the Revised
Kuppuswami’s Scale for determining socio-economic status of urban families
(2001).
A pre-designed questionnaire was administered to
ascertain the duration of absence and the causes for absenteeism, medical
and non-medical. Participants were assured of confidentiality and were
inquired about school truancy and various phobias of schools, teachers and
subjects. The causes of absenteeism were also ascertained by school
records, leave applications and one month’s recall by the students.
Students, teachers and parents were interviewed whenever needed.
The average absenteeism of more than 2 days per month
(i.e. 12 days in the 6 month study period), was defined as significant
absenteeism, for the purpose of our study. Despite extensive review of
existing literature, there is no consensus on the level of absenteeism
which may be regarded as significant. Previous studies have considered
absenteeism even when the child was absent on a single day, to define
their own criterion for absenteeism(8-10).
Data were analyzed using Stata 9.1 software. The
average number of days of absence in the 6 months reference for each child
was calculated along with 95% confidence interval. The proportion of
significant absentees was determined along with 95% confidence interval.
The correlates of significant absenteeism were assessed by calculating the
odds ratios. Stepwise multiple logistic regression analysis was performed
to identify predictors of absenteeism.
Results
A total of 704 students were registered of which 332
(47.16%) were boys. The mean number of days of absenteeism over the 6
month study period was 14.3±10.2 days (95% CI 13.5-15.0). The total number
of working days was 140.2±8.6 days over the last 6 months. Hence, the
average absenteeism per child was 10.2%. Only 9 children did not miss a
single school day. Many had missed 1-6 days (26.6%), 6-12 days (24.4%),
13-18 days (17.1%), 19-24 days (10.2%) or 25+ days (20.4%). 336 (47.8%)
children had significant absenteeism.
Table I


Relationship of Sociodemographic Factors with Significant School Absenteeism
|
Factors |
Absentees (n=336) |
Others (n=368) |
|
Sex* |
|
|
|
Male |
208 (61.9%) |
124 (33.7%) |
|
Female |
128 (38.1%) |
244 (66.3%) |
|
Age group(yrs)* |
|
< 14 |
250 (74.4%) |
191 (51.9%) |
|
> 14 |
86 (25.6%) |
177 (48.1%) |
|
Standard* |
|
6 |
92 (27.4%) |
40 (10.9%) |
|
7 |
122 (36.3%) |
102 (27.7%) |
|
8 |
68 (20.2%) |
112 (30.4%) |
|
9 |
54 (16.1%) |
114 (31%) |
|
Birth order* |
|
1 |
42 (12.5%) |
123 (33.4%) |
|
2 |
133 (39.6%) |
143 (38.9%) |
|
3 |
83 (24.7%) |
57 (15.5%) |
|
4 |
40 (11.9%) |
41 (11.1%) |
|
5 |
38 (11.3%) |
4 (1.1%) |
|
Religion |
|
Hindu |
288 (85.7%) |
330 (89.7%) |
|
Non Hindu |
48 (14.3%) |
38 (10.3%) |
|
Mother’s education* |
|
<5 standard |
180 (53.6%) |
97 (26.4%) |
|
>5 standard |
156 (46.4%) |
271 (73.6%) |
|
Father’s education* |
|
<8 standard |
124 (36.9%) |
82 (22.3%) |
|
>8 standard |
212 (63.1%) |
286 (77.7%) |
|
Residence |
|
|
|
City |
107 (31.8%) |
120 (32.6%) |
|
Urban slum |
229 (68.2%) |
248 (67.4%) |
|
Occupation* |
|
Unskilled |
48 (14.3%) |
14(3.8%) |
|
Semi skilled |
81 (24.1%) |
33 (9%) |
|
Skilled |
83 (24.7%) |
95 (25.8%) |
|
Clerk/Shop |
112 (33.3%) |
161(43.8%) |
|
Semi Professional |
12 (3.6%) |
65 (17.6%) |
|
Family size* |
|
£4 |
63 (18.8%) |
95 (25.8%) |
|
5 |
80 (23.8%) |
147 (39.9%) |
|
6 |
67 (19.9%) |
48 (13%) |
|
7 |
61 (18.25%) |
46 (12.6%) |
|
8 |
65 (19.3%) |
32 (8.7%) |
|
Family income/mo (Rs.)* |
|
|
|
£6,100 |
78 (23.2%) |
6 (1.6%) |
|
6,101-10,160 |
92 (27.4%) |
5 (1.4%) |
|
10,161-15,280 |
104 (30.9%) |
11 (3%) |
|
>15,281 |
62 (18.5%) |
346 (94%) |
|
*P<0.01. |
Male sex, increasing birth border and family size,
lower parental education and income were identified to be associated with
significant school absenteeism (Table I). Causes responsible
for their school absenteeism, as reported by the students are listed in
Table II.
Table II


Causes of School Absenteeism Reported by Students
|
Cause |
Absentees |
Others |
OR (95% CI) |
P value |
|
|
n = 336 |
n = 368 |
|
|
| Part-time job |
72 (21.4%) |
0 (0%) |
- |
<0.001 |
| Illness |
182 (54.2%) |
187 (50.8%) |
1.14 (0.85-1.54) |
0.37 |
| Chronic illness |
51 (15.2%) |
14 (3.8%) |
4.52 (2.45-8.34) |
<0.001 |
| Perception of ill health |
150 (44.64%) |
129 (35.1%) |
1.49 (1.10-2.02) |
<0.001 |
| Family function |
162 (48.2%) |
115 (31.2%) |
2.05 (1.51-2.78) |
<0.001 |
| Family illness |
103 (30.6%) |
62 (16.85%) |
2.2 (1.52-3.12) |
<0.001 |
| Family problem |
141(42%) |
36 (9.8%) |
6.7 (4.44-10.01) |
<0.001 |
| School phobia |
159 (47.32%) |
82 (22.3%) |
3.13 (2.26-4.34) |
<0.001 |
| School truancy |
59 (17.6%) |
2 (0.5%) |
39.0 (9.44-160.90) |
<0.001 |
| School load |
167 (49.7%) |
121(32.9%) |
2.02 (1.49-2.44) |
<0.001 |
| Tuitions |
27 (8%) |
0 |
- |
<0.001 |
On stepwise multiple logistic regression analysis,
gender, age group ,birth order, parents’ education and income, school
phobia, school truancy, school load and absenting for family reasons were
found to be independent significant factors responsible for school
absenteeism (Table III). Based on these factors, we
developed a model to predict absente-eism, taking the sum of the
regression coefficients weighed by the code for each predictor. All the
variable scores for a particular child were summed up to arrive at a final
score.
Table III


Predictive Model Based on Multivariate Regression Analysis
| Variable |
Code |
Regression |
OR 95% CI |
| |
|
coefficient |
|
| Sex |
|
-1.40 |
|
|
Male |
0 |
|
1.00 |
|
Female |
1 |
|
0.25 (0.15-0.40) |
| Family care |
|
1.76 |
|
|
No |
0 |
|
1.00 |
|
Yes |
1 |
|
5.81 (3.15-10.73) |
| Age group (years) |
|
-1.50 |
|
|
<14 |
0 |
|
1.00 |
|
>14 |
1 |
|
0.22 (0.13-0.39) |
| School phobia |
|
1.17 |
|
| No |
0 |
|
1.00 |
| Yes |
1 |
|
3.22 (1.87-5.54) |
| School truancy |
|
2.69 |
|
|
No |
0 |
|
1.00 |
| Yes |
1 |
|
14.78(2.92-14.85) |
| Birth order |
|
0.71 |
|
| <3 |
0 |
|
1.00 |
|
>3 |
1 |
|
2.02 (1.21-3.38) |
| Father’s education |
|
-0.68 |
|
| <8 standard |
0 |
|
1.00 |
| >8 standard |
1 |
|
0.51(0.29-0.87) |
| Mother’s education |
|
-1.15 |
|
| <5 standard |
0 |
|
1.00 |
| >5 standard |
1 |
|
0.32 (0.19-0.53) |
| Income (Rs.) |
|
-2.58 |
|
| <10,160 |
0 |
|
1.00 |
| >10,161 |
1 |
|
0.08(0.03-0.16) |
| Family illness / demise |
|
0.67 |
|
|
No |
0 |
|
1.00 |
|
Yes |
1 |
|
1.96 (1.00-3.84) |
| School load |
|
1.25 |
|
|
No |
0 |
|
1.00 |
|
Yes |
1 |
|
3.49(2.10-5.77) |
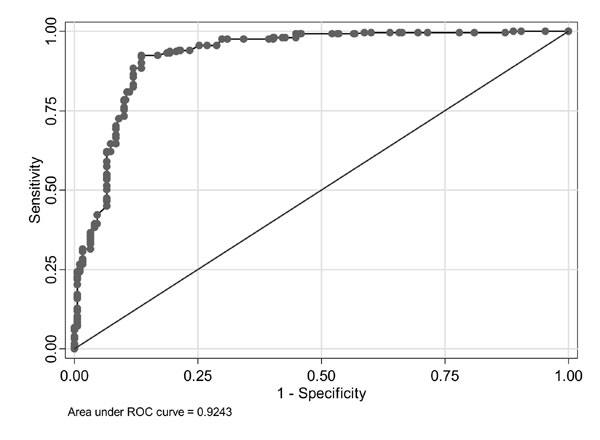
The total score generated can range from a minimum of
-6.1 to a maximum of + 6.5. A positive score i.e.
³0
indicates that there are 87.7% chances of that child being a significant
absentee, whereas a negative score i.e. <0 indicates that there are 79.5%
chances of that child being a regular attendee. For this model, the area
under the receiver operating characteristic (ROC) curve was calculated to
be 92.4% (Fig. 1).
 |
|
Fig.1. The receiver operating
characteristic curve. |
We also found that school absenteeism had negative
correlation with the academic performance of the students (r =
–0.513).
Discussion
The average absenteeism per child in our study is
10.2%. Gender (male sex) age group, birth order, parents’ education and
income, school phobia, school truancy, school load and absenting for
family reasons were found to be independent significant factors
related to increased school absenteeism.
As compared to a study conducted by Awasthi, et al.(8)
in 2000-2001 who calculated prevalence as 4.7%, the absenteeism has
increased. However in New York(2), percentage of absenteeism varied
between 7.3% to 17.8%. The factors found significant in our study are
consistent with previous studies linking absenteeism to male gender(8),
younger age(11), increasing birth order(12) and lower parental education
and income(1,13,2). A different trend was seen in the NCHS study(2) where
absenteeism was higher among older students. Ananthakrishnan, et al.(11)
found no significant gender difference. The differences may be
attributable to different settings of the study. Despite extensive
research we could not find a multivariate analysis of the factors of
school absenteeism.
We developed the model based on the factors found to be
significant. Our prediction models appear to be useful for predicting
prospective absentees incorporating relevant risk factors. There are no
existing models to predict absenteeism. This model can be applied to all
the students in the given setting; however, modification and further
evaluation by receiver operating characteristic curve may be required when
applied to a different setting(14,15).
Hence, school absenteeism has a high magnitude, with
48% children absenting themselves for more than two days per month. Our
model predicts the chances of a particular child to be an absentee. The
predictive value of the model is about 92.4% and can be used for timely
preventive interventions
Contributors: PP conceptualized and designed the
study, interpreted data, revised manuscript and approved the final version
to be published. She will act as guarantor of the study. PU acquired the
data, drafted the article and helped in final approval of the manuscript.
VS analyzed the data, revised contents and helped in final approval.
Funding: None.
Competing interests: None stated.
|
What is Already Known?
• School absenteeism is associated with asthma,
headache, abdominal pain, male sex, younger age , increasing birth
order and lower parental education and income.
What This Study Adds?
• This study provides a model to predict
absenteeism in school children based on its correlates and also
identifies school truancy, school phobia, school load and absenting
for family reasons as new independent significant factors associated
with school absenteeism in the population studied.
|
References
1. Gupta JP. An exploratory study of absenteeism in a
school in a suburban area in New Delhi. Indian J Pediatr 1968; 35:
299-313.
2. Besculides M, Heffernan R, Mostashari F, Weiss D.
Evaluation of school absenteeism data for early outbreak detection, New
York City. BMC Public Health 2005; 5: 105.
3. Parcel Guy S, Gilman Susan C, Nader Philip R, Harvey
B. A comparison of absentee rates of elementary school children with
asthma and non asthmatic schoolmates. Pediatrics 1979; 64: 878-881.
4. Millard MW. Children with asthma miss more school:
fact or fiction? Chest 2009; 135: 303-306.
5. Breuner CC, Smith MS, Womack WM. Factors related to
school absenteeism in adolescents with recurrent headache. Headache 2004;
44: 217-222.
6. Unalp A. Prevalence and characteristics of recurrent
headaches in Turkish adolescents. Pediatr Neurol 2006; 34: 110-115.
7. Saps M, Seshadri R, Sztainberg M, Schaffer G,
Marshall BM, Di Lorenzo C. A prospective school-based study of abdominal
pain and other common somatic complaints in children. J Pediatr
2009; 154: 322-326.
8. Awasthi S, Sharma A. Survey of school health and
absenteeism in Lucknow. Indian Pediatr 2004; 41: 518.
9. Hammond B, Ali Y, Fendler E, Dolan M, Donovan S.
Effect of hand sanitizer use on elementary school absenteeism. Am J
Infect Control 2000; 28: 340-346.
10. Reid K. The self- concept and persistent school
absenteeism. Br J Educ Psychol 1982; 52: 179-187.
11. Ananthakrishnan S, Nalini P. School absenteeism in
a rural area in Tamil Nadu. Indian Pediatr 2002; 39: 847-850.
12. Kaplan BA, Mascie Taylor CG, Boldsen J. Birth order
and health status in a British national sample. J Biosoc Sci 1992; 24:
25-33.
13. Rumberger RW. Dropping out of high school: the
influence of race, sex, and family background. Am Educ Res J 1983; 20:
199-220.
14. Shapiro AR. The evaluation of clinical predictions.
A method and initial application. N Engl J Med 1977; 296: 1509-1514.
15. Hanley JA. The meaning and use of the area under a
receiver operating characteristic (ROC) curve. Radiology 1982; 143: 29-36.
|
|
|
 |
|
