 |
|
Brief Reports Indian Pediatrics 2001; 38: 1270-1277 |
||||||||||||||||||||||||||||||||||||||||||||||||||||||||||||||||||||||||||||||||||||||||||||||||||||||||||||||||||||||||||||||||||||||||||||||||||||||||||||||||||||||||||||||||||||||||||||||||||||||||||||||||||||||||||||||||||||||||||||||||||||||||||||||||||||||||||||||||||||||||||||||||||||||||||||||||||||||||||||||||||||||||||||||||||||||||||||||||||||||||||||||||||||||||||||||||||||||||||||||||||||||||||||||||||||||||||||||||||||||||||||||||||||||||||||||||||||||||||||||||||||||||||||
|
Epidemiological Features of Childhood Cancers in Greater Mumbai |
||||||||||||||||||||||||||||||||||||||||||||||||||||||||||||||||||||||||||||||||||||||||||||||||||||||||||||||||||||||||||||||||||||||||||||||||||||||||||||||||||||||||||||||||||||||||||||||||||||||||||||||||||||||||||||||||||||||||||||||||||||||||||||||||||||||||||||||||||||||||||||||||||||||||||||||||||||||||||||||||||||||||||||||||||||||||||||||||||||||||||||||||||||||||||||||||||||||||||||||||||||||||||||||||||||||||||||||||||||||||||||||||||||||||||||||||||||||||||||||||||||||||||||
|
Reliable data on incidence and mortality of childhood cancers are available from only a few areas in the developing countries(1). Analysis of specific tumor types show more striking geographic variations of rates that are not readily explained by deficiencies in the data. The types of cancer occurring in childhood are very different from those occurring in adults; and unlike the latter it is essential that they should be classified by histology rather than primary site of the tumor. Childhood cancer is also rare as compared to adult cancer. The incidence is only 2% of that in adults in developed countries and about 3% in developing countries(2). In general, the most common adult cancers hardly ever occur in children. Thus, it is of particular interest to identify which adult tumors do occur in children, and especially to determine whether these occur in areas where the incidence in adults is high. It is also likely that genetic predisposition has a greater role in the etiology of childhood tumors than those of adults, and thus comparisons between different ethnic groups living in the same area or between similar ethnic groups in different environments may be particularly relevant. With this in background, an attempt has been made to make an epidemiological assessment of childhood cancers in Mumbai. Subjects and Methods The data collected at the Mumbai cancer Registry for the latest five years (1993 to 1997) was used for this study. An extensive analysis was carried out on childhood cancers for incidence as well as mortality by age, sex, site, histology, etc. The classification scheme used for primary site is ICD-9(3) and for histology ICD-O(4). Analysis of this was carried out by examining the crude, age specific and age adjusted rates. Mumbai, a densely populated urban metropolis on the west coast of India, occupies an area of 603.0 km2 and is the smallest administrative district in the Maharashtra state. It is situated between latitudes 18º 54' and 19º 18' north and longitudes 70º 43' and 73º 00' east. The population count of Mumbai at the 1991 census was 9,908,547 persons with a sex ratio of 819 females per 1000 males and a density of 16,432 inhabitants per square kilometer. Mumbai is the industrial heart of India and has a multilingual population, representing every state in the union. As per 1991 census, the child population count for Mumbai was 3165000 (29.7%) out of 10651000 total count. The Mumbai Cancer Registry was established in June 1963 as a unit of the Indian Cancer Society, at Mumbai, with the aim of obtaining reliable morbidity and mortality data on cancer from a precisely defined urban population. The actual compilation of data could only begin in 1964. Until then, no continuing surveys had ever been undertaken anywhere in India. The Indian Council of Medical Research realizing the importance of information on the incidence of cancer for planning for cancer control programs established National Cancer Registry Project (NCRP) in 1982. Mumbai Cancer Registry joined this network program in 1982. Other than Mumbai, the registries at Chennai, Banglore, Delhi, Bhopal and Barshi are the members of this network. The Mumbai Registry today, covers more than 120 hospitals and private nursing homes in the metropolitan area. Staff members personally visit the wards of the co-operating hospitals regularly, to interview all identified cancer patients and also those under investigation. The record files maintained by the various departments of these hospital (Pathology, Hematology, Radiology) and the various specialized surgical and medical wards are also examined. As a result of such data collection from different hospitals, one and the same patient is found to be registered at two or more hospitals. Care is taken to see that multiple entries for the same patient are not made in the records. For population based Cancer Registries, the indicators ‘proportion of deaths in period’, ‘proportion of death certificate only’ and ‘stability of age adjusted incidence rates can determine the completeness of coverage of data. The indicators like ‘Proportion of cases registered after histological verifications’, ‘proportion of cases where age is not known’, ‘Flattening of age incidence curve’, and ‘proportion of other and unspecified neoplasms’ can throw some light on the quality of the data collected by the registry. In Mumbai Cancer Registry data, the proportion of deaths in period is 52%, proportion of death certificate only is about 6% – which is quite low, and comparison of age adjusted incidence rate over the recent years does not show any statistically significant change. These facts indicate that the Mumbai registry data is complete. At present in Mumbai Cancer Registry data, the percentage of histo-logical confirmation is about 85% – which is quite high, the proportion of age not known is only 0.02% – which is quite low and proportion of other and unspecified site is only 1% – which is also very low, these indicators show that the quality of Mumbai Cancer Registry data is reasonably good. Results During the five year period 1993 to 1997, a total of 1330 children with various cancers were registered in Mumbai. During the same time, 40,303 new cancers were registered for the entire population; that is, childhood cancers claimed 3.3% share of the total cancer load. Of the 1330 childhood cancers, 814 were boys and 516 were girls giving a sex ratio of 1.58:1 in favor of boys. Corresponding sex ratio in the general population amongst children was 1.06:1 About 36% of children suffering from various cancers were found to be below 5 years of age. The age groups 5-9 and 10-14 years shared the remaining burden equally. On analyzing the percentage of cases diagnosed before death in children by method of diagnosis employed, it was observed that more than 94% cases were confirmed microscopically, and less than 2% cases were diagnosed clinically. Out of total childhood cancers 36, 43 and 21% were resident in city, suburb and extended suburb, respectively. The total number of cases registered, crude rates, age adjusted incidence rates to the world population(5) and percentage distribution by site and sex for childhood cancers are given in Table I. The total crude incidence rates per 100,000 populations were 10.0 for males and 6.8 for females. Age adjusted incidence rate for world population and crude rates for both the sexes for total childhood cancers did not show any differences. Leukemias showed the highest incidence rate followed by CNS tumors in both the sexes. Male preponderance was observed at all sites and was most marked in the leukemias and lymphomas.
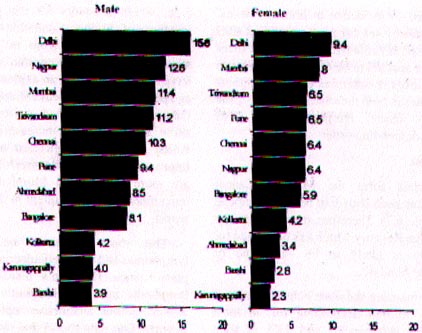
The age adjusted incidence rates by sex for the various national population are presented in Fig. 1. For national comparison the inci-dence rates for the year 1995 have been compared as 1995 is the mid-year for the data utilized for study period of 1993-97. Figure 1 clearly shows that cancer is much more in boys than in girls. It could be as a result of our cultural factors wherein boys get more attention and are brought to hospital more often for management. As far as national comparison is concerned, the highest incidence was observed in New Delhi population in males as well as in females. The lowest incidence was noted for Barshi population in both the sexes. When Mumbai rates are compared internationally, it is observed that these occupy a lower ranking in both the sexes (Fig. 1).
A total of 557 deaths due to cancers were noted in the resident population of Mumbai under the age of 15, during the period under review. More of less the same pattern by sex, age and residence was observed in mortality, as observed in incidence. The total number of deaths due to cancer, crude rates, age adjusted incidence rates (world) and percentage distribution by site and sex for childhood deaths are presented in Table II. The crude and age adjusted death rate per 100,000 population for all cancers was 4.4 for males and 2.8 for females and age adjusted incidence rates per 100,000 population were 2.8 and 2.9, respectively. More or less the same site distribution pattern was observed in mortality as observed in incidence in both the sexes. Fatality rates by sex for most prominent sites are presented in Table III. Fatality from cancer in children appears to be of the same order in both the sexes. Leukemias have the highest fatality rates in both the sexes followed by the connective tissue, lymphomas and CNS tumors in descending order. Discussion The data form the Mumbai Cancer Registry has been shown to be both complete and reliable(6,7). Therefore, data collected by the Mumbai Registry which has been used for this study is likely to be valid and of acceptable standard. Leukemias are the most common cancers affecting children accounting for, in most populations between 25 and 35% of total malignancies(8). In our data, the share of leukemias was 33% of the total childhood cancers. Acute lymphoblastic leukemias comprised the overwhelming majority of cases, with acute non lymphatic leukemias, the only other subtype occurring regularly in children. The incidence of total leukemia was highest among children under 5 years. Greaves suggested that acute lymphatic leukemia of the common B-cell precursor type, which accounts for the peak in the incidence of childhood leukemias at the age of 2 to 5 years, arises from to spontaneous mutations(9). Socio-economic factors also have been proposed as an explanation for the age peak in childhood leukemias(10). Most of the trend studies carried out on leukemias show an evidence of increase in incidence which may be an indication of diagnostic improvement only while myeloid leukemias are more frequent in Mumbai, lymphatic leukemias are more frequent in the developed world. Table III__Fatality Rates (%) of childhood cancers, Greater Mumbai, 1993-97.
The most common neoplasms of lymphomas and other reticuloendothelial neo-plasms were Hodgkin’s disease, Burkitt’s lymphoma and non-Hodgkin’s lymphomas which exhibit distinctive epidemiological features. Our data shows that there is a share of 16% in males and 9.3% in females of this group in total childhood cancers (Table I). Hodgkin’s disease contributes about 60% cases of this group. Our data indicates that the incidence for Hodgkin’s disease is lowest in the youngest children followed by a pro-nounced increase with age. The highest incidence in the world for Hodgkin’s disease was 10.8 per million population in Costa-Rica(8). It has long been suggested that socio-economic factors are involved in the causation of Hodgkin’s disease in parts of sub-Saharan Africa where Burkitt’s lymphoma is epidemic. In high risk areas, Burkitt’s lymphomas occurs in head and neck. In most of the countries the incidence is decreasing as a result of malaria eradication programs. Strong evidence of temporo-spatial clustering was found in the West Nile District of Uganda during the period 1961-1965(11). Tumors of the central nervous system (CNS) are the second most frequent form of cancer in children. In most populations, they comprise between 17 to 25% of all neoplasms. In our data, the share of CNS tumors is 14% and it ranks 3rd; ependymomas, astro- cytoma, medulloblastomas and other gliomas comprise the four subcategories. More boys are affected with CNS tumors than girls in most populations. There is not much evidence of ethnic variations in the risk of CNS tumors in children(12). A substantial proportions of cases of retinoblastoma are hereditary arising through germ-line mutations in tumor suppressor genes(13). The highest incidence of retino-blastoma has been observed in Brazil, Nigeria and Uganda of the order of 7 per million population(8). Our data records, an incidence of 0.5 per million of boys and 0.7 for girls (Table I). Retinoblastoma has the lowest median age of all childhood cancers (approxi-mately 15 months) and bilateral cases tend to be diagnosed at a younger age than unilateral cases. Incidence peaks in the first year of life and declines gradually with age thereafter. In our data, renal tunors represent approximately 5% of all cases diagnosed in children. As observed in almost all popula-tions in our data also, the relative frequency in girls exceeds that in boys (Table I). Willm’s tumor or nephroblastoma, is an embryonal malignancy which arises for remants of immature kidney. It comprises approximately 95% of all renal neoplasms. Sixty five per cent Willm’s tumors are experienced by children under 5 years of age, the proportion drops to 35% in children aged 5-9 years and to 10% for those aged 10-14 years. Willm’s tumor may occur unilaterally or bilaterally. Although uncommon, hepatic tumors constitute a clearly defined growth of child-hood neoplasms. In our series they constituted about 2% cases of total childhood cancers (Table I). This group includes hepatobalstoma and hepatic carcinoma. The incidence of hepatic tumors is highest in children aged under 1 years. As observed worldwide, a male preponderance in incidence was also docu-mented in our data with the ratio being 3:1. Bone tumors comprises around 5% of all cancers in childhood. In most of the countries, osteosarcoma and Ewing’s sarcoma are the most common(8). Osteosarcoma is very rare below the age of 5 years, but increases steeply thereafter. Ewing’s sarcoma is also very rare under 5 years and the incidence increases with age, but less markedly than for osteo-sarcoma. The soft tissue sarcoma group contains three sub categories: (a) rhabdomyosarcoma, (b) fibrosarcoma and (c) other and unspecified soft tissue sarcomas. Soft tissue sarcomas accounts for 4 to 5% of all childhood sarcomas(8). The incidence of soft tissue sarcomas is highest in infants. In most series more boys are affected than girls. For studying the change in incidence of childhood cancer in Greater Mumbai, the data published for every five years from 1964, which has appeared in series in volumes of "Cancer Incidence in Five Continents" published by International Agency for Research on Cancer was used. It was observed that there was no significant change in incident patterns of childhood cancers over a period of time. Majority of childhood cancers are classi-fied as we morphology as against to topo-graphy (primary site), hence in discussion part each childhood cancer has been discussed on the basis of histological distribution. Most of the tumors in children occur more frequently in boys than girls. However, for acute nonlymphatic leukemia, osteosarcoma, retinoblastoma and melanoma the sex ratio is around unity. The only two tumors, which are more frequent in girls, are carcinomas of the adrenal cortex and thyroid. Rates are highest for infants for neuroblastoma, retinoblastoma, soft tissue sarcoma and hepatic tumors and distinctive peak in the age range of 1-5 years is well documented for acute lymphatic leukemia. Wilm’s tumor and germ cell tumor are more common in children under 5 years than in older age groups. The rationale for considering childhood cancers separately from cancers in adults is that there are differences in their sites of occurrence in the histological appearance and in their clinical behavior. Many of the tumors have histological features which resemble fetal tissues at various stages of development and are therefore designated as embryonal. Childhood cancers tend to have short latent periods, but are generally more responsive to chemotherapy than the tumors typically occurring in adults. Thus although specific types of childhood cancers are uncommon, collectively they represent an important public health problem. Attempts need to be made to unravel some of these differences and prospective epidemiological studies on childhood canners need to be conducted to allow for a national policy. These studies on pediatric oncology are particularly important in helping to throw light on the genetic component in etiology and possibly also regarding the relationship between genetic and extrinsic factors. Contributors: YBB co-ordinated the study and drafted the paper; he will act as the guarantor for the paper. ASH guided the study. LS was responsible for data analysis. Funding: None. Competing interests: None stated.
| ||||||||||||||||||||||||||||||||||||||||||||||||||||||||||||||||||||||||||||||||||||||||||||||||||||||||||||||||||||||||||||||||||||||||||||||||||||||||||||||||||||||||||||||||||||||||||||||||||||||||||||||||||||||||||||||||||||||||||||||||||||||||||||||||||||||||||||||||||||||||||||||||||||||||||||||||||||||||||||||||||||||||||||||||||||||||||||||||||||||||||||||||||||||||||||||||||||||||||||||||||||||||||||||||||||||||||||||||||||||||||||||||||||||||||||||||||||||||||||||||||||||||||||
| References | ||||||||||||||||||||||||||||||||||||||||||||||||||||||||||||||||||||||||||||||||||||||||||||||||||||||||||||||||||||||||||||||||||||||||||||||||||||||||||||||||||||||||||||||||||||||||||||||||||||||||||||||||||||||||||||||||||||||||||||||||||||||||||||||||||||||||||||||||||||||||||||||||||||||||||||||||||||||||||||||||||||||||||||||||||||||||||||||||||||||||||||||||||||||||||||||||||||||||||||||||||||||||||||||||||||||||||||||||||||||||||||||||||||||||||||||||||||||||||||||||||||||||||||
| ||||||||||||||||||||||||||||||||||||||||||||||||||||||||||||||||||||||||||||||||||||||||||||||||||||||||||||||||||||||||||||||||||||||||||||||||||||||||||||||||||||||||||||||||||||||||||||||||||||||||||||||||||||||||||||||||||||||||||||||||||||||||||||||||||||||||||||||||||||||||||||||||||||||||||||||||||||||||||||||||||||||||||||||||||||||||||||||||||||||||||||||||||||||||||||||||||||||||||||||||||||||||||||||||||||||||||||||||||||||||||||||||||||||||||||||||||||||||||||||||||||||||||||
![]()