|
|
|
Indian Pediatr 2013;50: 493-495 |
 |
Waist to Height Ratio for Recording the Risks
of Overweight in Schoolchildren in Kerala
|
|
Seeja Thomachan Panjikkaran
From the Department of Food Science and Nutrition,
KVK, Kerala Agricultural University, KAU Post, Thrissur, Kerala, India.
Correspondence to: Dr Seeja Thomachan Panjikkaran,
Department of Food Science and Nutrition, KVK, Kerala Agricultural
University, KAU Post, Thrissur, Kerala 680 656, India.
Email:
[email protected]
Received: December 13, 2011;
Initial review: January 30, 2012;
Accepted: September 21, 2012.
PII: S097475591101017
|
The prevalence of overweight/obesity among 6000 children at 7-12
years was monitored using the established methodologies. Prevalence
rates obtained using percentiles were proximate to that using
waist-to-height ratio (WHTR) 0.50 and were on par with the reported
rates. The prevalence were worked out with WHTR values from 0.45 to
0.53 and compared with percentiles. The minimum per cent deviation
of 5.4 was observed at WHTR of 0.48 (against 6.4% at WHTR 0.50) and
further the deviation at this point was distributed near-uniformly
(2.6% above and 2.8% below the WHTR), suggesting that this is the
optimum cut-off point for children in this region. ROC analysis
against percentiles has given a higher sensitivity of 0.630 at WHTR
0.48 in this region and area under ROC curve was 0.827 at WHTR 0.48.
Key words: BMI, Childhood, India, Obesity, Overweight.
|
|
Waist-circumference and more
precisely the
waist-to-height ratio (WHTR) are
superior to BMI in predicting the
cardiovascular risks in European and Asian children [1] and Japanese
adults [2]. WHTR is significantly associated with the risk factors for
obesity, much better than BMI [3,4]. Since the height and waist
circumference of children increases continually as they age, the value
of 0.50 was suggested as an appropriate cut-off point for all age groups
[5,6]. WHTR is more sensitive than waist circumference in different
populations since it adjusts to different statures [3] and because of
the negative correlation of height to certain metabolic risk factors
[7]. The WHTR cut-off point is population specific and for Chinese
population, WHTR 0.445 is optimum for overweight in both boys and girls.
For obesity, the cut-off points proposed are 0.485 for boys and 0.475
for girls [8]. The relevance of 0.50 as cut-off point for Indian
schoolchildren in Southern India is being revalidated here.
Methods
The study was carried out during 2004-2011 among
school-going children aged 7-12 years from Thrissur district of Kerala,
India. Multistage random sampling design was adopted with the total
schools in the district at the first stage. The total number of schools
were 1013 comprising of 263 government, 711 government-aided private and
39 unaided private schools. At the second stage, six thousand samples
were selected by proportionate random sampling to represent urban,
semi-urban and rural backgrounds, from a population size of 112,386
children. Height was measured with a stadiometer, and waist
circumference with a plastic tape, midway between the lower rib margin
and the iliac crest. Averages of three measurements, appropriated to the
nearest 0.1 cm, were recorded. Scatter plot for height vs waist
circumference was plotted using the statistical software Minitab v16 and
area of distribution was marked with a single smooth circle. To avoid
erroneous conclusions, samples leading to outlying values were excluded
from further analysis. The prevalence of overweight/obesity at every age
were computed using percentiles given by Cole, et al. [9], CDC
[10] and Khadilkar, et al. [11], waist circumference [1], WHTR of
0.50 given by McCarthy and Ashwell [5] and WHTR by Yan, et al.
[8] and the results were compared.
To verify at what WHTR cut-off value the study
population will show the minimum percentage deviation in the prevalence
of overweight/obesity from that computed using the percentiles Cole,
et al. [9], WHTR cut-off points from 0.45 to 0.53 were tested in the
population. Per cent deviation was recorded as the sum of the per cent
of children not overweight obesity by percentile method at the specific
WHTR and per cent of children overweight obesity by percentile method
below the specific WHTR. Since there was no overweight or obese child in
the sample who was recorded normal at 0.53 WHTR, and no
non-obese/overweight child in the population who was recorded overweight
obesity below 0.43, further extension of WHTR values was not necessary.
The WHTR that is in proximity with the results obtained by percentiles
was considered as optimum cut-off value for schoolchildren in this
region. The specificity and sensitivity of the newly identified and the
existing WHTR cut-off values against the BMI percentiles were compared
through ROC (Receiver Operating Characteristic) analysis using the
statistical software SPSS v17.
Results
Analysis with BMI percentiles yielded prevalence
rates of overweight/obesity of 3.17 and 6.67 for boys and girls (Web
Table I). Prevalence rates obtained through BMI percentiles and
WHTR 0.50 have been proximate and on par with the existing reports and
were hence chosen as the standard. Using 0.50 cut-off point, a countable
percentage of samples varied in overweight/obesity of prevalence. The
percentage of children not overweight/obesity of at or above 0.50 and
the percentage overweight/obesity of even below the WHTR 0.5 were 1.2
and 5.2, respectively. Thus a total of 6.4% of the population was not
obeying the WHTR 0.50 cut-off point. Per cent variation among both
methods by employing the cut-off points from 0.45 to 0.53 are furnished
in Web Fig. 1. It is evident that both the lines meet at
0.48 and at this point, minimum per cent of samples disobey the
percentiles (5.4 per cent against 6.4 per cent at WHTR 0.50). The best
equilibrium with respect to minimum deviations of 2.6 and 2.8 per cent
above and below this point was achieved against 1.2 and 5.2 at WHTR
0.50. The remarkable difference both in terms of the rate of prevalence
as well as the variation from the standard, it is proposed that a better
WHTR cut-off for children from this region is 0.48.
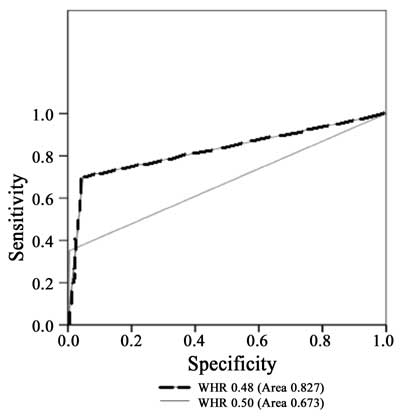
ROC curve area is a direct measure on the sensitivity
of the cut-off points assessed for a particular population. Using 0.48
cut-off, the area under the ROC curve was 0.827 against 0.673 at 0.50 (Fig.
1). WHTR 0.48 has given 407 true positive samples against 233 at
WHTR 0.50 and similarly, the sensitivity was 0.630 against 0.376 (Table
I). The false positives were remarkably less at WHTR 0.48 (115)
compared to WHTR 0.50 (289). The distinctly higher graph area and the
higher specificities against the BMI percentiles clearly show that 0.48
is more accurate.
 |
|
Fig. 1 Specificity and sensitivity
curves for Waist-to-height ratio cut-off values 0.50 and 0.48
against the BMI percentiles for estimating the prevalence of
overweight/obesity in a population of children aged 7-12 years.
|
TABLE I Specificity and Sensitivity of Waist-to-Height Ratio Cut-off Values 0.48 And 0.50 Against BMI Percentiles
|
Condition |
|
Waist-to-Height Ratio cut-off value |
|
|
0.48 |
0.50 |
|
|
True |
False |
Total |
True |
False |
Total |
|
Overweight/ obese as per BMI percentiles |
Positive |
407 |
115 |
522 |
233 |
289 |
522 |
|
Negative
|
5239 |
239 |
5478 |
5092 |
386 |
5478 |
|
Total |
|
5646 |
354 |
6000 |
5325 |
675 |
6000 |
|
Sensitivity |
|
0.630 |
|
|
|
0.376 |
|
|
Specificity |
|
0.978 |
|
|
|
0.946 |
|
Discussion
The overweight/obesity of rates worked out using
Cole, et al. [6] and CDC [10] percentiles and WHTR 0.50 were
comparable with the existing report from Kerala state [12]. Further, for
this population, 0.48 was a more accurate WHTR cut-off point than 0.5.
The very high prevalence rates from waist
circumference centiles was confirmatory to our previous report that this
methodology is not acceptable for population of Southern India and
alternative centiles as product of BMI and WHTR should be used [13]. The
available report on the prevalence of overweight/obesity in this state
suggests only 6.57% for boys and girls together [12]. From this study
that employed WHTR 0.50, it was clear that, from 6.57% in 2007, the
prevalence rose to 9.84% by 2011. But a growth from 6.57% in 2007 to
27.15% in 2011 may not be a true situation. This assumption is further
supported by another study in Indian children [14]. However, no effort
has so far been made to precisely define the WHTR cut-off for Indian
population. The lower cut-offs proposed from the study by Yan, et al.
[8] are specific for Chinese since comparatively short stature of this
population restricts the flexibility towards higher WHTR levels. The
health risks for Asians begin to increase for smaller amounts of central
fat and smaller waist circumferences than their European counterparts
[15]. This explains the reason behind the decrease in the WHTR cut-off
for this population. The population under study is shorter than the
British population in which WHTR 0.50 cut-off point was initially
proposed [7].
Further confirmation of the results may be obtained
by analyzing the correlation of WHTR cut-off with biochemical and
clinical parameters associated with pediatric obesity. Practicing
paediatricians may prefer WHTR 0.48 over 0.5 in deciding the obesity
status of children from southern India.
Funding: University Grants Commission, Government
of India.
Competing interests: None
|
What this Study Adds?
•
The Waist to Height Ratio (WHTR)
cut-off point is population-specific and for children from South
India, optimum WHTR cut-off point is 0.48
|
References
1. Savva SC, Tornaritis M, Savva ME, Kourides Y,
Panagi A, Silikiotou N, et al. Waist circumference and
waist-to-height ratio are better predictors of cardiovascular disease
risk factors in children than body mass index. Int J Obes Relat
Metab Disord. 2000;24:1453-8.
2. Hsieh SD, Yoshinaga H, Muto T. Waist-to-height
ratio, a simple and practical index for assessing central fat
distri-bution and metabolic risk in Japanese men and women. Int J Obes
Relat Metab Disord. 2003;27:610-16.
3. Cox BD, Whichelow MJ, Ashwell MA, Prevost AT.
Comparison of anthropometric indices as predictors of mortality in
British adults. Int J Obes Relat Metab Disord 1996; 20 (Suppl 4): 141.
4. Hsieh SD, Yoshinaga H, Muto T, Sakurai Y, Kosaka
K. Health risks among Japanese men with moderate body mass index. Int J
Obes Relat Metab Disord. 2000;24:358-62.
5. McCarthy HD, Ashwell M. Trends in waist-height
ratios in British children aged 11-16 over a two decade period. Proc
Nutr Soc. 2003; 62: 46A.
6. Ashwell M, Hsieh SD. Six reasons why the
waist-to-height ratio is a rapid and effective global indicator for
health risks of obesity and how its use could simplify the international
public health message on obesity. Int J Food Sci Nutr. 2005;56:303-7.
7. Henriksson KM, Lindblad U, Agren B, Nilsson-Ehle
P, Rastam L. Associations between body height, body composition and
cholesterol levels in middle-aged men. The coronary risk factor study in
southern Sweden. CRISS. Eur J Epidemiol. 2001; 17: 521-6.
8. Yan W, Bingxian H, Hua Y, Jianghong D, Jun C,
Dongliang G, Yujian Z, Ling L, Yanying G, Kaiti X, Xiaohai F, Da M.
Waist-to-height ratio is an accurate and easier index for evaluating
obesity in children and adolescents. Obesity. 2007;15:748-52.
9. Cole TJ, Bellizi MC, Flegal KM, Dietz WH.
Establishing a standard definition for child overweight and obesity
worldwide: An international survey. BMJ. 2000;320:1240-3.
10. Centers for Disease Control and Prevention.
Measuring childhood asthma prevalence before and after the 1997 redesign
of the National Health Interview Survey-United States. Morb Mort Wkly
Rep. 2000;49:908-11.
11. Khadilkar VV, Khadilkar AV, Cole TJ, Sayyad MG.
Cross-sectional growth curves for height, weight and body mass index for
affluent Indian children, 2007. Indian Pediatr. 2009;46:477-89.
12. Raj M, Sundaram KR, Paul M, Deepa AS,
Krishnakumar R. Obesity in Indian children: Time, trends and
relationship with hypertension. Natl Med J India. 2007;20: 288-93.
13. Panjikkaran ST, Kumari KS. Augmenting BMI and
waist height ratio for establishing more efficient obesity percentiles
among school going children. Indian J Com Med. 2009;34:135-9.
14. Kuriyan R, Thomas T, Lokesh DP, Sheth NR,
Mahendra A, Joy R, et al. Waist circumference and
waist-for-height percentiles in urban south Indian children aged 3-16
years. Indian Pediatr. 2011;48:765-71.
15. World Health Organization. Report of a WHO
Consultation on Appropriate BMI for Asian Populations and its
Implications for Policy and Intervention Strategies. WHO: Geneva; 2002.
|
|
|
 |
|
