 |
Original Articles Indian Pediatrics 2000;37: 489-495 |
||||||||||||||||||||||||||||||||||||||||||||||||||||||||||||
|
T-lymphocyte subpopulations in tuberculosis |
||||||||||||||||||||||||||||||||||||||||||||||||||||||||||||
|
Soumya Swaminathan,
Key words: Immune response, Lymphocyte subsets, T-cells, Tuberculosis. Because cell mediated immunity plays a central role in human defenses against mycobacteria, the manifestations and clinical outcome of human infection with Myco-bacterium tuberculosis are believed to depend on the efficacy of the cell mediated immune response. T-lymphocytes contribute to immu-nity against mycobacteria by recognizing foreign protein via antigen receptors and subsequently releasing immuno-regulatory cytokines. Protective immunity against tuber-culosis is believed to be mediated primarily by CD4+ T-cells, particularly Th1-cells that produce interferon-g (1,2). Children who lack the interferon-gamma receptor succumb to disseminated mycobacterial disease(3,4) and mice that do not express interferon-gamma because of gene disruption are exquisitely susceptible to tuberculosis(5). CD8+ cytotoxic T-cells and T-cells expressing the gdT cell receptor probably also contribute to protective immunity against tuberculosis(6,7). Prior studies of the distribution of T-cell populations in tuberculosis patients have evaluated adults(8-12). Because most adults were infected in the distant past, the distribution of T-cell subpopulations during the initial response to infection cannot be assessed. In addition, many adult tuberculosis patients have coexistent illnesses, e.g., diabetes or alcoholism which may affect T-cell subpopulations. The study of tuberculosis in children provides a unique opportunity to evaluate T-cell sub-populations during the initial immune response to infection with Mycobacterium tuberculosis. To investigate this question, we measured T-lymphocyte subpopulations in children with pulmonary tuberculosis and in age matched healthy tuberculin positive controls.
Patients: Children attending the Outpatient Department of the Institute of Social Pediatrics, Government Stanley Hospital, Chennai and the Institute of Child Health, Chennai were considered for this study which was conducted between July 1996 and February 1997. For children aged 1-12 years old who had signs and symptoms suggestive of tuberculosis (persistent fever, cough, failure to thrive or loss of weight), a Chest X-ray was performed and a Mantoux test with PPD-RT23 1 TU was placed and read after 48-72 hours. Gastric lavage was done on an empty stomach on 2 consecutive mornings and examined for AFB smear and culture for M. tuberculosis. All patients who were diagnosed to have tuberculosis during this period were eligible for the study. Tuberculosis was diagnosed in 39 children during this period of whom 22 were willing for participation (blood collection, follow up, etc.) and were enrolled in the study. The diagnosis was culture proven in 17 cases and was based on clinical and radiographic features in 5 cases (X-ray abnormalities persisting after 2 weeks of broad spectrum antibiotics, household exposure to tuberculosis and positive tuberculin skin test results). All patients were negative for HIV by ELISA. Patients were treated with standard short course anti-tuberculosis regimens (2 months of Isoniazid, Rifampicin, and Pyrazinamide daily followed by Isoniazid and Rifampicin for 4 months). After completion of therapy, blood samples were obtained from the eight children who were available for follow-up, all of whom had an excellent response to therapy. We selected 17 healthy tuberculin-positive children as controls including children attend-ing the hospital for minor complaints and siblings of the study patients who were found not to have tuberculosis. The controls selected were matched for socioeconomic strata and age group to the study patients. Venous blood was obtained from tuberculosis patients and controls in heparinized tubes and sent to the laboratory within 1 hour for analysis. Blood was obtained from patients after they had received less than one week of antituberculosis therapy. The study was approved by the Institutional Review Board of the Tuberculosis Research Center and informed consent was obtained from the parents of the study participants.
Estimation of T-Lymphocyte Subpopulations
Statistical Analysis
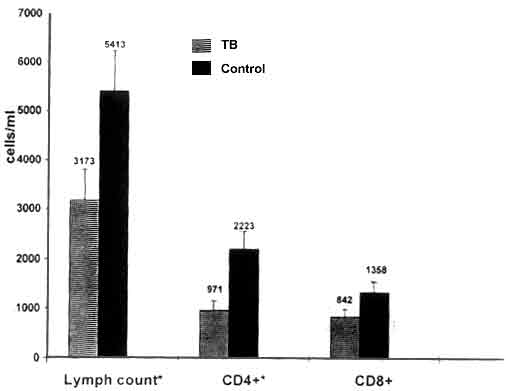
The mean age of the tuberculosis patients was 5.8 ± 3.0 (SD) years, the mean weight was 15.9 ± 1.4 kg and the mean tuberculin skin test size was 14.4 ± 6.6 mm. All 22 patients had pulmonary tuberculosis and one had dissemi-nated disease in addition. Ten patients were malnourished, defined as <75% of their predicted body weight for age. The mean age of the controls (healthy tuberculin reactors) was 7.1 ± 3.2 years (p = 0.2), the mean weight was 17.2 ± 1.3 kg (p = 0.5) and the mean tuberculin skin test reaction was 16.4 ± 5.9 mm (p = 0.2). Nine healthy tuberculin reactors were mal-nourished. The percentage of CD3 + and CD4+ T-cells was reduced in children with tuberculosis as compared to healthy tuberculin reactors (Table I). In contrast, the percentage of CD8+ cells was increased in tuberculosis patients and the percentages of gdT cells and the Vd1 and Vd2 subsets were similar in both groups. Fig. 1 shows the total lymphocyte count and absolute numbers of CD4+ and CD8+ T-cells in blood in patients and controls. Both the total lymphocyte count (3173 ± 610 vs 5413 ± 376 cells/cu mm, p = 0.006) and CD4+ T-cell count (971 ± 376 vs 2223 ± 333 cells/cu mm, p = 0.002) were significantly lower in tuberculosis patients as compared to controls. However, the absolute CD8+ counts were similar in the two groups of patients, even though the percentage of CD8+ cells was higher in tuberculosis patients. We wished to determine if the changes in the lymphocyte subsets was related to radio-graphic type and extent of disease or to nutritional status. The percentage of CD3+ and CD4+ T-cells was similar in children with minimal and extensive disease on Chest X-ray(13). On comparing the T-lymphocyte subsets in children with hilar/mediastinal lymphadenopathy alone with those who had more extensive parenchymal lesions or cavitation, we found no significant differences. However, the percentage of CD3+ cells was significantly lower in the 10 malnourished patients compared to the 12 patients who were not malnourished (Table II). The percentage of CD4+ cells was not significantly different between the two groups. When a comparison was made between malnourished tuberculin positive patients and malnourished controls, it was observed that both the CD3+ and CD4+ cell counts were significantly lower in tuber-culosis patients. There was no significant correlation between lymphocyte sub-popula-tions and nutritional status in healthy tuberculin reactors (data not shown). We measured the lymphocyte subsets at baseline and after completion of treatment in 8 tuberculosis patients. The percentage of CD3+ cells increased after therapy to levels comparable to those of healthy tuberculin reactors (60.4 ± 4.9 to 67 ± 3.3, NS), but the difference between values before and after treatment was not statistically significant, probably because of the small number of patients evaluated. The proportion of CD4+ T- cells also increased after chemotherapy (27.4 ± 3.7 to 34 ± 1.8, p = 0.04) and this difference was statistically significant. The percentages of CD8+ cells (25 ± 3.7 to 23.4 ± 1.8) and Pan TCR gdT cells (8.6 ± 1.9 to 6.8 ± 0.7) showed no significant change with therapy. Table I: T-Lymphocyte Subpopulations in Blood in Tuberculosis Patients and Healthy Controls
In adult tuberculosis patients, most investigators have found that the total numbers and percentages of CD3+ and CD4+ cells are reduced as compared to healthy controls(8-13). However, because many tuberculosis patients have co-existing illnesses, it is uncertain if the changes in lymphocyte distribution are a direct effect of tuberculosis. Evaluation of the immune response in children with tuberculosis is important because it permits evaluation of patients during the initial immune response to tuberculosis in the absence of other chronic diseases that may affect lymphocyte sub-populations. In our study, we selected children with tuberculosis and healthy tuberculin reactors from the same socioeconomic class and with similar nutritional status. Our findings demons-trate that in children with tuberculosis, the total numbers and percentages of CD3+ and CD4+ cells are reduced suggesting that this is directly related to tuberculosis. The reduction was more marked in patients who had associated malnutrition. Patients with both malnutrition and tuberculosis had the lowest CD3+ and CD4+ T-cell percentages compared to those with tuberculosis alone or malnutrition alone. Malnutrition could have been worsened by, and therefore, reflect the severity of tuberculous disease and would have a synergistic effect on suppression of the immune response(14). The total number of CD8+ T-cells was similar in the two groups. Even though the number of patients studied was small, our data suggest that the changes in CD3+ and CD4+ cells were reversible and resolved after anti-tuberculosis therapy. Studies in animals and humans indicate that CD4+ T-cells play a crucial role in protective immunity against tuberculosis. In animals, depletion of CD4+ cells markedly increases susceptibility to tuberculosis, and adoptive transfer of CD4+ cells confers protection against tuberculosis(15,16). In HIV-infected and HIV-negative persons with tuberculosis, extent of disease is greatest in those with depressed CD4+ cell counts(11,13). Tuber-culosis enhances apoptosis of peripheral blood T-cells(17) and provides a potential mechanism for reduction of CD3+ and CD4+ cell counts. Alternatively, the peripheral reduction in CD3+ and CD4+ T- cells may reflect recruitment of these cells to the site of disease, where these subpopulations are over represented(18,19). The mechanism by which tuberculosis reduces CD3+ and CD4+ cell numbers needs further investigation. In contrast to findings with CD4+ cells, we found no change in the percentages of gamma delta T-cells or their subsets in children with TB compared to healthy tuberculin reactors.The Vd2 subpopulation of gdT cells is believed to contribute toward immune defenses against mycobacteria during the initial immune response. These cells recognize certain non-peptide mycobacterial antigens that are not recognized by CD4+ cells(20). Studies of peripheral blood from adult tuberculosis patients have produced conflicting results. Some authors found normal or increased percentages of gdT cells while others found decreases in the percentage of Vd2 cells(21-25). These differences may reflect variations in the timing of tuberculosis infection or variability in disease extent in adults with tuberculosis. Our current results indicate that there are no changes in the percentages of gamma delta T-cells or their subpopulations in the peri-pheral blood of children during the initial immune response to tuberculosis. Further studies are needed to characterize the distribution of gamma delta T-cells at the site of disease. In summary, we found that the absolute numbers and percentages of CD3+ and CD4+ lymphocytes but not those of gamma delta T-cells were reduced in children with tuber-culosis. The reduction was most marked in children with associated malnutrition. These changes appeared to be reversible and we speculate that they may be due to cell recruit-ment at the site of disease or to enhanced apoptosis of T-cell subpopulations. Table II: Lymphocyte Subpopulations in Healthy and Malnourished Patients and Controls
This work was supported by the National Institutes of Health (AI 27285). We would like to thank the Directors of the Institute of Social Pediatrics, Government Stanley Hospital, Chennai and the Institute for Child Health, Egmore, Chennai for their cooperation. We would like to acknowledge the valuable secretarial assistance provided by Mr. T.M. Kasinathan.
Contributors:
SS was the principal investigator and was involved in both clinical and
laboratory aspects and also drafted the paper; KSN and LEH assisted with
the laboratory aspects and data management, NS and PRN participated in
designing the study and logistic support and PFB coordinated the study and
contributed to report writing.
|
![]()