|
Lubchenco, et al. [1]
were the first to
describe anthropometry at birth as centiles
for various gestations. These centiles, still
used widely in many centers, were based on data from live births
from an ethnically mixed group in Colorado. However, these charts
are not universally applicable because the growth potential of
the fetus is influenced by sex of the infant, ethnic group and
geographical factors.
India specific intrauterine growth curves were
constructed by many authors [2-5]. Changes in the parity, socioeconomic
and environmental conditions necessitate an update in the existing
growth charts. We planned the present study to derive a gestation
specific reference growth chart for our local population. The objective
was to construct centile charts for birthweight, length and head circumference
for infants born from 24 to 42 weeks of gestation.
Methods
This was a medical record review of the period from
July 1999 to October 2009 at a maternity and newborn level III care
hospital in South India. All consecutively live born singleton infants
from 24 to 42 weeks of gestational age during the study period were
eligible. The gestational age had been calculated in completed weeks
from the findings of the early dating ultrasound or from the last
menstrual period. Infants with major congenital anomalies and those with
uncertain gestational age were excluded. The weights had been measured
on a digital weighing machine with a variability of ± 10 grams. The head
circumference had been measured using a non- stretchable tape and
recorded in centimetres, and the length of the infant with an
infantometer in centimetres.
All the relevant risk factors [hypertensive diseases
of pregnancy, maternal medical disorders, severe anemia (Hb <7g/dL) in
the mother] were noted from the maternal and neonatal database and in
select cases, from the case records. The perinatal details were obtained
from the neonatal database.
The LMS method [6]
was applied for normalizing the raw data. The scatter
data plots and Z scores obtained from the LMS method were used to
identify the outliers. Observations lying beyond ±3 Z score were
deleted. The centiles (3rd, 5th, 10th, 25th, 50th, 75th, 90th, 95th, and
97th) for the birthweight, length and head circumference were calculated
using the LMS method which uses the Box-Cox power transformation to
obtain normally distributed data within each group.
Six sets of charts were constructed defined by the
sex of the infant for the birthweight, length and head circumference.
The normal distribution of the Z scores resulting from the
fitting of the LMS models within each group was verified by obtaining
normal probability plots (Q-Q plots). Centiles were calculated using the
LMS Chart Maker software and the other analyses was carried out using
SPSS, version 16.
Results
Thirty three thousand and seven hundred and forty
infants were born alive in the hospital during the study period. 787
infants were products of multiple pregnancies and in 28 infants
gestation was either less than 24 weeks or more than 42 weeks. From the
eligible 32,925 infants, gestation was not certain in 1444 infants.
Among the remaining 31,481, the data was available for 31,391 (males,
16,054), 28,812, (males, 14,730), and 28,790 (males, 14,724) infants for
the plotting of weight, length and head circumference centiles,
respectively. After removing the outliers, the data was available for
30,016, 27,228 and 26,974 infants for the final plotting of weight,
length and head circumference centiles, respectively (Table I).
Sixty percent of the pregnancies were booked in the hospital before 20
weeks of pregnancy and 40% of the infants were born to primiparous
mothers. The number of infants with birthweight less than 2500 grams
were 5,921 (19%) and those with birthweight less than 1500 g and 1000 g
were 1,023 (3.3%) and 282 (1%) infants, respectively. The incidence of
PIH was 6.5% (n=2060) and that of diabetes and severe anemia was
5.5% (n=1736) and 1% (n=313), respectively among the
mothers of infants included in the study.
TABLE I Infants at Each Gestational Age After Removing the Outliers
|
Ges |
Weight |
Length |
Head circum- |
|
tation |
(n= 30,016) |
(n= 27,228) |
ference (n=26,974)
|
|
(weeks) |
(M/F) |
(M/F) |
(M/F) |
|
24 |
15 (9/6) |
7 (4/3) |
7 (4/3) |
|
25 |
23 (9/14) |
9 (4/5) |
9 (4/5) |
|
26 |
68 (34/34) |
36 (20/16) |
35 (19/16) |
|
27 |
56 (31/25) |
37 (20/17) |
39 (21/18) |
|
28 |
132 (81/51) |
96 (60/36) |
90 (53/37) |
|
29 |
106 (57/49) |
79 (45/34) |
82 (45/37) |
|
30 |
159 (88/71) |
133 (74/59) |
131 (71/60) |
|
31 |
166 (78/88) |
136 (69/67) |
136 (65/71) |
|
32 |
302 (154/148) |
273 (138/135) |
265 (135/130) |
|
33 |
342 (181/161) |
308 (180/128) |
308 (180/128) |
|
34 |
508 (291/217) |
494 (278/216) |
491 (280/211) |
|
35 |
712 (387/325) |
662 (349/313) |
651 (335/316) |
|
36 |
1652 (897/755) |
1537 (807/730) |
1543 (813/730) |
|
37 |
4210 (2254/1956) |
3876 (2028/1848) |
3814 (1964/1850) |
|
38 |
8002 (4024/3978) |
7316 (3657/3659) |
7221 (3620/3601) |
|
39 |
6373 (3159/3214) |
5640 (2855/2785) |
5570 (2853/2717) |
|
40 |
6580 (3366/3214) |
6023 (3056/2967) |
6030 (3088/2942) |
|
41 |
574 (281/293) |
524 (264/260) |
509 (251/258) |
|
42 |
36 (17/19) |
42 (20/22) |
43 (21/22) |
|
M-male; F-female.
|
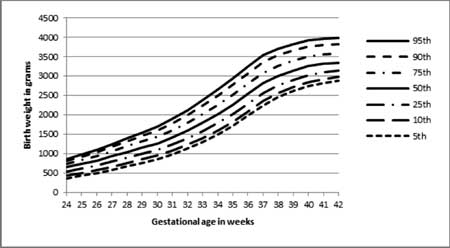
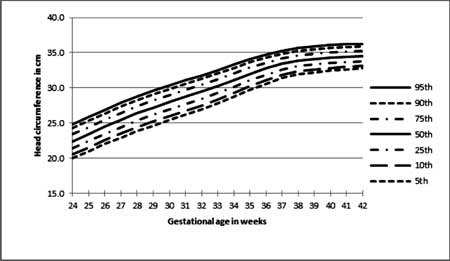
The Q-Q plot for z scores of birth weight, length and
head circumference displayed good correlation for the data between 5th
and 95th centiles. The crude curve for the raw data of male infants
displayed a bump in the 97th percentile from 30 to 32 weeks. The crude
curves of female infants were relatively smoother. Female infants were
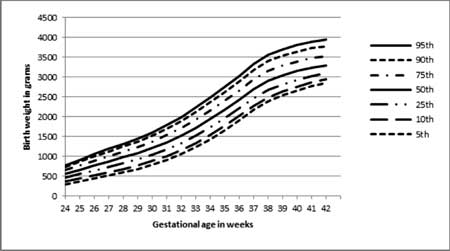
lighter than the male infants especially from 35 weeks onwards (Fig.
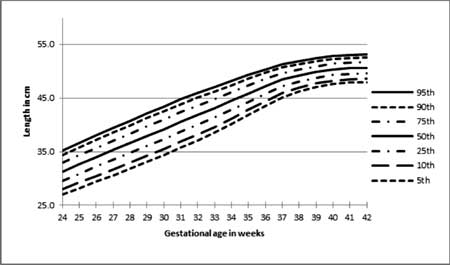
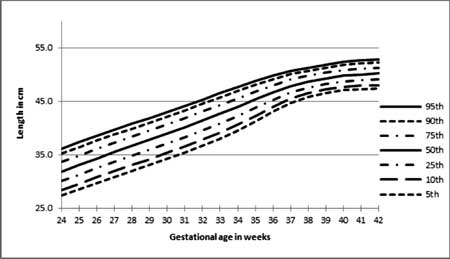
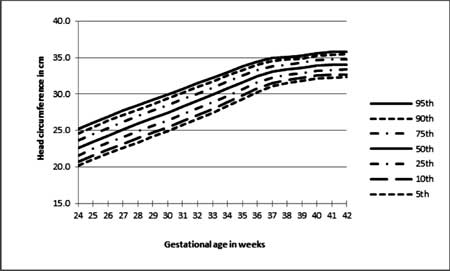
1). However, there was not much difference in the length and head
circumference (Fig. 2,3).
(a) |
(b) |
|
Fig. 1 Smoothened centile curves for the birthweight
of (a) male and (b) female infants (without outliers).
|
(a) |
(b) |
|
Fig. 2 Smoothened curves for length of
(a) male and (b) female infants (outliers removed).
|
(a) |
(b) |
|
Fig. 3 Smoothened curves for head
circumference of (a) male and (b) female infants (outliers
removed).
|
On superimposing our charts on the most widely used
Lubchenco intrauterine growth charts [1], for the 10th, 50th and 90th
centiles, our preterm babies (< 35 weeks) were lighter than Colorado
babies. For late preterm and term babies (≥35
weeks), the 90th centile birthweights were lower, the 50th centile birth
weights were similar and the 10th centile birth weights were higher.
Similar pattern was noted for both the sexes. However, length and head
circumference centiles were similar to that of Lubencho, et al.
for lower gestational ages (< 35weeks) and at term gestation, study
centiles were higher or similar.
On comparing the weight centiles with the Canadian
[7]
and Scottish [8] data, birthweights were lower across all
the gestations and centiles. Superimposition of study centiles of male
infants on the recently published North American centiles [9] revealed,
lower birthweights for the 50th and 90th centiles at term gestation and
similar birthweights for the 10th centile across all gestations.
However, the length and head circumference centiles were similar across
all gestations and centiles.
Discussion
The study presents the centiles, means, standard
deviations and smoothened curves of birth anthropometry in a large
cohort of neonates for weight, length and head circumference. It is the
first study from our country involving neonates from 24 to 42 weeks of
gestation. Another unique feature was the presence of significant number
of babies at lower gestations (<30 weeks). The study cohort was
stratified for sex unlike other Indian studies [2,3]. The study
population was representative of the population in this part of country
as evidenced by the similarity in the incidence of prematurity and
obstetric morbidities like multiple pregnancies, maternal hypertension
and maternal diabetes to the
large hospital based data from the country [10].
The study met most standards required to obtain an
ideal reference growth chart [11]. The data included singleton
babies born from a monoethnic group and most importantly the best method
for gestational age estimation (first trimester based ultrasound dating)
was used in more than 60% of the included infants as they were born of
pregnancies registered early in our hospital. Gestational assessment was
mandatory for our hospital records. The gold standard LMS method [6] was
used for estimating the centiles and for the smoothening of the centile
curves.
Most of the recent studies have shown a secular trend
of increasing birthweight at higher gestational ages. This is also
evident in our cohort. The mean birthweights after 34 weeks were higher
in our cohort compared to the previous studies [2-5]. At term
gestational age the mean birthweights were almost 100 to 200 grams
higher in our present cohort. However, at lower gestations, our birth
weights were similar or lower (Web Table I). This may be
attributed to improved survival of smaller babies at lower gestations
over the last two to three decades. Similar trends were observed for the
length at birth. There was a trend of increased length at higher
gestations. However, there was no change in head circumference centiles
across all gestations.
Most of the units in our country still use Lubchenco,
et.al. [1] charts for
classifying the infants at birth into small for gestation (SGA) and
large for gestation (LGA). However, our data in comparison with that of
Lubchenco, et al. suggest that the 10th and 90th centiles of our
babies are lower. This leads to overestimation of the incidence of SGA
and underestimation of LGA babies, the consequence being many AGA
infants labelled as SGA, and LGA infants being overlooked as they are
misclassified as appropriate for gestational age (AGA). On comparing
with the other international growth charts [7, 8], the birthweights of
our babies were lower across all the gestations and centiles. Population
specific and updated growth charts should be used for the appropriate
classification of infants into SGA or LGA or AGA.
Inspite of the best effort in calculating the
centiles using the large cohort and also best statistical methods, this
study still has few limitations. Gestational age estimation was not
ultrasound based in all the included infants. Anthropometric
measurements were done by different nurses and this may have contributed
to the inter-observer variability. We did not construct separate curves
for parity and maternal height. This is a single centre cross-sectional
study spanning 10 years. This growth data is from all the socioeconomic
strata and hence might not reflect the ideal potential for intrauterine
growth. An ideal chart should be multicentred and involve data from 2 to
5 years. Ideally, at each gestation, we would require 100 babies for
estimating all the centiles. Our data lacks this parameter at lower
gestations (less than 32 weeks). We did not include stillbirths in our
data for the ease of data collection, as it was retrospective.
Contributors: SM and GK designed the study. HK
collected the data. SM and SS monitored the data collection. HK and SM
analyzed data and wrote the manuscript with inputs from SS.
Funding: None; Competing interests: None
stated.
|
What is Already Known
• Multiple growth centiles are available for
weight, length and head circumference at birth.
What This
Study Adds?
• The updated sex-specific centile charts in
this study may be used as reference curves for various
gestational for the birthweight, length and head circumference,
in South Indian infants.
|
References
1. Lubchenco L, Hansman C, Dressler M, Boyd E.
Intrauterine growth as estimated from live born birth weight data at 24
to 42 weeks of gestation. Pediatrics. 1963;32:793-800.
2. Ghosh S, Bhargava SK, Madhavan S, Taskar AD,
Bhargava V, Nigam SK. Intrauterine growth of north Indian babies.
Pediatrics. 1971;47:826-32.
3. Singh M, Giri SK, Ramachandran K. Intrauterine
growth curves of live born single babies. Indian Pediatr.1974;11:475-9.
4. Mohan M, Shiv Prasad SR, Chellani HK, Kapani V.
Intrauterine growth curves in north Indian babies: weight, length, head
circumference and ponderal index. Indian Pediatr.1990;27:43-51.
5. Mathai M, Jacob S, Karthikeyan NG. Birthweight
standards for south Indian babies. Indian Pediatr.1996;33:203-9.
6. Cole TJ. Fitting smoothed centile curves to
reference data. J R Stat Soc. 1988;151:385-418.
7. Kramer MS, Platt RW, Wen SW, Joseph KS. A new and
improved population-based Canadian reference for birthweight for
gestational age. Pediatrics. 2001;108;e35.
8. Bonellie S, Chalmers J, Gray R, Greer I, Jarvis S,
Williams C. Centile charts for birthweight for gestational age for
Scottish singleton births. BMC Pregnancy and Childbirth. 2008;8:5.
9. Olsen IE, Groveman SA, Lawson ML, Clark RH, Zemel
BS. New intrauterine growth curves based on United States data.
Pediatrics. 2010;125;e214-24.
10. National Neonatology Forum. National Neonatal-Perinatal
Database (2002-03). Available from www.newbornwhocc. org/pdf/nnpd_report_2002-03.PDF.
Accessed on 1 March, 2011.
11. Bertino E, Milani S, Fabris C, Curtis MD. Neonatal anthropometric
charts: what are they and what are they not. Arch Dis Child Fetal
Neonatal Ed. 2007;92:F7-10.
|


