|
|
Research Papers Indian Pediatrics 2008; 45:191-198 |
||||||||||||||||||||||||||||||||||||||||||||||||||||||||||||||||||||||||||||||||||||||||||||||||||||||||||||||||||||||||||||||||||||||||||||||||||||||||||||||||||||||||||||||||||||||||||||||||||||||||||||||||||||||||||||||||||||||||||||||||||||||||||||||||||||||||||||||||||||||||||||||||||||||||||||
|
Growth and Sexual Maturation of Low Birth Weight Infants at Early Adolescence |
||||||||||||||||||||||||||||||||||||||||||||||||||||||||||||||||||||||||||||||||||||||||||||||||||||||||||||||||||||||||||||||||||||||||||||||||||||||||||||||||||||||||||||||||||||||||||||||||||||||||||||||||||||||||||||||||||||||||||||||||||||||||||||||||||||||||||||||||||||||||||||||||||||||||||||
|
Introduction Nearly one third of neonates born in India are low birth weight(1) and a large percentage of them are small for gestational age (SGA). Children born small for gestational age have a seven fold increased risk of growth failure(2) and their final height is said to contribute to 20% of the short adult population. A number of adult disorders such as central obesity, diabetes, hypertension, coronary heart disease may be programmed in early fetal life due to intrauterine growth retardation(3,4). There has been only one long term study of follow up of low birth weight (LBW) infants reported from India which was started in the late 60’s(5). There is paucity of data on growth patterns in SGA infants who were also preterm (PT), even in the Western literature(6,7). The cognitive development of the LBW children at 12 years of age has been described in our previous publications(8,9). This study is part of an ongoing longitudinal study of infants born in the late eighties with birthweight less than 2000 g. It describes the growth and sexual maturation of non-handicapped LBW children and its relationship with birthweight, intrauterine growth restriction and parental size, at the age of 12 years. Methods The cohort consisted of infants weighing less than 2000 g discharged from a neonatal special care unit during an 18 month period, between October 1987 to April 1989 and followed up prospectively till the age of 12 years. This cohort has been described in detail in our previous publications(8,9). The LBW infants were classified into AGA or SGA using the criteria of Singh, et al.(10). Full term neonates born in the same hospital during the same period with birth weight more than 2500g with a normal antenatal, natal and postnatal course were enrolled as controls. All neonatal risk factors were recorded. A detailed socio-demographic background of each child was obtained by the social worker by making a home visit. Children with major handicaps like cerebral palsy and mental retardation were omitted from this study at the end of the three year follow up. Assessment of growth: Weight was measured by an electronic scale with an accuracy of ± 10g (Atco). Standing and sitting height was measured to the nearest 0.5 cm by a wall-mounted stadiometer using the standard technique, described by Tanner(11). Head circumference was measured using a flexible tape measure. All anthropometric measurements were taken by trained medical staff. Z scores or SD scores were calculated for weight, height and head circumference using gender specific British standards(12). An x-ray of the left hand including the wrist was taken and bone age was determined in the LBW group, after taking parental consent. All x-rays were assessed by a single observer using TWII standards(13). Final height was predicted using the TWII (RUS) scores(13). Sexual maturity: Sexual maturity rating (SMR) was determined by using the Tanner’s score(14). Testicular volume was measured by using an orchidometer. Mothers were told to inform the date of menarche of the female subjects. Assessment of adiposity: BMI was calculated and categorized by Cole’s method(15). Waist circumference was measured by a flexible tape to the nearest 0.1cm midway between the lower costal margin and superior iliac crest in expiration. The reading was plotted using McCarthy’s centiles(16). Hip circumference was measured at the point of maximum protuberance. A waist/hip ratio greater than 0.9 was considered as obese(17). Waist/height ratio was determined. A ratio more than 0.5 was considered as obese(18). Socio-economic status was determined by using the revised Kuppuswamy Scale(19). Intelligence Quotient was determined by using the Weschler’s Intelligence Scale Revised (WISC-R). A quotient of ³85 was considered as normal(20). Height and weight of both parents was measured. Ethical permission was obtained from the hospital’s Ethics Committee and parental consent was obtained at the time of enrollment in the study. Statistical analysis: The statistical analysis was performed using SPSS version 10.0. Karl Pearson’s coefficient of correlation was used to identify the correlation between the two variables. Mean height, weight and head circumference in the study and the control group was compared using an unpaired t-test. Bone age, SMR, testicular volume in the three study groups was compared using chi-square test. A multiple linear regression analysis was performed on the study group to find out the predictors of height, weight and head circumference at 12 years. Results This is an ongoing prospective study and the cohort has been described in great details in our previous publications on cognitive development of these LBW children at 6 and 12 years(8,21). There were 180 children with birthweight less than 2000g, 78 females and 102 males. Of these, 147 (81.29%) were preterm and 33 (18.8%) were full term. There were 106 SGA children, of which 73 were preterm and 33 were full term. The cohort was essentially divided into four groups – preterm SGA, full term SGA, preterm AGA and full term AGA, which formed the control group. The mean birthweight, gestational age and birthweight Z scores are shown in Table I. The table also shows the socio economic status of the parents and the height and weight of parents. There was no difference in the socio economic status of the study and control group. TABLE I Birth Data of Infants, Height, Weight and Sociodemographic Data of Parents
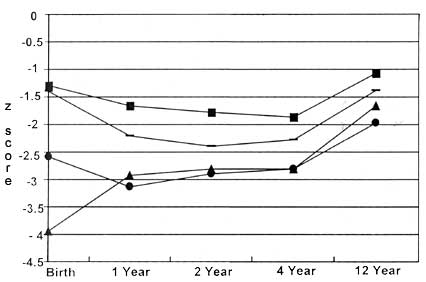
PTSGA- preterm small for gestational age; FTSGA- full term small for gestational age;
PTAGA- preterm appropriate for gestational age.
Growth and sexual maturity: Table II shows the comparison of anthropometry between the study group and controls. The preterm SGA males were lighter, shorter and had smaller heads. The preterm SGA females were shorter and had smaller heads, but heavier as far as weight was concerned. The full term SGA children had smaller heads but were otherwise comparable in height and weight with the controls. Amongst preterm AGA children, only males had smaller heads. The sitting and standing height was not disproportionate in any of the four groups. There was no difference in the sexual maturity in all the groups for both sexes (Table II) and no difference in the age of menarche in females. TABLE II Comparison of Growth Parameters and Sexual Maturity Between Each Study Group and Controls
*P<0.05; **P<0.01. † For females, the values indicate age at menarche in years (range). TABLE III Multiple Linear Regression Analysis
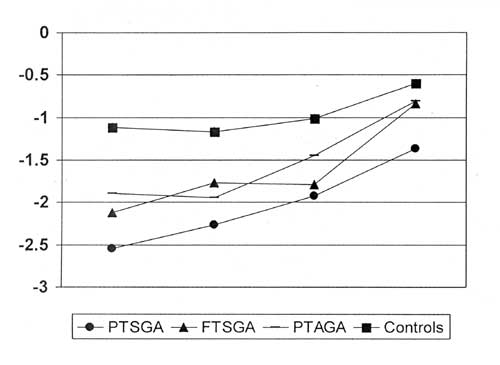
Although this particular assessment of growth was done at 12 years, all anthropometric measurements were available since birth, as this was a prospective study. The growth trajectory of the children at 1,2,4 and 12 years is shown in Fig.1 and Fig. 2. This graph shows that preterm SGA children are short throughout the 12 years, although some catch up occurs between 4 and 12 years. Birth lengths were not available for many of the children, hence not shown in the graph. As far as weight is concerned, the full term SGA children had the lowest birthweight Z score (–3.93), but showed catch up between 4 and 12 years.
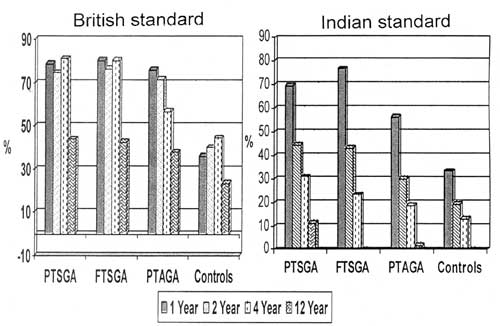
The number of children with height less than –2SD is shown in Fig. 3 and weight less than –2SD is shown in Fig. 4, using British standards, which we have been using since birth. Since the number of children below –2SD in height and weight appear large with British standards, we have also shown the same using Indian growth standards(22).
Parameters of adiposity: All four parameters of adiposity showed that none of our low birth weight children were in the obese range. Although all the children had a waist/height ratio below the cut off point of 0.5, the PTAGA children had the highest ratio among the three groups. Intelligence quotient: The mean IQ of the control group was 97.2 ± 11.2. The mean IQ of the PTSGA group was 85.4 ± 17.7, which was significantly less than that of the controls (P<0.001)(8). There was a correlation between head circumference and IQ (P<0.001, r=0.22). The PTSGA children, who had the smallest head circumference also, had the lowest IQ. The power of the study is 89%. Predictors of height, weight and head circumference: A multiple linear analysis was done with Z scores of height, weight and head circumference taken as the dependent variables. The independent variables were birth weight, gestational age, AGA/SGA status, neonatal risk factors, and duration of stay in the NSCU (a surrogate for the severity of the neonatal problems), socio economic status and parental height, weight and education. The results of the final model are shown in Table III. Discussion Our study showed that the preterm SGA children had much poorer growth than the preterm AGA children although the AGA children were born at a lower gestational age. Paz, et al.(23) have shown that children born SGA are at increased risk (Odds ratio 4.13 for boys and 3.32 for girls) for short stature in late adolescence. Not only were the PTSGA children shorter and lighter, but they also had smaller head circumferences. Since there was a correlation between head circumference and IQ(24), they also had the lowest IQ. According to Shann(25), the use of Z scores which are comparable across ages, provide a more sensitive assessment of deviations of growth than the use of percentiles or cut-offs of subnormal growth. The use of Z scores throughout the 12 year follow up has added more strength to our longitudinal study. We have also controlled for socio-economic status which adds more strength to our study, as reported by Strauss, et al.(26). Since Indian growth charts are made on full term infants starting with a birth weight of 2500 g, we had to use British growth charts. We also wanted to determine birth weight Z scores to categorize the intrauterine growth restriction. So, we used this novel method of showing the percentage of children falling below –2 S.D. at various ages using both British and Indian growth standards side by side. (Fig. 3 and 4). Bone age was similar to controls and not delayed in the PTSGA children indicating that further catch up growth will not occur at puberty. They had puberty at the same time as controls, inspite of the fact that they were much smaller at the beginning of sexual maturation. Martorell, et al.(27) found no difference in the bone ages of the full term SGA and control children. We are going to follow our cohort till the age of 18 years and it would be interesting to see if these predictions come true. Studies of growth of SGA infants are difficult to interpret because many of the earlier studies were not controlled for parental height. One of the major strengths of our study is that parental height and weight was available in every child. A multiple linear analysis showed that mother’s height and weight were important determinants of height and weight at 12 years. Hack, et al.(28) in their 20 year follow up of VLBW children have shown that 20 year height is predicted by mother’s height. There have been a spate of papers(3,4,29) on fetal origins of adult diseases like diabetes, hypertension and coronary heart disease. None of the children in our cohort were in the obese category. However, the PTAGA girls had the highest weight amongst all the females and the highest waist/height ratio, although below the 0.5 cut off point. This group will be closely scrutinized in our follow up study at 18 years. The waist/height ratio has been shown to be superior in its ability to predict cardiovascular disease risk factors compared to either BMI or percentage body fat(30,31). Contributors: SC conceived the study, supervised it, wrote the manuscript and is the guarantor of the paper. MO collected and analysed the data. MH made home visits, ensured appointments, AP supervised the project, AM did statistical analysis. All authors helped in writing the paper. Funding: ICMR, New Delhi. Competing interest: None stated.
| ||||||||||||||||||||||||||||||||||||||||||||||||||||||||||||||||||||||||||||||||||||||||||||||||||||||||||||||||||||||||||||||||||||||||||||||||||||||||||||||||||||||||||||||||||||||||||||||||||||||||||||||||||||||||||||||||||||||||||||||||||||||||||||||||||||||||||||||||||||||||||||||||||||||||||||
|
References | ||||||||||||||||||||||||||||||||||||||||||||||||||||||||||||||||||||||||||||||||||||||||||||||||||||||||||||||||||||||||||||||||||||||||||||||||||||||||||||||||||||||||||||||||||||||||||||||||||||||||||||||||||||||||||||||||||||||||||||||||||||||||||||||||||||||||||||||||||||||||||||||||||||||||||||
| ||||||||||||||||||||||||||||||||||||||||||||||||||||||||||||||||||||||||||||||||||||||||||||||||||||||||||||||||||||||||||||||||||||||||||||||||||||||||||||||||||||||||||||||||||||||||||||||||||||||||||||||||||||||||||||||||||||||||||||||||||||||||||||||||||||||||||||||||||||||||||||||||||||||||||||
![]()