|
|
Lead Article Indian Pediatrics 2007; 44:177-184 |
||||||||||||||||||||||||||||||||||||||||||||||||||||||||||||||||||||||||||||||||||||||||||||||||||||||||||
|
Low Birth Weight and Insulin Resistance in Mid and Late Childhood |
||||||||||||||||||||||||||||||||||||||||||||||||||||||||||||||||||||||||||||||||||||||||||||||||||||||||||
|
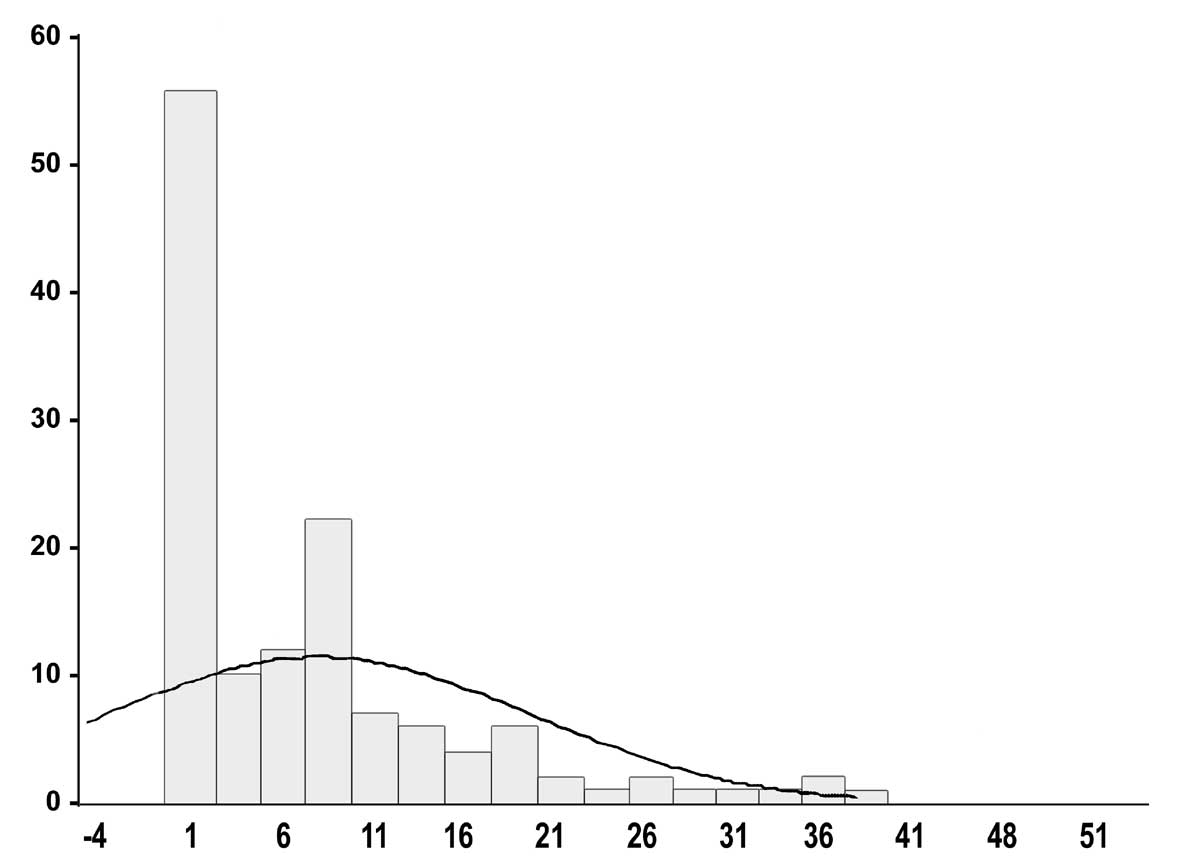
Low birth weight due to fetal undernutrition associated with rapid catch-up growth and gain in body weight during early childhood is associated with adult insulin resistance, diabetes and cardiovascular diseases(1-3). In many historical retrospective studies it was reported that low birth weight is associated with greater incidence of adult cardiovascular deaths(1,4). Subsequently, it has been reported that there is also greater incidence of peripheral insulin resistance, lower pancreatic beta-cell function, central obesity, multiple lipid abnormalities, and diabetes in these subjects(1,5,6). Six hypotheses have been proposed to explain the low birth weight and high adult metabolic diseases association. Neel(7) initially proposed a thrifty genotype hypothesis in 1960’s; Hales and Barker(8) developed a thrifty-phenotype hypothesis to explain the crucial role of environmental factors; McCance, et al.(9) proposed a surviving small-baby genotype hypothesis; Hattersley and Tooke(10) proposed a fetal-insulin hypothesis to explain the strong gene-environment interactions in insulin resistance; Dabelea, et al.(11) McKeigue(2) and Yajnik(12) have proposed a bimodal distribution hypothesis, combining environmental and genetic influences, to explain high insulin resistance in underweight as well as overweight newborns; and Gerstein(13) has proposed a gene-adaptation hypothesis that explains the high prevalence of insulin resistance in developing societies. A number of studies reported that in small-for-date children insulin resistance develops in adulthood(1,5,6,14-16). Only a few studies have been reported on birth weight association with insulin levels in early childhood. In neonates it has been reported that there is a U-shaped distribution of insulin resistance with low birth weight as well as high birth weight neonates having greater fasting insulin levels than normals(17). Yajnik, et al.(18) and Bavdekar, et al.(19) studied children at four and eight years of age and detected significant fasting hyperinsulinemia in low birth weight babies four and eight years old. Similar results have been reported in studies from Britain, Scandinavia and North America(1,2). Growth velocity for height, weight and other measures of adiposity from 4 to 8 years was a strong predictor of insulin resistance and cardiovascular risk factors than the measurements at eight years of age. Among Pima Indians in USA(11) it has been reported that low birthweight babies who continue to remain thin at adolescence do not develop insulin resistance and adult insulin resistance develops when there is a significant weight gain in these children. Singhal and Lucas(20) have proposed that exposure to nutrient excess in low birthweight babies is more important for adult cardiovascular diseases in persons with intrauterine growth retardation. To determine the importance of birth weight on fasting insulin levels and insulin resistance we studied school children aged 5-15 years in northwest India. Subjects and Methods The study was approved by the medical college institutional research review board. Children whose birth weight records were available were successively enrolled from six middle and low socioeconomic status urban schools in western India after obtaining written permission from respective school principals. Children at these schools were typically born at government hospitals in the region and data on birthweight were obtained from discharge records available with the parents. Measurements of these hospitals are usually reliable although no validation is possible. 600 children aged 5-15 years were screened for identifying students whose recorded birth weight in six schools in the city. Sample size was determined using the World Health Organization cardiovascular survey methods monograph(21) and the present study sample was considered adequate when the data are either normally distributed (in case of anthropometric variables and glucose) or not normally distributed as the insulin levels. For example required sample size for giving an 85% chance of recognizing a pre-specified 10% difference in mean values between two populations, significant at 5% level using a two-tailed test, would be 25 subjects.21 Inclusion criteria were normally delivered children, full-term (38-42 weeks) gestation, and not presently suffering from any major illness. Children who had severe malnutrition, recent acute febrile illness or known chronic disease of liver, kidney, lungs etc. were excluded. We could identify 158 children (26.3%) who had written birth records available and fulfilled other criteria. Informed consent was sought and obtained from parents of 134 (84.8%) children. These children were evaluated for various demographic, anthropometric and biochemical indices. Detailed anthropometry (height, weight, body-mass index (BMI), waist, hip, waist-hip ratio (WHR), mid upper arm circumference, and blood pressure) was performed according to the World Health Organization Guidelines(22) by a trained pediatrician. A 6-hour fasting blood sample (5 mL) was obtained for determination of hemoglobin, glucose and insulin levels using previously reported methods(17). Glucose was estimated by glucose-oxidase peroxidase method using a commercially available kit. Serum insulin was estimated by immunoradiometric assay using commercial kits. The intra- and inter-assay coefficients of variation for the insulin were 5.2 and 7.3% respectively, sensitivity was 1.2 µU/mL and specificity 80%(16). Insulin resistance was determined using homeostasis model assessment (HOMA) using the HOMA-2 formula(23). For calculation of HOMA glucose values were converted to mmol/L and insulin levels to ng/mL. Blood lipid estimations were not performed. Statistical analysis: All data were digitized and analyses performed using SPSS V.10.0 statistical package (SPSS Inc., Chicago, USA). Numerical values are reported as mean ± 1 SD. Significance of inter-group comparisons were evaluated using analysis of variance (ANOVA) for variables normally distributed. Levels of insulin and HOMA derived insulin resistance had skewed distribution (Fig. 1) hence median levels and interquartile ranges are reported. Significance of inter-group difference was determined using the non-parametric Mann-Whitney test. Spearman’s non-parametric correlation coefficients for insulin levels with various anthropometric and biochemical parameters were calculated. For estimation of multiple correlations, partial correlation coefficients were determined for adjusting influence of various demographic and anthropometric variables (age, gender, weight, BMI, waist, WHR and mid upper arm circumference) on birthweight-insulin correlation. To determine independent odds of correlation of birthweight with insulin resistance we performed a conditional multivariate logistic regression analysis. Dependent variable was dichotomized fasting insulin and independent variables successively added to the equation were age, gender, BMI, waist and WHR as continuous variables. P values <0.05 were considered significant.
Results The mean age of the children was 10.0 ± 2.4 years. There were 81 boys (60.4%) and 53 girls (39.5%). Maternal diabetes was present in 3 (2.2%). Mean weight at birth was 2.84 ± 0.61 kg and low birth weight (<2.5 kg) was observed in 49 children (36.6%) and 85 children (63.4%) were born with normal weight (2.5-4.5 kg). There were no children with birth weight more than 4.5 kg in the study cohort. Among the low birthweight children there were 32 (65.3%) boys and 17 (34.6%) girls while in normal birthweight group there were 49 boys (57.6%) and 36 girls (42.3%) (c2 test, P = 0.59). There was no significant difference in height, weight, body mass index, waist, hip, waist-hip ratio, mid upper arm circumference, and systolic and diastolic blood pressure in children born with low or normal birth weight (P >0.10) (Table I). Table I Demographic, Anthropometric and Bio-chemical Features in the Study Groups
Values are in mean ± 1 SD; BP blood pressure. In low birthweight as compared to normal birthweight children mean fasting blood glucose (80.1 ± 16.1 vs. 70.1 ± 14.8 mg/dL; P = 0.042) was significantly greater. Mean fasting insulin levels (14.15 +15.70 vs. 4.56 + 6.11 µU/mL) as well as HOMA derived insulin resistance (3.10 + 3.86 vs. 0.96 + 1.39 units) were also significantly greater in low birthweight children (ANOVA test, P <0.0001) (Table II). The median fasting insulin levels in low birthweight children (10.18 µU/mL, 25th-75th interquartile range (IQR) 6.08-18.54) were also significantly greater than in normal birthweight (2.12 U/mL, IQR 0.02-7.45) (Mann-Whitney U test, P <0.0001). In low birthweight children median HOMA derived insulin resistance (1.88 units, IQR 1.06-4.52 vs. 0.35 units, IQR 0.02-1.52, P <0.0001) was also significantly greater. Table II Insulin Levels and Insulin Resistance Parameters in the Two Groups
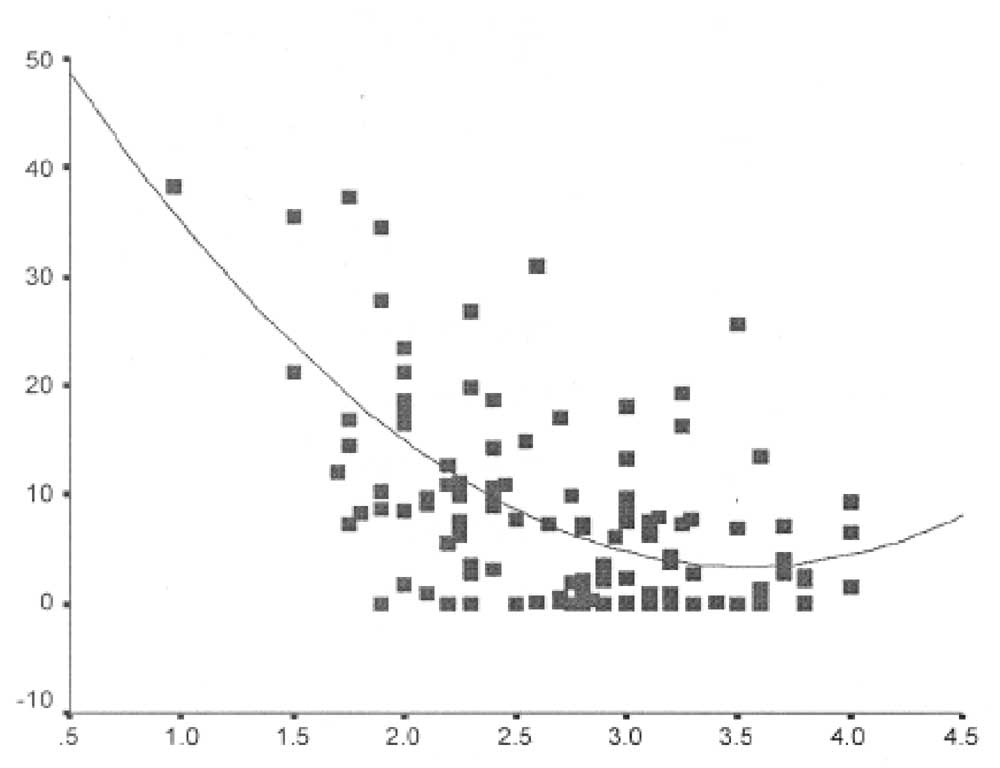
Values are in mean ± 1 SD; CI confidence intervals, HOMA homeostasis model assessment. Spearman’s correlation coefficients of fasting insulin levels with various anthropological variables showed that there was a significant univariate inverse correlation with birth weight (–0.47), and current waist (–0.16), hip (–0.21), WHR (–0.21), height (–0.17), and mid upper arm circumference (-0.18), and positive correlation with growth rate (0.19) and fasting glucose (0.45) (P <0.05). Univariate regression analysis showed that birthweight correlated significantly with fasting insulin (linear regression multiple R = 0.43, R2 = 0.18, P <0.0001; exponential regression multiple R2 = 0.38, R2 = 0.14, P <0.0001) (Fig. 2). Multivariate partial correlation analysis revealed that age and gender-adjusted correlation of fasting insulin with birth weight was significant (R = 0.46, <0.001). This significance was retained after adding all the significant anthropometric variables in the equation (R = 0.44, p = 0.001). To determine independent influence of birth weight on fasting insulin levels at childhood we performed a multivariate conditional logistic regression analysis (Table III). This showed that birthweight was significant determinant of fasting insulin levels before (odds ratio 4.86, 95% confidence intervals (CI) 2.43-9.60, P <0.001) and after adjusting for age, gender, body mass index, waist and waist hip ratio (odds ratio 3.82, 95% CI 1.16-12.63, P = 0.028).
Table III
Stepwise Conditional Logistic Regression Analysis For Identifying Influence Of Multiple Demographic And Anthropometric
Covariates on Fasting Insulin Levels (Dependent Variable).
waist + waist-hip ratio
Discussion This study shows that children with low birth weights have significantly greater fasting glucose, insulin levels and insulin resistance at mid and late childhood. This is observed in children who are born small and then achieve weight similar to those born with normal weight. The study limitations include small sample size. However, the sample size has been calculated using the recent World Health Organization manual for cardiovascular epidemiological studies(21). Other limitations include cross-sectional nature of the study and retrospective design using available hospital records instead of prospective cohort study. However, many of the earlier studies, including the famous British studies(1) have used a similar historical retrospective design(1,2). Yajnik, et al.(18) examined 379 children aged
4 years for insulin levels and insulin resistance in western India. They
reported that 30 min post glucose insulin and glucose levels inversely
correlated with birthweight. Bavdeker, et al.(19) reported
glucose and insulin levels in 8-year-old children from the same cohort.
An inverse correlation of adjusted current weight and birth weight was
noted with fasting and post glucose insulin levels, pro-insulin levels
and HOMA derived insulin resistance. The greatest insulin resistance was
observed in those with low birth weight and high current weight, i.e.,
children with abnormal weight gain. The results of the present study are
similar to these reports by Yajnik et al and Bavdekar et al. Dabelea,
et al.(11) investigated mechanisms underlying the association
between birth weight and type 2 diabetes in a population based cohort of
3061 Pima Indians aged 5-29 years. Birth weight was positively related
to current weight and height (P <0.0001). The 2-hour glucose
concentrations showed a U-shaped relationship with birth weight in
subjects >10 years of age and this relationship was independent of
current body size. In 2272 non-diabetic subjects fasting insulin
concentrations and HOMA-derived insulin resistance were negatively
correlated with birth weight. In the present study none of the children
had diabetes and there were no children with very high birth weight
(>4.5 kg) as in the Pima Indian study therefore there was no U-shaped
relationship of fasting insulin at adolescence with birth weight
although there is some flattening at terminal end of the exponential
regression line (Fig. 2). In a previous study of 7-day-old
neonates we reported that there was indeed a U-shaped relationship of
birth weight with fasting and 2 hour insulin, fasting glucose, and HOMA
insulin resistance similar to Pima Indians. Our study results are also
similar to the non-diabetic cohort of the Pima Indian study that shows a
negative correlation of birth weight with fasting insulin levels in all
age groups from 5 to 29 years. Forsen, et al.(24) studied the relationship of type 2 diabetes with size at birth and childhood growth in a cohort of 3639 men and 3447 women born between 1924 and 1933 in Sweden. The cumulative incidence of type-2 diabetes was 7.9% in men and 5.4% in women. The incidence increased with decreasing birth weight, birth length, ponderal index and placental weight. The odds ratio or type 2 diabetes was 1.38 (95% CI 1.15 to 1.66; P <0.001) for each 1 kg decrease in birth weight. The mean weights and heights of children at 7 years of age who later developed type-2 diabetes were about average. Thereafter, their growth in weight and height was accelerated until 15 years of age. The odds ratio for development of type 2 diabetes was 1.39 (CI 1.21 to 1.61, P <0.001) for each standard deviation increase in weight between 7 and 15 years of age. The odds ratio became 1.83 (CI 1.37 to 2.45, P <0.001) in an analysis restricted to persons whose birth weights were below 3.0 kg. In the present study odds of having high insulin levels in children having birthweight <2.5 kg are 4.86 (CI 2.43-9.60) on univariate analysis and at multivariate adjustment are 2.82 (CI 1.16-12.63) (Table III). Although the fasting insulin levels in childhood correlated with growth velocity it was lost on multivariate adjustments and larger prospective studies are needed to clarify this association. Bhargava, et al. from New Delhi, India(25) evaluated glucose intolerance and plasma insulin concentrations in 1491 men and women aged 26 to 32 years who had been measured at birth and at intervals of three to six months throughout infancy childhood, and adolescence in a prospective population based study. Impaired glucose tolerance was present in 10.8% and diabetes in 4.4%. Subjects with impaired glucose tolerance and diabetes had a low body mass index till two years, followed by an early adiposity rebound and accelerated increase in body mass index upto adulthood. However, despite as increase in weight between the ages of 2 to 12 years none of these subjects were obese at the age of 12 years. These findings are similar to the present study where we report that despite no obesity in small-born children there is a greater insulin resistance at adolescence. Diamond has reviewed the prevalence of type-2 diabetes in populations around the world(26). It was noted that the epidemic of type-2 diabetes in exploding in most populations but not in European Caucasians. Genetic and evolutionary consequences of geographical differences in food history have been implicated. The high prevalence of type-2 diabetes in certain groups such as Native Americans, Hispanic Americans, Asian and Pacific Islanders, and South Asians which are large, ancient, well mixed populations rules out explanations in terms of the founder effect or genetic drift and could be due to some compensating advantage that offsets the obvious morbidity and mortality. The principle evolutionary theory for the possible benefits of genes predisposing to type-2 diabetes is Neel’s thrifty gene hypothesis(7). More obvious explanation is the epidemic of adverse lifestyles among worldwide non-Caucasian populations(27). Yajnik(12) has proposed an Indian thin-fat body composition associated with the insulin resistance syndrome. The present study shows that under-weight newborns who achieve weight similar to children born normal have greater fasting insulin levels and HOMA-derived insulin resistance. Although we have not measured total body fat of these children but the findings are consonant with the thin-fat Indian children hypothesis. Indeed, Singhal, et al.(28) have reported that thin children who grow to become fat at adolescence accumulate more fat than muscle leading to insulin resistance. Larger prospective studies are needed to confirm these observations, especially when there has been a criticism of Barker’s hypothesis as a statistical artifact(29). Contribuors: RG reviewed and analysed data and drafted the manuscript. VK helped in analyzing the blood sample and lab results. RB & AP were involved in collecting data and blood sample and MG was involved in the revising the article critically and reviewed final draft of the article. Competing interests: None. Funding: Nil.
| References
|
|
![]()