|
|
|
Indian Pediatr 2012;49: 475-477
|
 |
Prevalence of Obesity and Overweight in Urban
School Children in Kerala, India
|
|
Alice T Cherian, Sarah S Cherian and Sobhana Subbiah
From Department of Pediatics, Lakeshore Hospital,
Kochi, Kerala, India.
Correspondence to: Dr Alice T Cherian, Head,
Department of Pediatrics, Lakeshore Hospital, Nettoor, Kochi, Kerala,
India. Email: [email protected]
Received: December 20, 2011;
Initial review: December 28, 2011;
Accepted: December 31, 2011.
|
|
Abstract
The objective of this study was to examine the
prevalence of obesity and overweight in urban school children in
Kochi, Kerala, South India. Three schools from the city were
selected representing upper, middle and lower socioeconomic groups
and the children aged 6-15 years of age were interviewed. The
prevalence of obesity was 3.0% for boys and 5.3% for girls. The
prevalence of obesity (7.5%) and overweight (21.9%) were highest
among high income group and lowest (1.5% and 2.5%) among low income
group. Prevalence of obesity and overweight was found to be higher
in the high income group and among girls.
Key words: Obesity, Overweight.
|
|
Childhood obesity is a problem
that has reached epidemic proportions in the developed world[1-3].
Obesity and overweight among children have significant long term health
consequences such as adult obesity, higher levels of cholesterol, higher
future incidence of coronary artery disease. [4-9]. In India, the
emergence of childhood obesity presents a cause for concern because of
recent changes in lifestyle and economic development [10,11]. Nationally
representative data on this subject from India is lacking [10,11].
The objective of this study was to examine the
prevalence of obesity and overweight among urban school children among
different socio-economic status.
Methods
The sample population was selected from three
different schools in the city of Kochi, Kerala in South India. Schools
A, B, and C represent the upper, middle and lower groups, respectively.
A total of 1634 children were included from all three schools, with 265
boys and 263 girls from School A, 326 boys and 262 girls from School B,
and 265 boys and 253 girls from School C. The ages ranged from 6 to 15
years and they were studying in grades I to X. Data were collected on
regular working days during the school year 2009-10. The data collection
team had a medical student, post- graduate student, and a nurse. The
height and weight of the students were measured, and they were
interviewed by team members regarding parental occupation. The data were
collected from all the three schools in the same manner using the same
equipment. BMI was calculated for each child according to WHO approved
CDC age-specific BMI charts, and the data was analyzed using appropriate
statistical methods [12, 13].
Results
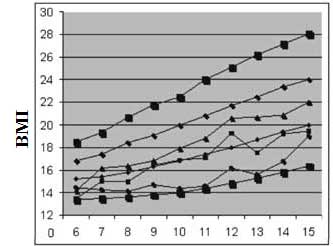
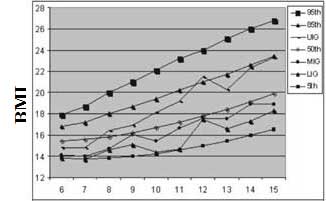
The body mass index (BMI) curves for boys and girls
according to age are given in Fig. 1. The average
age-specific BMI for boys of upper income group (UIG) was greatest and
the lower income group (LIG) had the lowest average age-specific BMI.
Similar to boys, the average age-specific BMI for girls was highest
among UIG girls and lowest in the LIG girls. When compared with the CDC
standard chart, the average age-specific BMI for UIG girls was greater
than the 50 th percentile and
even reached above 85th
percentile for girls over 11 years of age. The average age-specific BMI
of girls of middle income group (MIG) was lower than the 50th
percentile of CDC charts among girls under 10 years of age. However,
girls above 11 years of age in MIG were comparable with the 50th
percentile.

(a) |

(b) |
|
UIG: Upper income group; MIG: Middle income
group; LIG: Lower income group; percentiles are as per CDC
growth chart 2000.
Fig.1 BMI for (a) boys and (b) girls of different
socioeconomic status.
|
Of the total of 856 boys, 3% were obese and 10.2%
were overweight. Of the total of 778 girls, 5.3% were obese and 12.1%
were overweight, which was statistically significant when compared to
boys (P=0.028). Prevalence of obesity and overweight among UIG,
MIG and LIG boys was 5% and 16%, 3% and 12%, and 1% and 2%, respectively
(P<0.005). Prevalence of obesity and overweight among girls of
the UIG, MIG and LIG socioeconomic groups was 10% and 28%, 4% and 5%,
and 2% and 3%, respectively (P<0.005).
In this study, there was no age related trend seen in
the percentages of obesity or overweight among boys, but in girls,
overweight increased with age. The percentage of obese and overweight
girls are consistently higher along all age groups than boys in the same
age group. When comparing socioeconomic groups, obesity and overweight
were more prevalent in UIG girls than UIG boys, while there was not much
gender difference in the MIG and LIG.
The prevalence of overweight and obesity in the UIG
in this study is comparable to levels of overweight and obesity in
developed countries [3,4]. However, overweight and obesity are much
lower in the lower socioeconomic groups as compared to developed
countries [4]. Among American children, higher rates of obesity and
overweight have been found to have some association with lower
socioeconomic status [3]. In India, recent economic advancements have
created easy access to calorie-rich foods, especially for the higher
socioeconomic groups. This coupled with a lack of awareness in parents
about childhood obesity and nutritive diets may be part of the reason
behind this trend.
India, apart from its vast population, is a country
of great cultural and ethnic variety. Food habits differ significantly
in various parts of the country. Education, awareness and attitudes
among parents, and gender discrimination all play a role in influencing
the nutrition of children. Large- scale surveys will be needed to create
standards of growth that are representative of Indian children. Further
research is needed to determine the extent of obesity and overweight in
Indian children and to identify the reasons for the same.
Acknowledgment: Mr AR Rakesh for the computer
data management and Ms KS Jabeena for assisting in data-collection.
Contributors: All authors contributed to data
acquisition and drafting the paper.
Funding: None; Competing interests: None
stated.
|
What This Study Adds?
• Obesity and overweight in urban school
children of Kerala did not show any age-related trend.
Prevalence of obesity was 3% for boys and 5.3% for girls.
|
References
1. Black MM, Hazer ER, Le K, Anliker J, Arteaga SS,
Diclemente C, et al. Challenge! Health promotion/obesity
prevention mentorship model among urban, black adolescents. Pediatrics.
2010;126:280-8.
2. Ogden CL, Troiano RP, Kuczmarski RJ, Briefel RR,
Flegal KM, Johnson CL. Prevalence of overweight among preschool in the
United States, 1971 through 1994. Pediatrics. 1997;99:E1.
3. Troiano RP, Flegal KM. Overweight children and
adolescents: description, epidemiology, and demographics. Pediatrics.
1998;101:497-504.
4. Must A. Morbidity and mortality associated with
elevated body weight in children and adolescents. Am J Clin Nutr.
1996;63:445s-7s.
5. Raj M, Kumar RK. Obesity in children and
adolescents. Indian J Med Res. 2010;132:598-607.
6. Guo SS, Roche AF, Chumlea WC, Gardner JD,
Slervogel RM. The predictive value of childhood body mass index values
for overweight at age 35 y. Am J Clin Nutr. 1994;59:810-9.
7. Di Pietro L, Mossberg HO, Stunkard AJ. A 40 year
history of overweight children in Stockholm: lifetime overweight,
morbidity and mortality. Int J Obes. 1994;18: 585-92.
8. Qazi IA, Charoo BA, Sheikh MA. Childhood obesity.
Indian J Endocr Metab. 2010;14:19-25.
9. WHO Consultation on Obesity. Obesity: Preventing
and Managing the Global Epidemic: report of a WHO consultation. Geneva,
WHO 1999. WHO technical report series; 894.
10. Chhatwal J, Verma M, Riar S. Obesity among
pre-adolescents and adolescents of a developing country (India). Asia
Pac J Clin Nutr. 2004;13:231-5.
11. Goyal RK, Shah VN, Saboo BD. Prevalence of
overweight and obesity in Indian adolescent school going children: Its
relationship with socioeconomic status and associated lifestyle factors.
JAPI. 2010;58:151-8.
12. Centers for Disease and Prevention. 2000 CDC
growth charts: United States. Available at: www.cdc.gov/growthcharts.
13. Bowers D. Medical Statistics from Scratch. 2nd Ed. West Sussex,
England: John Wiley & Sons Ltd; 2008.
|
|
|
 |
|

