|
|
Original Article Indian Pediatrics 2005; 42:527-538 |
||||||||||||||||||||||||||||||||||||||||||||||||||||||||||||||||||||||||||||||||||||||||||||||||||||||||||||||||||||||||||||||||||||||||||||||||||||||||||||||||||||||||||||||||||||||||||||||||||||||||||||||||||||||||||||||||||||||||||||||||||||||||||||||||||||||||||||||||||||||||||||||||||||||||||||||||||||||||||||||||||||||||||||||||||||||||||||||||||||||||||||||||||||||||||||||||||||||||||||||||||||||||||||||||||||||||||||||||||||||||||||||||||||||||||||||||||||||||||||||||||||||||||||||||||||||||||||||||||||||||||||||||||||||||||||||||||||||||||||||||||||||||||||||||||||||||||||||||||||||||||||||||||||||||||||||||||||||||||||||||||||||||||||||||||||||||||||||||||||||||||||
|
Truncal Adiposity is Present at Birth and in Early Childhood in South Indian Children |
||||||||||||||||||||||||||||||||||||||||||||||||||||||||||||||||||||||||||||||||||||||||||||||||||||||||||||||||||||||||||||||||||||||||||||||||||||||||||||||||||||||||||||||||||||||||||||||||||||||||||||||||||||||||||||||||||||||||||||||||||||||||||||||||||||||||||||||||||||||||||||||||||||||||||||||||||||||||||||||||||||||||||||||||||||||||||||||||||||||||||||||||||||||||||||||||||||||||||||||||||||||||||||||||||||||||||||||||||||||||||||||||||||||||||||||||||||||||||||||||||||||||||||||||||||||||||||||||||||||||||||||||||||||||||||||||||||||||||||||||||||||||||||||||||||||||||||||||||||||||||||||||||||||||||||||||||||||||||||||||||||||||||||||||||||||||||||||||||||||||||||
|
From the C.S.I. Holdsworth Memorial Hospital, Mysore and *MRC, Environmental Epidemiology Unit, University of Southampton, England. Correspondence to: Dr. Krishnaveni G.V., Post Box No. 38, C.S.I. Holdsworth Memorial Hospital, Mandi Mohalla, Mysore 570 021, India. E-mail: [email protected] Manuscript received: September 27, 2004, Initial
review completed: November 29, 2004,
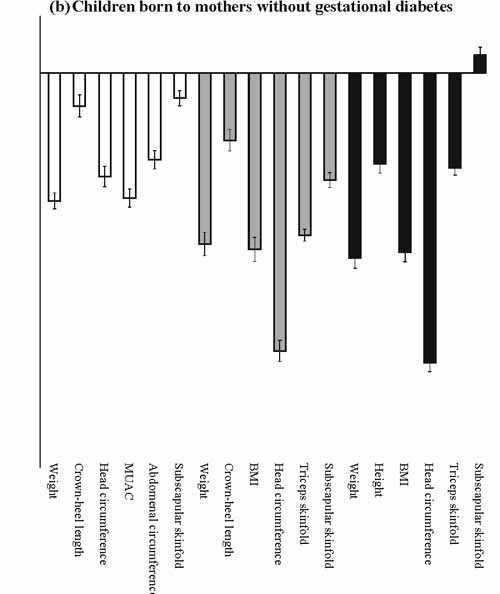
The prevalence of type 2 diabetes is rising throughout the world, most rapidly in populations like India which are undergoing the epidemiologic transition from a mainly rural subsistence economy to an increasingly urban industrial economy(1,2). Obesity, which induces insulin resistance, is a major risk factor for type 2 diabetes. People of Indian origin have a characteristic adult body phenotype: A relatively low body mass index (BMI), but increased total, subcutaneous and central (truncal and abdominal) body fat(3-6). They tend to be insulin resistant compared with other populations, and have high rates of the insulin resistance syndrome and type 2 diabetes(3). Increased truncal adiposity at birth has been reported in both urban and rural Indian babies in Pune(7,8). Compared with UK white Caucasian babies, they were lighter, with small abdominal and arm circumferences, but showed relative sparing of subscapular skinfold thickness. This phenotype was described as muscle-thin but adipose or ‘thin-fat’. It was suggested that excess body fat may have advantages in the neonatal period but could persist into childhood and adult life and predispose to later obesity and diabetes. During 1997-1998 we studied 830 south Indian pregnant women and examined their babies in detail at birth(9). The babies have been followed up annually to observe their growth and body composition. In this paper we describe the anthropometry of the babies at birth, one and four years compared with white Caucasian (UK and Dutch) babies and children. Subjects and Methods During June 1997 to August 1998 we recruited women booking consecutively into the antenatal clinic of the Holdsworth Memorial Hospital (HMH) in Mysore(9). The main aim was to determine the prevalence of gestational diabetes mellitus in our population. Eligibility criteria were that women planned to deliver at HMH, had singleton pregnancies, were not diabetic before pregnancy and were <32 weeks gestation at booking (determined by last menstrual period (LMP) or first trimester ultrasound scan if the LMP was uncertain). Of 1233 eligible women, 830 (67%) agreed to participate. At 30 ± 2 weeks gestation, the women had a 100 g, 3-hour, oral glucose tolerance test and detailed anthropometric measurements (weight, height, and biceps, triceps, subscapular and suprailiac skinfolds) using standardized methods. The mothers’ plasma glucose and insulin concentrations were measured as previously described(9). Their husbands’ height and weight were measured at the same time. Socio economic status was assessed using the Kuppuswamy score, a questionnaire based method, which derives a score from the education, occupation and the income of the head of the family(10). Newborns were measured by one of four observers within 72 hours of birth. Weight was measured using a digital weighing scale (Seca, Germany), and crown-heel (CHL) and crown-rump lengths (CRL) using a Harpenden neonatal stadiometer (CMS Instruments, London). Head, abdomen (xiphisternum) and mid-upper arm (MUAC) circumferences were measured with a blank tape, marked and measured against a fixed ruler. Skinfold thicknesses (triceps and subscapular) were measured using Harpenden skinfold calipers (CMS Instruments, London). Readings were made following a five seconds count after applying the caliper blades. All measurements were made according to a standard protocol and measurers were standardized before starting the study. Follow-up at one-year was on the child’s first birthday (+4 weeks) for term births (gestational age (>37 weeks) and on the anniversary of the expected date of deli-very (+4 weeks) for preterm births. Follow-up at 4-years was on the child’s birthday (+4 weeks) for all children. Methods used for follow-up measurements were similar to birth measurements, however circumferences were measured using graduated anthropometric tapes. At 4 years, height and sitting height (CRL) were measured using a wall mounted adult stadiometer (Microtoise, CMS Instruments, London). A stool of known height was used to measure the sitting height. Eight children found to have medical conditions that could affect normal growth (mental retardation n = 5, congenital heart disease n = 1, hydrocephalus n = 1 and hereditary spherocytosis (n = 1) were excluded from the analyses after birth. Ethical permission for the study was granted by the HMH Ethics Committee and informed verbal consent was obtained from the parents. Statistical methods The data were analyzed using SPSS (version 10.1) statistical package. The distributions of skinfold measurements were skewed and the values were log transformed to satisfy assumptions of normality. Birth measurements were adjusted to a gestational age of 40 weeks, sexes separately, using linear regression. A newborn was considered small-for-gestational-age (SGA) if the adjusted birthweight was less than 2500 g. Arm muscle area (AMA) was calculated as follows(11): AMA (cm2) = (MUAC – Л Triceps)2/4p Comparison with standard populations For neonatal measurements we used a cohort of term babies born in Southampton (n = 377) who were measured, and assessed for gestational age, using identical methods to those in Mysore (triceps skinfold was not measured). The babies were studied as part of a student research project, which aimed to recruit all live-born singleton babies without congenital abnormalities born on weekdays between 19 January and 25 April 1987 in the Princess Anne Hospital, Southampton, UK, the main maternity hospital in the city(12). Sex and gestation specific SD scores for the Mysore babies were calculated: Mysore SD score = (Mysore observed value - South-ampton mean)/Southampton SD. For measurements at 1 and 4 years we derived SD scores using the UK growth standards for weight, height, BMI and skinfolds(13-16), and Dutch growth standards for weight, height, crown-buttock and leg lengths, MUAC, head circumference, triceps and subscapular skinfold thicknesses(17). We did not use the Dutch birth standards as they were not gestation adjusted and hence were likely to render the SD scores spuriously high. Results Completeness of follow-up Of the 830 women studied, 674 (667 live births) delivered at HMH. Measurements were obtained for 663 live born babies without congenital anomalies. Mean gestation was 39.0 weeks (SD 1.76); 52 babies (7.8%) were born preterm and 75 babies (11.3%) were SGA. Forty-three women (41 live births without congenital anomalies) had gestational diabetes. Twenty-five children (3.7%) were known to have died between birth and four years. At 1 year, 572 of the surviving children (88%, 36 born to gestational diabetic mothers) and at 4 years, 605 children (95%, 36 born to gestational diabetic mothers) were studied. Children lost to follow-up were lighter at birth than those who attended follow-up, though this was not statistically significant (2845 g vs 2991 g; P = 0.1). There were no significant differences in maternal weight, socio-economic status, percentage of mothers with diabetes, or the sex ratio. Birth measurements Compared to the UK neonates, the Mysore babies were significantly smaller in all measurements at birth (P < 0.001 for all, Table I). The deficit varied according to the measurement; it was greatest for birthweight (–1.09 SD, CI –1.16 to –1.02), MUAC (–1.07 SD, CI –1.15 to –0.99), head (–0.89 SD, CI –0.98 to –0.81) and abdominal circumferences (xiphisternum; –0.73 SD, CI –0.80 to –0.65), and least for CHL (–0.25 SD, CI –0.34 to –0.16) and subscapular skinfold (–0.19 SD, CI –0.25 to –0.12). (Fig. 1a) The findings were similar in boys and girls, and after excluding the babies born to mothers with gestational diabetes (Fig. 1b). Even among SGA babies, subscapular skinfold thickness was preserved (–1.09 SD, CI –1.21 to –0.96) compared with birthweight (–2.63 SD, CI –2.73 to –2.52) (Fig. 1c). TABLE I Characteristics of Mothers and Babies at the Time of Birth for Mysore and Southampton(12) cohorts. Values Represent Median and Inter-quartile Range.
*P = difference between Mysore and Southampton.
GDM=Gestational diabetes mellitus.
At comparable birthweights (2500-3500 g, 10 and 90 percentiles for weight of Mysore babies), Mysore neonates had bigger mean subscapular skinfolds (4.6 mm ± 0.80) than the Southampton babies (4.3 mm ± 0.77).
Anthropometry at 1and 4 years At one year, the smaller body size of Mysore infants compared to UK infants was more pronounced than at birth (Table II, Fig. 1a). The overall pattern was similar to that at birth; the deficit was greatest for head circumference, and least for CHL and subscapular skinfold thickness. However, the difference in SD scores between subscapular skinfolds (–0.94) and weight (–1.53) was less marked than at birth. TABLE II Characteristics of the Mysore Children at One and Four Years and the UK and Dutch Reference Data: Values Represent Median and Interquartile Range.
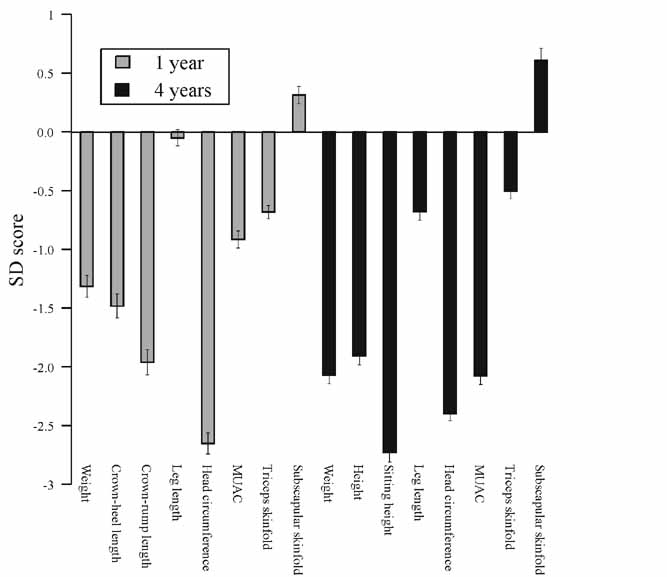
* Precise data in relation to 1 and 4 yr not available. At 4 years, Mysore children remained considerably smaller than the UK children for all measurements except the subscapular skinfold thickness, which was larger than the UK values (Fig. 1a). The difference between subscapular (+ 0.18 SD, CI + 0.11 to + 0.25) and triceps (– 0.83 SD, CI – 0.90 to – 0.77) was striking. Findings were similar after excluding the children born to mothers with gestational diabetes (Fig. 1b). As at birth, the deficit in height of Mysore children compared to UK children was less marked than that for body weight and head circumference (Fig. 1). To confirm our findings, we also calculated SD scores at one and four years relative to Dutch standards. This included CRL, leg length and MUAC, not available in the UK standards. The findings were substantially similar to the UK comparisons. At 1 and 4 years, the subscapular skinfolds of the Mysore children were larger than the Dutch standards (+ 0.31 SD, CI + 0.24 to + 0.38 at one year, + 0.61 SD, CI + 0.51 to + 0.71 at 4 years), while SD scores for triceps skinfold remained negative. The leg length of the Mysore children was similar to the Dutch standards, while crown-rump length (1 year) and sitting height (4 years) were markedly reduced, as were MUAC and head circumference (Fig. 2).
Predictors of subscapular skinfold thickness Since the main aim was to compare body phenotype in the study cohort with external growth standards, either a deficit or sparing of subscapular skinfold thickness at different ages was relative to the reference population rather than an absolute change within the cohort. Hence, it was not possible to examine predictors of differences between populations without data from these reference populations. However, we examined some of the possible factors associated with neonatal and childhood subscapular skinfold thickness in our population, including maternal height and BMI, maternal glucose and insulin concentrations (areas under the curve in the glucose tolerance test); paternal height and BMI, and the family’s socioeconomic status. In the whole sample, in univariate analyses, larger neonatal subscapular skinfold measurement was associated with higher maternal BMI (P <0.001), maternal glucose concentration (P <0.001), paternal BMI (P = 0.002) and higher socio-economic status (P = 0.001). When the children born to mothers with gestational diabetes were excluded, the association with glucose concentrations was no longer statistically significant. In a multivariate analysis maternal BMI and higher socioeconomic status remained significant predictors (Table III). TABLE III Determinants of Subscapular Skinfold Thickness at Birth and 4-years in Offspring of Non-diabetic Mothers.
Adjusted for sex and parity
* Exponentiated values (Proportionate change)
Both triceps and subscapular skinfold thicknesses at 4 years were positively correlated with the respective measurements at birth (Triceps r = 0.14, P = 0.001; subscapular r = 0.19, P <0.001). Change in the subscapular skinfold thickness from birth to 4 years (value at 4 years - value at birth) increased as birthweight decreased (1.4 mm above the highest quartile compared with 2.5 mm below the lowest quartile of birthweight, b = – 0.93, P <0.001, adjusted for sex and parity), while it increased with increasing current weight. However, subscapular skin-fold thickness at 4 years remained bigger in children with greater neonatal adiposity even after adjusting for birthweight (b = 1.04, P = 0.006, adjusted for sex and parity) or current weight (b = 1.02, P = 0.02, adjusted for sex and parity). In a multivariate analysis, significant predictors of subscapular skinfold at 4 years were neonatal subscapular skinfold thickness, and maternal insulin concentrations (Table III). All these variables combined explained less than 1% of the variability in subscapular skinfold thickness at 4 years. Discussion This was a large study of the size and body composition of babies at birth and early child-hood in south India. As observed previously among Pune babies(7,8), the Mysore newborns were small and thin compared with UK neonates but had relatively preserved truncal body fat. We have shown for the first time that this phenotype persists at the age of 4 years. This was not a community-based study; our mothers all delivered at one hospital in Mysore. HMH is a general hospital, and is one of three large maternity units in Mysore. The majority of women who deliver at HMH are from middle and lower socio economic categories. The characteristics of our mothers and babies were similar to those reported for other south Indian urban populations(18,19). Follow-up rates for the children were high; 96% of cohort survivors at 4 years. The low mean birthweight of Indian babies is well documented and is mainly caused by intra-uterine growth retardation rather than prematurity(20). The detailed measurements at birth in our study revealed that the smallness of our babies compared with white Caucasian newborns was not proportional. The babies were on average 500 g smaller and thin with small arm, (a measure of muscle bulk), abdominal (an indicator of visceral size) and head circumferences, but were relatively long and adipose. The fat may have survival advantages for small babies at birth by acting as an energy reserve, maintaining body temperature, and providing substrates for brain development(8). But this could persist in to adult life and predispose to insulin resistance. Our data show that it persists until at least 4 years. Relatively larger size of the subscapular skinfolds than the triceps skinfolds indicates a propensity for truncal body fat preservation. Similar observations in comparison with another Caucasian growth standard makes it unlikely that findings were due to chance or some peculiarity of the UK data. We speculate that several mechanisms, acting either independently or collectively, might be responsible for this neonatal phenotype. A ‘thrifty gene’, that may store surplus calories as fat for future utilization, might have evolved in the past times of unreliable food supply and persisted though the present nutritional conditions do not require it(21). Alternatively, the small Indian fetus may maximize its survival chances in the face of adverse intrauterine environment by diverting the energy supply to vital organs like the brain(22). Peripheral insulin resistance is one such mechanism, which channels substrate away from the viscera and skeletal muscles(23). Low muscle mass and truncal adiposity could be mechanisms adopted by the fetus to achieve this. Specific nutritional deficiencies, possibly secondary to maternal undernutrition, could also render the fetus unable to lay down lean tissue mass, so energy becomes deposited as fat(24). Few of our mothers were energy deficient, but Indian women are known to have a high prevalence of micronutrient deficiencies(25) and may be able to provide only substrates fit for generating adiposity in the fetus. Additional factors include maternal obesity, which may induce neonatal obesity genetically(26), and gestational diabetes, which acts through modifying the fetal environment(27). Even an increase in maternal plasma glucose within the normal range has been shown to increase neonatal size and adiposity(28). Adiposity in pregnancy might induce insulin resistance, subtle hyperglycemia and elevation of other ‘fuels’ such as fatty acids in the mother, which increases adiposity in the newborn. We have shown previously in the Mysore cohort that maternal adiposity and gestational diabetes were important determinants of neonatal adiposity(9). Increased ponderal index was seen with increasing maternal glycemia even in the non-diabetic range. We do not know the reasons for apparent diminution of adiposity (relative to the reference population) in the first year of life in our children. We have not come across any studies that could shed light on this phenomenon. However, adiposity produced by maternal gestational diabetes in the offspring is also masked in infancy(29). We speculate that once released from the uterine constraints, the infant may utilize the available nutrition for comprehensive growth, thus minimizing the fat development as against other body composition. Resurfacing of excessive truncal fat later in childhood is a new finding in our cohort. The fat storage path laid down in intrauterine life might persist and become manifest as adiposity increase during childhood. Our data shows that the child’s own neonatal adiposity was a strong risk factor for subscapular adiposity at 4 years, even after adjusting for child’s own birthweight and current weight. Thus any factor giving rise to adiposity at birth might indirectly influence the rise in childhood adiposity. Interestingly, maternal hyperinsulinemia during pregnancy was also an important predictor independently of other determinants even in children of non-diabetic mothers. Different levels of exposure to several other postnatal factors such as nutrition, morbidity or physical activity in the study and standard populations may also have caused the apparent diminution or re-emergence of adiposity in our population. Information about their comparative role in different populations would be valuable. Tracing the origins of the ‘thin fat’ phenotype in early life may be the key to understanding south Asian susceptibility to later obesity and diabetes. More research is needed into the genetic and environmental factors (maternal nutrition and metabolism, postnatal diet and physical activity) that deter-mine early growth and body composition. Acknowledgements We are grateful to all the women and the children who participated, to Dr. B.D.R. Paul, former Director of H.M.H., and the obstetrics and pediatric consultants. We thank Ms. Annamma, Mrs. Baby, late Mrs. Devaki, Mrs. Lalitha, Mrs. Savitha, Mrs. Lalithakala, Mr. Gopal Singh, Mrs. Swarna Gowri, Mrs. Surekha, Mr. Shrinivas, Ms. Shobha and Dr. Sudha Srinivas, who made a substantial contribution to the study. We also thank Sneha-India for its support. Contributors: GVK, JCH, SRV and CHDF designed the study. Data was collected by GVK, JCH, SRV, KJC and SCK and analyzed by GVK, JCH, SRV, SDL and CHDF. Funding: Parthenon Trust, Switzerland and Well-come Trust, U.K. Competing interests: None.
| ||||||||||||||||||||||||||||||||||||||||||||||||||||||||||||||||||||||||||||||||||||||||||||||||||||||||||||||||||||||||||||||||||||||||||||||||||||||||||||||||||||||||||||||||||||||||||||||||||||||||||||||||||||||||||||||||||||||||||||||||||||||||||||||||||||||||||||||||||||||||||||||||||||||||||||||||||||||||||||||||||||||||||||||||||||||||||||||||||||||||||||||||||||||||||||||||||||||||||||||||||||||||||||||||||||||||||||||||||||||||||||||||||||||||||||||||||||||||||||||||||||||||||||||||||||||||||||||||||||||||||||||||||||||||||||||||||||||||||||||||||||||||||||||||||||||||||||||||||||||||||||||||||||||||||||||||||||||||||||||||||||||||||||||||||||||||||||||||||||||||||||
|
References | ||||||||||||||||||||||||||||||||||||||||||||||||||||||||||||||||||||||||||||||||||||||||||||||||||||||||||||||||||||||||||||||||||||||||||||||||||||||||||||||||||||||||||||||||||||||||||||||||||||||||||||||||||||||||||||||||||||||||||||||||||||||||||||||||||||||||||||||||||||||||||||||||||||||||||||||||||||||||||||||||||||||||||||||||||||||||||||||||||||||||||||||||||||||||||||||||||||||||||||||||||||||||||||||||||||||||||||||||||||||||||||||||||||||||||||||||||||||||||||||||||||||||||||||||||||||||||||||||||||||||||||||||||||||||||||||||||||||||||||||||||||||||||||||||||||||||||||||||||||||||||||||||||||||||||||||||||||||||||||||||||||||||||||||||||||||||||||||||||||||||||||
|
| ||||||||||||||||||||||||||||||||||||||||||||||||||||||||||||||||||||||||||||||||||||||||||||||||||||||||||||||||||||||||||||||||||||||||||||||||||||||||||||||||||||||||||||||||||||||||||||||||||||||||||||||||||||||||||||||||||||||||||||||||||||||||||||||||||||||||||||||||||||||||||||||||||||||||||||||||||||||||||||||||||||||||||||||||||||||||||||||||||||||||||||||||||||||||||||||||||||||||||||||||||||||||||||||||||||||||||||||||||||||||||||||||||||||||||||||||||||||||||||||||||||||||||||||||||||||||||||||||||||||||||||||||||||||||||||||||||||||||||||||||||||||||||||||||||||||||||||||||||||||||||||||||||||||||||||||||||||||||||||||||||||||||||||||||||||||||||||||||||||||||||||
![]()