|
Height Velocity, Body Fat and Menarcheal Age of Indian Girls |
Shobha Rao, Smita Joshi and Asawari Kanade
From the Biometry and Nutrition Unit, Agharkar Research Institute, Agharkar Road, Pune 411 004, India.
Reprint. requests: Dr. Mrs. Shobha Rao, Biometry and Nutrition Unit, Agharkar Research Institute, Agarkar Road; Puile
411 004, India.
Manuscript received: March 10, 1997; Initial review completed: ApHI11, 1997;
Revision accepted: December 8, 1998.
Abstract:
Objective: To understand the onset of menarche in relation to changes in physical measurements that take place during adolescence, especially the changes in height velocity and changes in body fat. Design:
Adolescent girls in the 9-16 year age group were observed longitudinally every six months for a period of two years.
Setting: Girls from schools catering to urban high socio- economic class (HSE, n = 135) and those catering to low socio-economic class (LSE, n = 398) were evaluated.
Methods: Six monthly measurements of weight, height and triceps skinfold thickness (TSFT) were done. Menarcheal age was recorded by recall method for the girls who were menstruating at the beginning of the study and prospectively for girls whose onset was after the initiation of the study. Body fat (%) was estimated using weight, height and TSFT.
Results: The girls from LSE not only had lower attained weight, height, skin fold thickness at triceps and body
fat but also had a significant difference
(p
< 0.05)
in menarcheal age
(15.4 yr) as compared to
girls from HSE (12.1 yr). Although social class differences delayed the occurrence of the event by chronological age, the time between peak height velocity (PHV) and onset of menarche remained similar (1.5 yr) irrespective of social class. The mean weight at menarche, at group level (but not at individual level), was around 38 kg in both socio-economic classes, irrespective of age at onset. Further menarche represented the point of maximum deceleration in height velocity and maximum acceleration in body fat in both social classes.
Conclusion: Our data indicated a partial support for critical weight hypothesis and suggested that these limits vary from community to community. The analysis revealed that rather than absolute values of weight, height and body fat, changes in these measurements are of significance with regard to onset menarche.
Key words: Anthropometry, Body fat, Menarche,
Peak height
velocity.
DIFFERENCES in menarcheal age of
girls from rural
-
urban communities
or from different social classes have trivial explanations in terms of differences in their nutritional levels. But between individual differences in menarcheal age within same social class are often wide and cannot be fully explained by differences in nutritional intake
alone(1). As such it is necessary to
understand the onset of menarche in relation to other changes especially velocities in physical measurements that take place during adolescence.
Earlier studies attempting to explain between individual differences in onset of menarche used single explanatory variables such as body weight(2) or fat(3). Further, their research claimed critical
values for body weight (48 kg) and body fat (17%) to be associated with onset of menarche. However, studies from different communities fail to support the hypothesis of critical body weight or critical body fat(4,5). Clearly, factors other than weight or body fat, may have a role in deciding the onset of menarche. One of the major events that precedes menarche is the attainment of peak height velocity (PHV). Therefore, information on deceleration in height velocity following PHV alongwith gain in body weight may help to improve the understanding about onset of menarche. The present study examines these changes in relation to menarcheal age among girls from two socio-economic classes.
Subjects and Methods
The study population consisted of school going girls in t e age group of 9-16 years from two differ t socio-economic classes. Initially three to
four schools from an affluent area and from urn areas were
formally contacted for seeking their co-operation to carry out a two-year longitudinal study. One school from an urban affluent area and two schools from slum areas agreed to offer the necessary co-operation and were considered for the study. Two schools selected from slum areas catered to the girls from low socio-economic (LSE) class while the other selected school catered for girls from high socio-economic (HSE) class. The HSE
school was run in two shifts, the students from afternoon
shift alone were included in the study for keeping uniformity with LSE school. Moreover, LSE school had more number of divisions in each standard. As such sample size for LSE was larger than that for HSE. All girls from 5th to 9th standard from selected schools were included in the two year longitudinal study. Selected schools were co-educational schools and had about 30 girls in each class. In the affluent school
thus 135 girls could be enrolled while from the two schools in slum areas 398 girls could be enrolled for the study.
Socio-economic Information
A detailed information was collected on major socio-economic variables which are associated with growth of children. Thus parity, family size, parent's education, their occupation, etc. were recorded through a questionnaire. Additionally, information on habitual dietary pattern was also collected.
Measurements
All the enrolled girls were measured every six months for body weight (upto 50 g), height (upto 0.1
cm) and skinfold thickness at triceps (Lange Skinfold Caliper, Cambridge Scientific Industries, Maryland, upto 1 mm) by trained investigators using standard methods. Age assessment was done using school records. No school admissions in urban Pune are done without birth .certificate; therefore age assessment using school records was reasonably valid. Inter-observer variation was evaluated at the beginning of the study, for 5 investigators. Each one measured weight, height and skinfold thickness at triceps twice on 13 subjects. The between investigator variation
and within investigator variations were observed to be
negligible (CV < 1%). Each investigator was assigned a task of
re- cording a specific measurement and the investigators remained same throughout the study thus reducing measurement errors.
Menarcheal age
Of the selected girls, 61 from HSE and 114 from LSE were mesntruating at the be- ginning of the study for whom menarcheal age was recorded by recall method. Since menarche is a discrete, noticeable event, and as the age at questioning was quite young, the expected bias in recall is likely
to be very low. Additionally, 44 and 46 girls from HSE and LSE, respectively, reported onset of menarche during the study period for whom menarcheal age was obtained prospectively.
Body
Fat
In order to estimate body fat, different equations reported in literature for adolescents were tested. The equation which showed a high correlation of body fat with body weight and with skinfold thickness, but low correlation with height was searched. The equation given by Frerich et al.(6) was found satisfactory for estimating body fat (%) and is given below:
Body fat (%)
=
4.67 + [0.85 (WT /(HT)3)] + 0.73 (TSFT) (WT in Kg; HT in Mt.; TSFT in mm)
Body fat (%) thus estimated showed correlation with weight, of the order of 0.74 for HSE and 0.63 for LSE while the correlations with skinfold thickness were 0.98 and 0.97 for HSE and LSE, respectively. However, correlations with height (0.29 for both HSE and LSE) were lowest. As such this equation was used for estimating body fat using weight, height and skinfold thickness measurements.
Statistical Methods
One sample and two sample mean Student's 't' tests were used for comparing observed mean weights in yearly age groups with those of NCHS 50th percentile and for comparing mean weights of menstruating and non-menstruating girls, respectively. Similarly, proportions of menstruating girls were compared using normal Z test.
Results
The detailed socio-economic information collected showed that most parents (90%) of girls from HSE were better
educated (graduates) as compared to those from LSE (4%). Similarly, many parents (44%) in HSE were professional for businessmen while none were in this category in case of girls from LSE; in fact many (75%) were working as laborers on un- skilled jobs. There were clear differences with regard to family size, only 15% families from HSE as against 85% families from LSE had family size greater than 5. Similarly in the study population, only 12% girls from HSE but 47% girls from LSE had their parity greater than 3. The dietary patterns revealed that consumption of milk, fruits, eggs, etc. was routine and higher in the diets of girls from HSE
but not in case of girls from LSE. The social class differences were thus distinct in the observed population.
Average weight, height and skinfold thickness at triceps and estimated body fat (%) for girls in various age group from two socio economic classes are given in Table
I. These averages are based on cumulative
measurements
(362
for HSE and 948 for
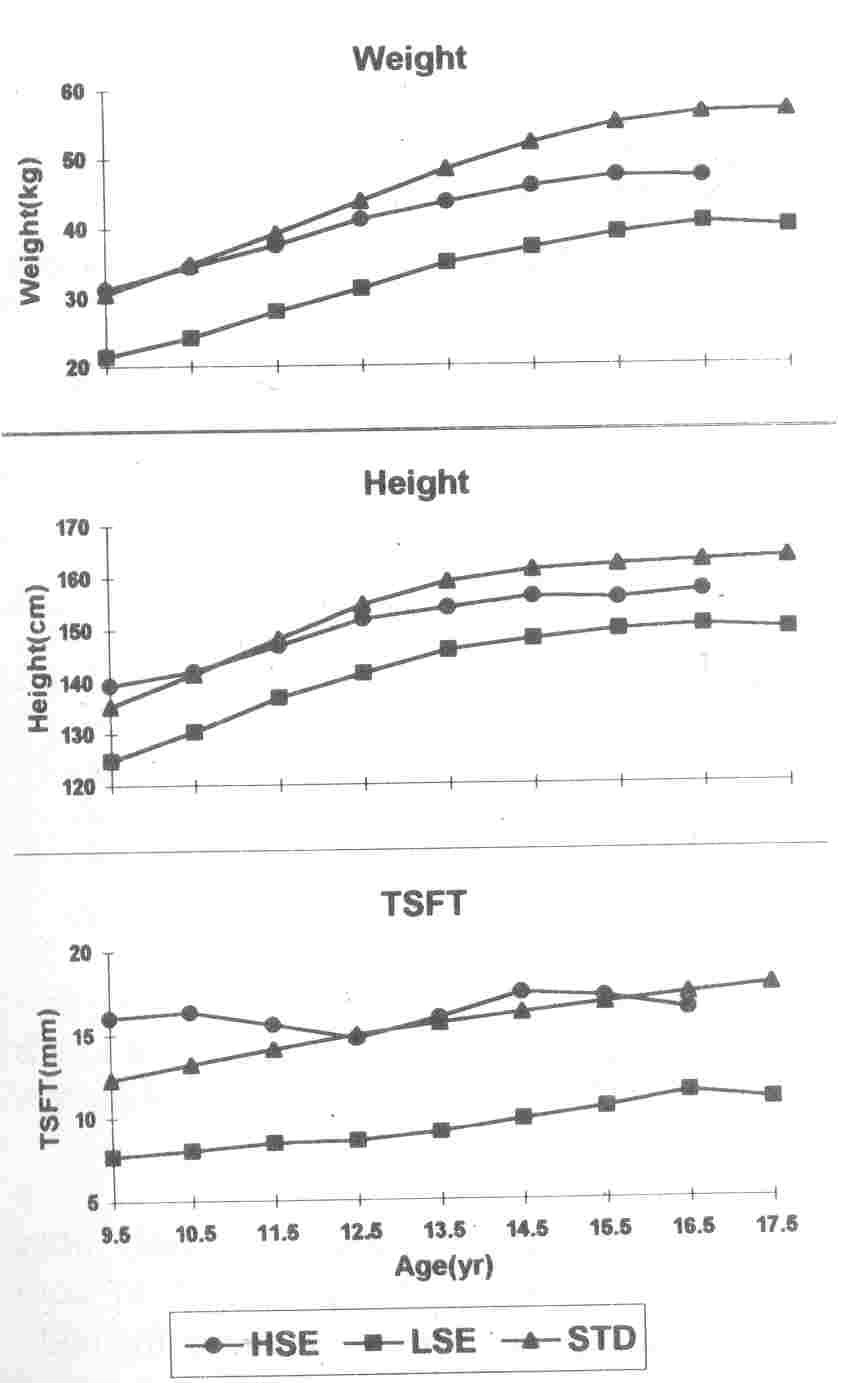
LSE). The average values of attained weight and height for every yearly age groups are compared with NCHS (50th percentile) and those for skinfold thickness are compared with American standards (Fig. 1). Social class related differences were significant (p < 0.05) at all ages for all the measurements showing that girls from HSE were taller, heavier and had higher body fat stores compared to those from LSE. The differences were however maximum for skinfolds, i.e.,
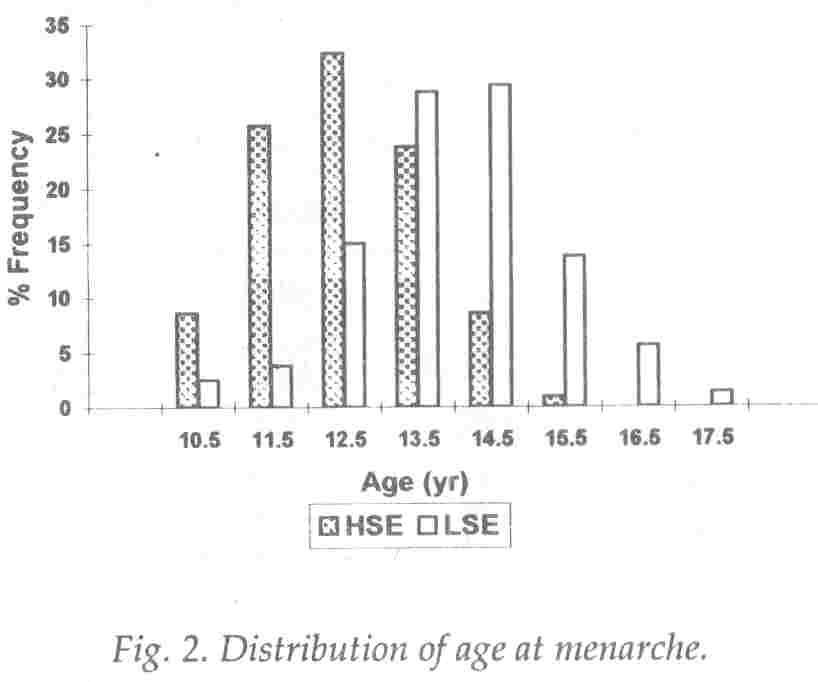
body fat stores. Social class differentials were also seen when data on menarcheal age was compared. Thus, in HSE, most girls attained menarche by 14 yr age, but this was not true until 16 yr of age in LSE. The distribution of menarcheal age for girls in LSE showed clear shift to the right when compared with that of HSE (Fig. 2). The average age at menarche estimated by probit analysis (using SPSS/PCt) for girls from LSE (15.4 yr) was thus significantly higher (p < 0.05) than that ob- served for girls from HSE (12.1 yr). The probit estimate for menarcheal age for the girls who reported menarche at the start of the study was slightly higher (12.7 yr) for girls from HSE
and lower (14.3 yr) for girls from LSE. Nevertheless, the
estimates indicate that menarche was delayed significantly (p < 0.01) among girls from LSE.
TABLE I
Mean (SD) fro various
Anthropometric Measurements in Initial Round
Age
(yr) |
Weight (Kg) |
Height (cm) |
TSFT (mm) |
Body fat (%) |
| No. |
HSE |
No. |
LSE |
HSE |
LSE |
|
|
HSE |
LSE |
| 9+ |
4 |
31.8 |
48 |
21.4** |
139.3 |
124.8** |
16.0 |
7.6** |
26.2 |
19.6** |
| |
|
(1.2) |
|
(1.8) |
(5.9) |
(4.2) |
(2.0) |
(1.7) |
(1.9) |
(1.8) |
| 10+ |
34 |
34.3 |
102 |
24.1** |
142.0 |
130.2** |
16.3 |
8.0** |
26.7 |
19.7** |
| |
|
(6.0) |
|
(3.5) |
(7.3) |
(5.9) |
(5.5) |
(2.4) |
(5.2) |
(2.2) |
| 11+ |
51 |
37.5 |
145 |
28.0** |
146.8 |
136.8** |
15.5 |
8.4** |
25.9 |
20.0** |
| |
|
(7.9) |
|
(4.8) |
(7.9) |
(6.4) |
(6.2) |
(3.1) |
(5.7) |
(2.8) |
| 12+ |
75 |
41.2 |
138 |
31.1** |
151.9 |
141.5** |
14.7 |
8.5** |
25.3 |
20.1** |
| |
|
(8.5) |
|
(5.1) |
(6.9) |
(6.8) |
(5.5) |
(3.2) |
(5.3) |
(3.1) |
| 13+ |
74 |
43.6 |
146 |
34.9** |
154.0 |
145.8** |
15.9 |
9.1** |
26.3 |
20.8** |
| |
|
(8.7) |
|
(5.1) |
(6.3) |
(6.3) |
(6.0) |
(3.4) |
(5.5) |
(3.2) |
| 14+ |
76 |
45.8 |
137 |
37.0** |
156.1 |
147.9** |
17.7 |
9.8** |
27.5 |
21.5** |
| |
|
(7.8) |
|
(5.2) |
(5.8) |
(5.6) |
(5.9) |
(3.6) |
(5.6) |
(3.6) |
| 15+ |
43 |
47.4 |
128 |
39.1** |
155.6 |
149.6** |
17.1 |
10.5** |
27.8 |
22.2** |
| |
|
(8.6) |
|
(4.8) |
(5.3) |
(5.0) |
(5.3) |
(3.8) |
(5.4) |
(3.6) |
| 16+ |
4 |
47.1 |
64 |
40.6* |
157.1 |
150.4** |
16.4 |
11.4** |
26.8 |
23.1
n.s. |
| |
|
(9.9) |
|
4.9 |
(3.1) |
(4.8) |
(5.8) |
(4.3) |
(5.8) |
(4.2) |
| 17+ |
- |
- |
40 |
39.8 |
- |
149.6 |
- |
11.1 |
- |
22.9 |
| |
|
|
|
(4.6) |
|
(5.3) |
|
(4.0) |
|
(3.9) |
Figures in parenthesis
represent SD values
*p<0.05; **p<0.01; n.s. not significant
 |
|
Fig. 1. Growth curves for girls from two different socio-economic classes. |
Earlier studies(2) postulated the hypothesis of critical body weight of 48 kg implying that attainment of body weight of 48 kg would trigger off the onset of menarche, irrespective of other factors. As
studies from different communities pro- vided varying results, the authors subsequently modified the hypothesis and claimed critical body fat (17%) as a pre- requisite for onset of menarche. This claim too has been tested in many communities and again varying results suggest that either body weight or body fat alone may not explain fully the variation in menarcheal age.
Our data was also analyzed only for girls who reported menarche prospectively, i.e., during the study period, The average
weight at menarche for menstruating girls and for those who did not attain menarche till the end of study period are given by yearly age groups in Table II. In most age groups, menstruating girls were
significantly heavier than non-menstruating girls, and it was more so in LSE group. Further, it can be seen that for menstruating girls, the mean weight in different age gro4ps were around 38 kg in both the social classes.
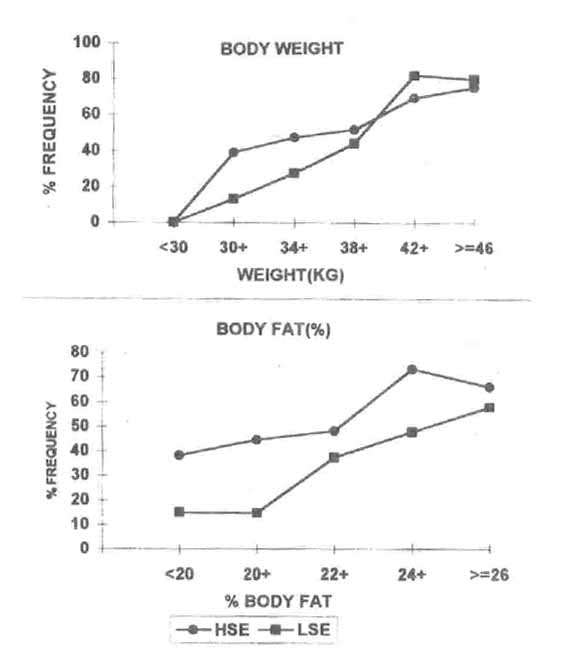
The data was further analyzed to compute the proportions of girls reporting menarche. prospectively by their body weights. Fig. 3 shows that there is a sudden and significant increase (p < 0.05) in proportion of menstruating girls only after attaining 38 kg of body weight in both social classes. A similar analysis for body fat (%) also showed a significant increase (p < 0.05) in proportion of menstruating girls but at different cut-offs, namely, 22% for HSE and 20% for LSE girls, respectively. Thus our data provides partial support to the critical body weight/body fat hypothesis.
TABLE II
Average Weight of Menstruating and Non-Menstruating Girls
|
HSE
|
|
Age (yr)# |
|
Menstruating girls |
|
Non-menstruating girls |
|
|
|
|
No. |
Mean |
SD |
No. |
Mean |
SD |
Significance |
|
<11 |
4 |
38.9 |
5.7 |
3 |
34.0 |
2.1 |
NS |
|
11 - 12 |
10 |
40.5 |
5.6 |
14 |
36.2 |
7.2 |
NS |
|
12 - 13 |
11 |
39.6 |
2.3 |
3 |
27.6 |
1.9 |
** |
|
13 - 14 |
15 |
37.1 |
2.6 |
3 |
37.2 |
5.4 |
- |
|
>
=
14
|
4
|
37.3 |
2.3 |
5 |
47.6 |
2.8 |
- |
|
Total |
44a |
37.8 |
6.4 |
28b |
37.2 |
7.9 |
|
|
LSE |
|
< 12 |
3 |
37.1 |
1.2 |
87 |
26.1 |
4.0 |
** |
|
12 - 13 |
8 |
39.5 |
2.0 |
37 |
30.2 |
2.9 |
** |
|
13 -14 |
8 |
37.1 |
1.7 |
27 |
32.7 |
4.8 |
** |
|
14 - 15 |
21 |
36.4 |
1.9 |
17 |
34.4 |
4.2 |
** |
|
>=15 |
6 |
37.9 |
1.6 |
12 |
37.4 |
4.0 |
NS |
|
Total |
46a |
37.3 |
3.5 |
180b |
29.5 |
5.4 |
|
**
p < 0.01; N S
=
Not significant. a : Girls reporting onset of menarche prospectively. b : Girls
remained non-menstruating till the end of the survey period. # : For menstruating girls, this age represents age at menarche.
 |
|
Fig. 3. Distribution (%)
of menstruating girls ac- cording to weight and
body
fat. |
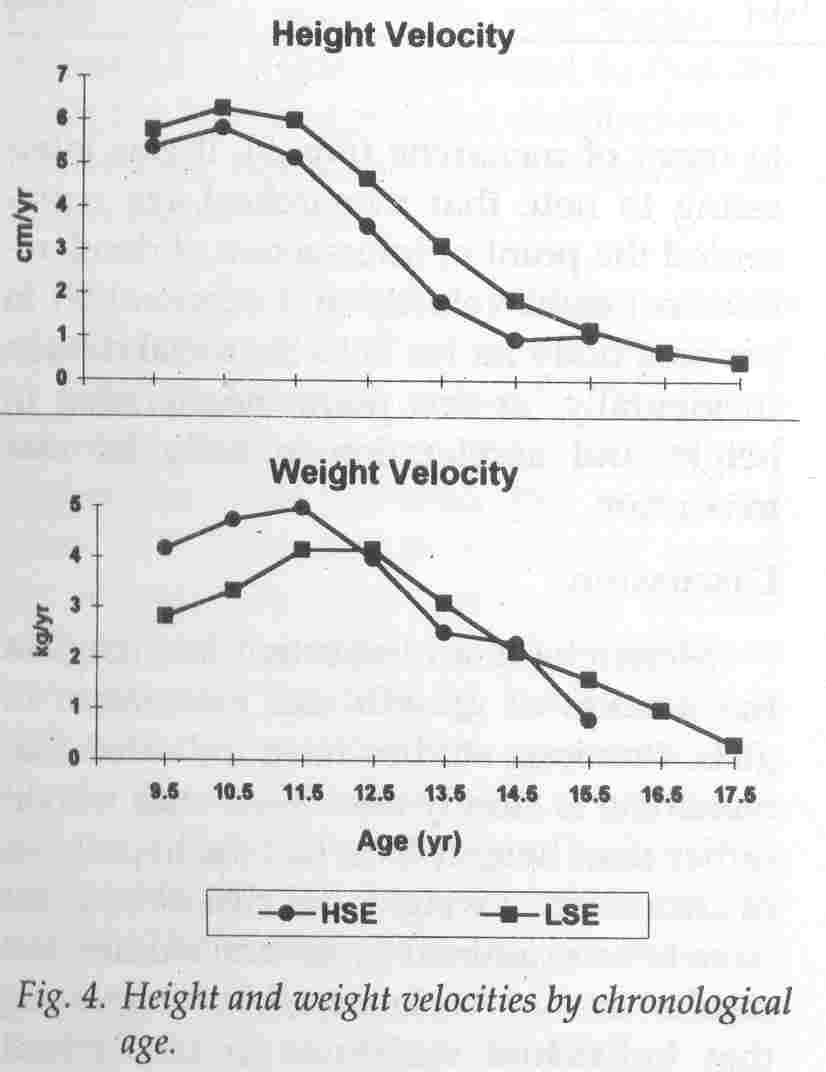
Mean velocities by chronological age for weight and height were computed using all available data on annual increments (227 for HSE, 553 for LSE) and are summarized in Table III and plotted in Fig. 4. Height velocities were higher among girls from LSE (especially after age at PHV, i.e., 11+ yr) compared to that observed among girls from HSE and is an indication of catch-up growth. However, weight velocities were higher among girls from HSE before 12 yr age (i.e., before age at PHV), compared to
that observed among girls from LSE. Differences in height and weight velocities and age at which PWV (Peak Weight Velocity) and PHV (Peak Height Velocity) are attained, will have implications for
menarcheai age.
TABLE III
Mean (SD) Weight and Height Velocity According to Chronoloigcal Age.
Age
(yr) |
Weight velocity (kg/yr) |
Height velocity (cm/yr) |
|
HSE |
LSE |
Difference |
HSE |
LSE |
Difference |
|
9 -10 |
4.15 (2.3) |
2.81 (1.3) |
1.34 |
5.35 (2.2) |
5.76 (1.2) |
-0.41** |
|
10-11 |
4.73 (2.0) |
3.33 (1.7) |
1.40* |
5.81 (1.3) |
6.27 (1.7) |
- 0.46** |
|
11 - 12 |
4.97 (2.2) |
4.14 (1.5) |
0.83* |
5.13 (2.0) |
6.00 (1.9) |
-0.87* |
|
12 - 13 |
3.98 (2.6) |
4.16 (1.8) |
-0.18** |
3.55 (2.0) |
4.65 (2.1) |
-1.10* |
|
13 - 14 |
2.52 (2.3) |
3.09 (2.0) |
- 0.57** |
1.80 (1.6) |
3.10 (1.9) |
- 1.30*
|
|
14 - 15 |
2.30 (2.2)
|
2.13 (2.0) |
0.17** |
0.94 (1.1) |
1.85 (1.7) |
-0.91* |
|
15 - 16 |
0.80 (1.5) |
1.61 (1.8) |
-0.81** |
1.03 (0.5) |
1.16 (1.2) |
-.0.13** |
|
16 -17 |
-
|
0.99 (1.3)
|
-
|
|
0.67 (0.6)
|
|
|
17 -18 |
- |
0.32 (1.7) |
- |
|
0.44 (0.3) |
|
** p < 0.01; ** not significant.
In order to see explicitly the changes in weight and height velocities before and after menarche, in both social classes, it is necessary to compute velocities at ages expressed as deviation from menarcheal age for individual girl. As our study was longitudinal in nature, it was possible to analyse
the time related changes in these measurements at individual
level. The differences in menarcheal age were adjusted by expressing chronological age as deviation from menarcheal age, i.e., time since menarche. Owing to large variability in velocities, median values instead of mean were computed for various time points
before onset (-1.0, - 0.5 yr ...
etc.)
and after
onset (0.5, 1.0 yr ... etc.) of menarche (Table IV).
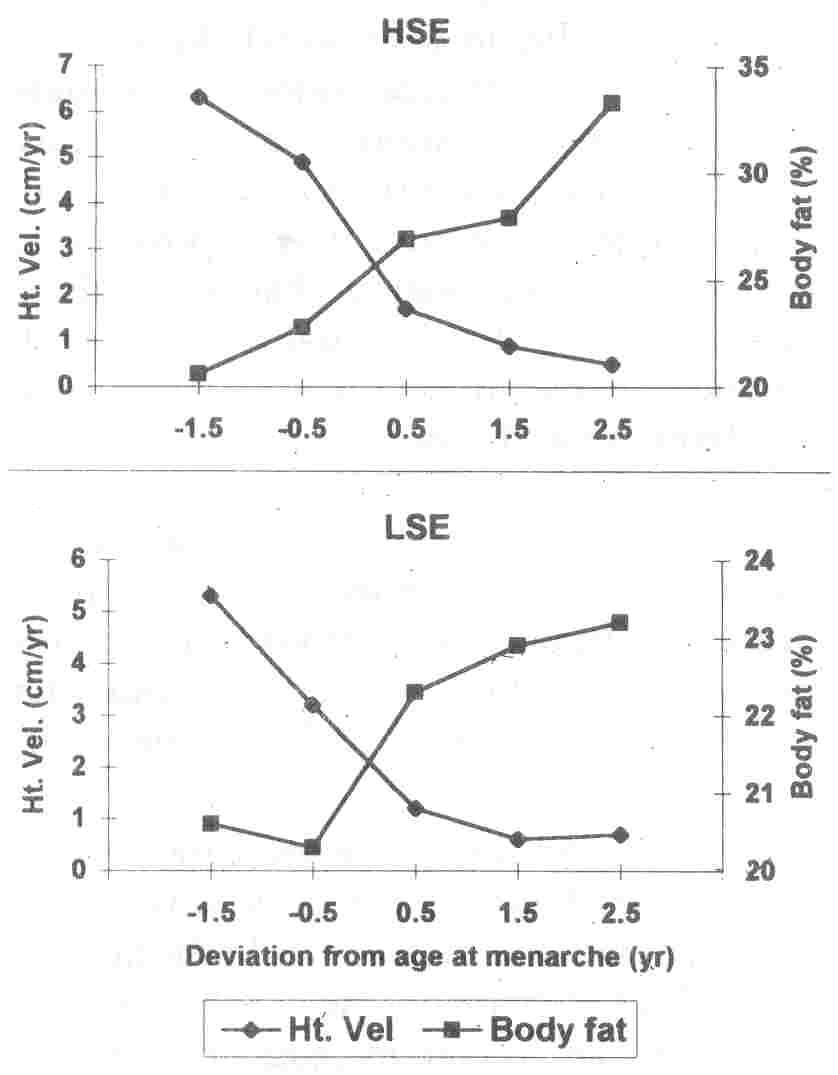
In both the social classes, considerable increase in body fat of girls was noted. Thus in HSE
the increase in body fat was from 20% before menarche to 34%
after menarche while similar increase in LSE was only from 20% to 24% during adolescence. Changes in body fat along with changes in height velocity were examined in relation
to onset of menarche (Fig. 5). It was interesting to note that menarcheal age represented the point of intersection of deceleration in height velocity and acceleration in percent body fat for both the social classes. Incidentally, at this point, deceleration in height and acceleration in body fat was maximum.
TABLE IV
Median Weight and Height Velocity and Body Fat (%) Before and After Menarche
Deviation from
menarcheal age
(yr) |
Sample size |
Weight velocity (kg/yr) |
Height v.elocity (cm/yr). |
Body fat (Dfo)
|
|
HSE |
LSE |
HSE |
LSE |
ESE |
LSE |
HSE |
LSE |
|
-2.0 |
4 |
2 |
5.2 |
4.3 |
6.9 |
4.5 |
21.9 |
21.0 |
|
-1.5 |
12 |
6 |
4.1 |
4.2 |
6.3 |
5.3 |
20.6 |
20.6 |
|
-1.0 |
9 |
2(3 |
4.9 |
3.7 |
5.7 |
4.3 |
23.4 |
19.5 |
|
-0.5 |
30 |
22 |
5.2 |
3.5 |
4.9 |
3.2 |
22.8 |
20.3 |
|
0 |
19 |
38 |
4.1 |
2.7 |
3.1 |
1.8 |
25.6 |
19.7 |
|
0.5 |
30 |
44 |
3.0 |
1.8 |
1.7 |
1.1 |
26.9 |
.22.3 |
|
1.0 |
26 |
24 |
2.0 |
1.4 |
1.1 |
0.7 |
27.9 |
21.7 |
|
1.5 |
16 |
42 |
1.9 |
0.7 |
0.9 |
0.6 |
27.9 |
22.9 |
|
2.0 |
18 |
16 |
2.7 |
1.5 |
0.8 |
0.8 |
25.9 |
23.6 |
|
2.5 |
5 |
12 |
1.3 |
1.1 |
0.5 |
0.5 |
33.3 |
23.2 |
 |
|
Fig. 5. Height velocity and body fat (%) in relation to onset of menarche. |
Discussion
Menarche is an important landmark in the process of growth and maturation of girls. Previous studies have indicated that menarche is closely associated with weight rather than height(7). In fact the hypothesis of critical body weight and cirtical body fat have been examined by several studies, but results are at variance(4,8,9), suggesting that individual variations in menarcheal age are not yet fully understood. A differ- ent observation is reported by Bamus(lO), who reported that menarche occurs around maximum deceleration in height velocity once the PHV is attained. However, none have given consideration to simultaneous
changes m. height velocity and accumulation of body fat with regard to onset of
menarche. Observed differences in the rate of maturation between individuals of the same sex in a given 'community, do not arise suddenly, although they become obvious during adolescence. Therefore changes preceding menarche, especially those occurring in height velocity, weight gain and body fat accumulation, need to be considered
simultaneously.
Our observation that girls from HSE I were significantly taller and heavier and
I
had higher average body fat compared to
I girls from LSE was in conformity with earlier reports(1l,12). This was also reflected
in terms of delayed menarche among girls from LSE as the probit estimate of menarcheal age for these girls was higher by almost 1.5 to 2 years compared to that observed in HSE and also the distributions of menarcheal age differed considerably for the two social classes.
Our analysis indicated the importance of attained weight (38
kg) and body fat (20 to 22%) for onset of menarche, but these
cut-offs were lower for body weight and higher for body fat
than the postulated ones. The indication is that such critical
limits may vary from community to community and the same
critical weight may not represent same body composition in
different communities as suggested. earlier(5). There were
some girls whose body weight or fat (%) values were higher
than these limits and yet they did not report menarche. The possibility of shyness or reluctance on their part to reveal the onset can not be totally ignored in this context.
The mean velocities by chronological ages were higher in LSE especially after PHV indicating catch-up growth at later ages. However, in view of our objective, differences in velocities were examined at
various time points before and after menarche in the two classes. Thus, when differences in menarcheal ages were adjusted, height velocities differed significantly till onset of menarche and not thereafter, but weight gains were significant throughout adolescence. More interestingly, menarche occurred 1.5 years later to PHV, irrespective of social class. The period between the attainment of PHV
and 'the onset of menarche has been reported to be 18-24 months not only in Indian studies(13) but also for British girls(14). The indication is that wide social class differences seem to influence greatly the occurrence of the events by chronological age, but negligibly the time between the two important bio- logical events, namely, attainment of PHV and onset of menarche.
Although there were significant differences in the mean measurements of girls from two socio-economic classes, it was the change in body fat (gain) and height velocity (deceleration) which was associated with menarche. In fact, menarche represented a point of maximum deceleration in height velocity and maximum acceleration in body fat{%)
in
both the social classes.
In conclusion, the analysis presented in this study provides a better understanding of the relationship between menarcheal age and anthropometry. Height velocity following PHV and gain in body fat influenced menarcheal age prominently. Further,
it was observed that despite wide social class differences, once the differences in menarcheal age are adjusted, the time between two successive biological events, namely, age at PHV and age at menarche was same. Undernutrition, thus delays only onset of adolescent events in terms of chronological ages but neither the sequence of events, nor the time between two consecutive events. It cannot be denied, however, that this shift in adolescent growth
span
due to undernutrition may result in considerable postmenarcheal skeletal growth
and is an issue of special concern for girls from poor
communities due to early age at marriage and needs further investigations.
Acknowledgements
The authors are grateful to Dr. A.D. Agate, Director, Agharkar Research Institute, for providing facilities to undertake the 'Longitudinal Adolescent Growth Study'. We are also thankful to the project staff for their help in field work and laboratory work.
1.
Richardson BD, Laing PM, Rantsho JM,
Swinel RW. The bearing of diverse patterns of diet on growth of menarche in four different ethnic groups of South African girls.
J
Trop Med Physio 1983; 86: 5-12.
2.
Frisch RE, Revelle R. Height and weight at menarche and a hypothesis of critical body weight and adolescent events. Science 1970; 169: 397-399.
3.
Frisch RE, McArthur JW. Menstrual cycle: Fatness as a determinant of minimum weight for height necessary for their maintenance on onset. Science 1974; 185: 949-951.
4.
Garn SM, Lavelle M, Pilkington
JJ. Comparison of fatness in premenarcheal and postmenarcheal girls of the same age.
J Pediatr 1983; 103: 328-331.
5.
Richardson BD, Pieters L. Menarche and
growth. Am
J
Clin Nurt 1977; 30: 2088- 2091.
6. Frerich RR, Harsha DW, Berenson GS. Equations for estimating percentage of body fat in children 10-14 years old. Pediatr Res 1979; 13: 170-174.
7.
Osteria TS. Nutritional status and menarche in rural community in the Phillipines. Phillipine
J
Nutr 1983; 36: 150-156.
8. Rana T, Raman L, Rau P, Rao KV. Association of growth
status and age at menarche in upper middle income group girls at Hyderabad. Indian
J
Med Res 1986; 84: 522-530.
9.
Cameron N. Weight and skinfold variation at menarche and critical body weight hypothesis. Ann Hum BioI 1976; 3: 279-
282.
.
10.
Barnus HV. Physical growth and development during puberty. Med Clin North Am 1975; 59: 1305-1317.
11.
Prabhakar AK, Sundaram KR, Ramanujucharyalu TKTS, Taskar
,AJ. Influence of socio economic factors on the age at the appearance of different puberty signs. Indian
J
Med Res 1972; 60: 789-792.
12.
Kulin HE, Bwibo N, Mutie D, Santner SJ. The effect of chronic childhood malnutrition
on pubertal growth and development. AmJ Clin Nutr 1982; 36: 527-536.
13.
Satyavathi K, Agarwal KN, Khare BB, Agarwal DK. The growth pattern of weight and height during adolescence. Indian
J
Med Res, 1981; 74: 857-865.
14.
Riley AP, Huffmans SL, Chowdhary AKM. Age at menarche and postmenar-cheal growth in rural Bangladeshi females. Ann Hum BioI 1989; 16: 347- 359. .
|
|
| |