|
|
|
Indian Pediatr 2013;50: 143-147 |
 |
Trends in Child Mortality in India
|
|
AS Behl
From HealthPartners Research Foundation, 8170
33rd Ave. S., PO Box 1524, Minneapolis, MN 55440-1524, USA.
Correspondence to: Dr Ajay S Behl,
HealthPartners Research Foundation, 8170 33rd Ave. S.,
PO Box 1524, Minneapolis, MN 55440-1524, USA.
Email:
[email protected]
Received: October 8, 2011;
Initial review: October 31, 2011;
Accepted: March 30, 2012.
|
To assess India’s recent trends in child mortality rates and
disparities and identify ways to reduce child mortality and
wealth-related health disparities, we analyzed three years of data
from India’s National Family Health Survey related to child
mortality. Nationally, declines in average child mortality were
statistically significant, but declines in inequality were not.
Urban areas had lower child mortality rates than rural areas but
higher inequalities. Interstate differences in child mortality rates
were significant, with rates in the highest-mortality states four to
six times higher than in the lowest-mortality states. However, child
mortality in most states declined.
Key words: Child mortality, Disparities, Trends.
|
|
I
n 2008, roughly 1.8 million children died in
India, more than in any other country, accounting for about 21% of child
deaths worldwide [1]. In developing countries, children in poorer
families are at greater risk of disease, undernutrition, and deaths
[2,3]. Research is needed to identify inequalities in mortality rates
along the socioeconomic gradient for efficient resource allocation
[4,5]. One measure to track changes in population health along the
dimensions of goodness (averages) and fairness (equity) is the Health
Achievement Index (HAI), a summary measure that combines the
Concentration Index (CI) (a common measure of socioeconomic
inequalities), and the average level of health [6,7].
We assessed national and state trends in mean child
mortality rates, CI, and HAI in India during 1992, 1998, and 2005, and
tested for changes in mean child mortality rates and CI. Results of this
secondary analysis are presented here.
Methods
We used household survey data from three waves of
India’s National Family Health Survey (NFHS) (1992-1993, 1998-1999, and
2005-2006) [8-10] for the empirical analysis. For convenience, we
henceforth refer to these periods as 1992, 1998, and 2005.
We estimated mortality rates in children age 5 and
younger, the CI, and the HAI and computed separate estimates for rural
and urban areas using the Synthetic Cohort Life Table approach [11].
Following Rutstein and Rojas, we adopted the following age segments to
calculate the individual probabilities of dying (completed ages, in
months): 0, 1-2, 3-5, 6-11, 12-23, 24-35, 36-47, and 48-59. This
approach allows full use of recent data and is specific to the periods.
At national and state levels, we used the wealth
index to compute the CI, as described in the literature [12]. The CI can
range in value from -1 to +1, with 0 indicating no wealth-related health
inequality. Negative CI values represent ill health in that they
indicate a disproportionate burden of mortality among the poorest
sections of society; the larger the value, the greater the inequality.
The product of the mean mortality rates and the CI yields the HAI, a
weighted average of the health levels of people in the sample, in which
higher weights are attached to poorer people [13]. While the
concentration curve is not a convenient measure of inequality for
comparison, the CI, which is based on the concentration curve,
quantifies the degree of socioeconomic inequality in a health variable
[6,7].
We computed t-statistics to test for statistically
significant differences in the mean mortality rates and inequalities
(CI) between 1992 and 1998 and 1998 and 2005 at national and state
levels. For the three states formed in 2000 (Uttarkhand, Jharkhand, and
Chhattisgarh), we used estimates from the respective "parent" states
(Uttar Pradesh, Bihar, and Madhya Pradesh) for the earlier years.
Results
Overall, with the exception of a few small states,
mean child mortality rates declined at national and state levels between
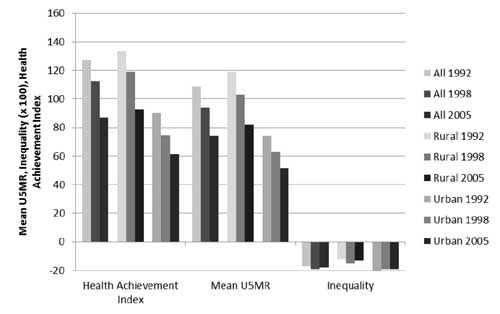
1992 and 1998 and 1998 and 2005 (Table I, Fig. 1).
Nationally, mean child mortality rates declined significantly between
1992 and 1998 and 1998 and 2005. Mean child mortality for the 10 states
that together account for roughly 60% of the annual birth cohort, also
declined. However, changes in inequality were not uniform. Nationally,
inequalities increased slightly between 1992 and 1998 and declined
slightly between 1998 and 2005, with similar trends in rural India;
there was a statistically significant decline in mean mortality for both
urban and rural India and a corresponding decline in HAI between 1992
and 1998 and 1998 and 2005. Urban areas had lower child mortality rates
than rural areas, but inequalities (CIs) were higher in urban areas in
all three years.
 |
|
U5MR, mean mortality rates in children
aged 5 years or younger
|
|
Fig 1. Mean mortality rates in
children aged
£5
years, inequality, and health achievement indices in India,
nationwide and in rural states and urban populations, 1992,
1998, and 2005.
|
Results were mixed for the states with the largest
birth cohorts (Web Fig.1). Although HAI decreased
uniformly, few had statistically significant changes in inequality.
Among all states, mean child mortality, inequalities, and HAI varied
significantly (Table I). In 1992, eight states had mean
child mortality rates and HAI higher than the national average of
108.75/1,000 live births and 127.28/1,000 live births, respectively,
while 19 states had inequalities worse than the national average of
-0.170.
TABLE I	State-level Trends in Mean Mortality Rates of Children Aged 5 Years or Younger, Health Achievement,

and Inequality in India, 1992, 1998, and 2005.
|
Year |
1992 |
1998 |
2005 |
|
Mean
|
Mean |
Mean
|
|
State |
CI |
U5MR |
HAI |
CI |
U5MR |
HAI |
CI |
U5MR |
HAI |
|
Andhra Pradesh |
-0.09 |
91 |
99.01 |
-0.15 |
85 |
98.32 |
-0.09 |
63 |
68.59 |
|
Arunachal Pradesh |
-0.39 |
72 |
99.42 |
-0.22 |
97 |
117.97 |
-0.12 |
87 |
97.43 |
|
Assam |
-0.1 |
141 |
156.01 |
-0.12 |
89 |
99.77 |
-0.1 |
85 |
93.09 |
|
Bihar |
-0.1 |
127 |
139.43 |
-0.16 |
105 |
121.07 |
-0.1 |
85 |
93.1 |
|
Chhattisgarh |
-0.13 |
130 |
146.08 |
-0.17 |
137 |
159.17 |
-0.12 |
90 |
100.95 |
|
Delhi |
-0.22 |
82 |
100.1 |
-0.24 |
55 |
68.58 |
-0.17 |
47 |
54.67 |
|
Goa |
-0.2 |
39 |
46.57 |
-0.05 |
46 |
48.33 |
-0.19 |
20 |
24.11 |
|
Gujarat |
-0.19 |
103 |
122.88 |
-0.2 |
84 |
101.11 |
-0.25 |
61 |
75.76 |
|
Haryana |
-0.14 |
98 |
111.51 |
-0.21 |
76 |
92.64 |
-0.13 |
52 |
59.39 |
|
Himachal Pradesh |
-0.05 |
69 |
72.77 |
-0.09 |
43 |
46.55 |
-0.2 |
42 |
50.29 |
|
Jammu and Kashmir |
-0.1 |
59 |
64.82 |
-0.13 |
80 |
90.3 |
-0.15 |
51 |
58.73 |
|
Jharkhand |
-0.1 |
127 |
139.43 |
-0.16 |
105 |
121.07 |
-0.11 |
93 |
103.12 |
|
Karnataka |
-0.15 |
87 |
100.3 |
-0.17 |
70 |
81.27 |
-0.17 |
54 |
63.44 |
|
Kerala |
-0.22 |
32 |
39.22 |
-0.05 |
19 |
19.95 |
-0.17 |
16 |
19.04 |
|
Madhya Pradesh |
-0.13 |
130 |
146.08 |
-0.17 |
137 |
159.17 |
-0.17 |
94 |
109.38 |
|
Maharashtra |
-0.2 |
70 |
84.36 |
-0.14 |
58 |
66.33 |
-0.26 |
46 |
58.39 |
|
Manipur |
-0.2 |
62 |
74.26 |
-0.2 |
56 |
67.03 |
-0.29 |
41 |
53.51 |
|
Meghalaya |
-0.02 |
87 |
88.67 |
-0.14 |
121 |
138.49 |
-0.18 |
70 |
82.96 |
|
Mizoram |
-0.08 |
29 |
31.04 |
-0.14 |
55 |
62.41 |
-0.16 |
52 |
60.88 |
|
Nagaland |
0.12 |
21 |
18.13 |
-0.07 |
64 |
68.77 |
-0.19 |
64 |
76.36 |
|
Orissa |
-0.07 |
130 |
140.08 |
-0.16 |
104 |
120.4 |
-0.15 |
90 |
103.65 |
|
Punjab |
-0.12 |
68 |
76.21 |
-0.22 |
71 |
87.23 |
-0.16 |
52 |
60.6 |
|
Rajasthan |
-0.08 |
102 |
110.6 |
-0.17 |
114 |
133.42 |
-0.12 |
85 |
95.35 |
|
Sikkim |
– |
– |
– |
-0.14 |
71.1 |
81.6 |
-0.07 |
40 |
42.57 |
|
Tamil Nadu |
-0.31 |
87 |
113.4 |
-0.17 |
63 |
73.62 |
-0.24 |
36 |
44.01 |
|
Tripura |
-0.19 |
104 |
123.4 |
-0.1 |
51 |
56.65 |
-0.25 |
59 |
74.08 |
|
Uttar Pradesh |
-0.14 |
141 |
160.26 |
-0.17 |
122 |
141.92 |
-0.1 |
96 |
105.9 |
|
Uttarkhand |
-0.14 |
141 |
160.26 |
-0.17 |
122 |
141.92 |
-0.37 |
57 |
77.91 |
|
West Bengal |
-0.12 |
99 |
111.03 |
-0.15 |
68 |
78.07 |
-0.08 |
59 |
64.14 |
|
CI, inequality; HAI, health
achievement; U5MR, mean mortality rates in children aged 5 years
or younger. |
Child mortality varied significantly among the
states, with the lowest rates in states like Kerala (32/1,000 live
births) and the highest in states like Uttar Pradesh (141/1,000 live
births). In 1998, 10 states had mean mortality rates and HAIs higher
than the national average of 94.25/1,000 live births and 112.31/1,000
live births, respectively, while 23 states had inequalities worse than
the national average of 0.192. In 1998, child mortality rates declined
in both Kerala (19/1,000 live births) and Uttar Pradesh (122/1,000 live
births). In 2005, nine states had mean child mortality rates and HAIs
higher than the national average of 74.1/1,000 live births and
87.22/1,000 live births, respectively, while 19 states had inequalities
worse than the national average of -0.178. Child mortality rates in
Kerala declined further in 2005 to 16/1,000 live births, while those of
Uttar Pradesh declined to 96/1,000 live births.
Bihar, Madhya Pradesh, Rajasthan, Uttar Pradesh, and
the recent additions Chhattisgarh, Jharkhand, and ttarkhand.
Chhattisgarh, Madhya Pradesh, and Rajasthan fared marginally worse on
all dimensions of health achievement between 1992 and 1998 (Table
I), but the differences were not statistically significant
except for the change in inequality for Rajasthan. Between 1998 and
2005, all the BIMARU states except Bihar had statistically significant
declines in child mortality; both Bihar and Uttar Pradesh had
statistically significant declines in inequality. The exception was
Uttarkhand, where inequality increased between 1998 and 2005. Between
1992 and 1998, five states had statistically significant increases in
child mortality; 12 states showed a statistically significant decline in
child mortality. Four states had worse inequalities in 1998 than in
1992, while three improved in this measure. All states had lower child
mortality in 2005 than in 1998, with statistically significant declines
in 17 states. However, six states had statistically significant higher
inequalities in 2005, while four had lower inequalities.
DDiscussion
India’s national child mortality rates mask the vast
underlying differences in child health achievement in urban and rural
areas among the states and along the socioeconomic gradient. In 2006,
India had a birth cohort of more than 27 million. By aggregating data
over such large cohorts, with significant socioeconomic, geographic, and
political differences between states, we lose important information
[14]. Detailed information regarding the performance of the individual
states is important to enable policy prescriptions subnationally.
Although child health achievement improved nationally
between the periods we compared, the mean child mortality rate and CI
presented stark contrasts. While mean child mortality rates have
declined significantly, inequalities have not declined commensurately.
However, nationally, declines in child mortality were not necessarily
accompanied by worsening inequality. Although mean child mortality rates
declined in both rural and urban India, significant rural-urban
differences persisted, with 50% to 60% higher rates in rural areas. Lack
of potable water and sanitation infrastructure is a major cause of
infant and child mortality in rural areas [3,14].i>
IIn India, health care is the responsibility of state
governments [15]. Although mortality rates declined across all states
during 1992 to 2005, a slight increase in some states in 1998 was
associated with the drop in public health care expenditure (PHCE). In
1990, India’s PHCE was 1.3% of gross domestic product (GDP) but had
declined to 0.9% by 1999 [16]. Among the states, Bihar and Uttar Pradesh
had the lowest PHCE. However, the more troubling trend is the widening
of the gap in child mortality across states. Increasing the gross state
domestic product (GSDP) (and the corresponding PHCE) of the states
lagging in child health achievement is not easy; according to Ahluwalia,
[17] Bihar, Uttar Pradesh, and Orissa had poor GSDP growth in the 1990s.
Bhat and Jain, [15] have shown that all state governments have set
targets for PHCE expenditures as a fraction of their GSDP, but they are
inadequate to achieve the United Nations Millennium Development Goals.
Nationally, we found no evidence of significant
improvements in wealth-related inequalities in child mortality rates. At
the state level, inequalities increased in more places than they
decreased during 1992 to 1998 and 1998 to 2005. In addition, the poorest
performing states failed to reduce wealth-related inequalities in child
mortality, an important finding that suggests that improvements in
economic opportunities do not necessarily lead to improvements in health
care infrastructure [18]. The increasing inequality in 1992 to 1998
corresponds to the general contraction of public expenditures between
1992 and 1996 [15]. /p>
AAlthough previous studies indicate that economic
growth is associated with declines in average child mortality rates
nationwide, [19-21] this association may not hold subnationally.
Specifically, Maharashtra and Gujarat were ranked just below Punjab and
Haryana in income in the early 1990s, but post 1991, their income
accelerated at the fastest pace; [22] both states demonstrated
consistent declines in mean child mortality, but inequality increased in
Maharashtra in these rates during 1998 to 2005. The premise that
economic growth increases inequality of health outcomes subnationally is
reinforced with data from Tamil Nadu; the declines in child mortality in
this state were accompanied by an increase in inequalities. Tamil Nadu
had one of the highest income growth rates in the 1990s.
In light of our findings, the government launch of
the National Rural Health Mission (NRHM) and the National Urban Health
Mission (NUHM) in 2005 is particularly timely. The NRHM was launched
[22] to improve rural health by targeting phased increases in funding
for the health sector of 2% or 3% of the GDP. The immediate expected
outcome is reduced child mortality. India also developed NUHM to provide
accessible and affordable health care to nearly 220 million of India’s
urban poor in 429 cities. Our findings suggest that the NRHM and NUHM
could identify the districts with the highest number of child deaths in
the high-mortality states and target them with low-cost interventions
like vaccinations, oral rehydration salts, and vitamin A
supplementation. /p>
DDespite reductions in national child mortality in
India in 1992 to 2005, significant rural-urban, interstate, and
intrastate disparities remain. In addition, although we found no
conclusive evidence of a tradeoff between "goodness" and "fairness," the
results indicate that, on average, declines in child mortality rates do
not automatically reduce wealth-related inequalities in these rates.
Funding: None; Competing interests: None
stated.
|
What is Already Known?
• Crude measures of disparities in child
mortality at the state level are known.
What This Study Adds?
• Child mortality declined in most states but
interstate differences in child mortality were significant, with
rates in the highest-mortality states four to six times higher
than in lowest-mortality states.
|
References/p>
11. Black RE, Cousens S, Johnson HL, Lawn JE, Rudan I,
Bassani DG, Jha P, Campbell H, Walker CF, Cibulskis R, Eisele T, Liu L,
Mathers C. Global, regional, and national causes of child mortality in
2008: a systematic analysis. The Lancet. [doi: DOI:
10.1016/S0140-6736(10)60549-1]. 2010;375:1969-87.
2. Wagstaff A, Bustreo F, Bryce J, Claeson M. Child
health: reaching the poor. Am J Public Health. 2004;94:726-36.
3. Victora CG, Wagstaff A, Schellenberg JA, Gwatkin
D, Claeson M, Habicht JP. Applying an equity lens to child health and
mortality: more of the same is not enough. Lancet. 2003;362:233-41.
4. Marmot M. Social determinants of health
inequalities. Lancet. 2005;365:1099-104./p>
55. O’Donnell O, Doorslaer Ev, Wagstaff A, Lindelow M.
Analyzing Health Equity Using Household Survey Data: A Guide To
Techniques And Their Implementation. Washington, D.C.: World Bank; 2008.
6. Kakwani N, Wagstaff A, van Doorslaer E.
Socioeconomic inequalities in health: Measurement, computation, and
statistical inference. Journal of Econometrics. [doi:
10.1016/S0304-4076(96)01807-6]. 1997;77:87-103.
7. Wagstaff A, Paci P, van Doorslaer E. On the
measurement of inequalities in health. Social Science & Medicine. [doi:
DOI: 10.1016/0277-9536(91)90212-U]. 1991;33:545-57.
8. International Institute for Population Sciences
(IIPS), Macro International. National Family Health Survey (NHFS-1),
1992-93: India. 1994; Mumbai, India: IIPS.
9. International Institute for Population Sciences
(IIPS), Macro International. National Family Health Survey (NHFS-2),
1998-99: India. 2000; Mumbai, India: IIPS.
10. International Institute for Population Sciences
(IIPS), Macro International. (2007). National Family Health Survey
(NHFS-3), 2005-06: India. 2007; Mumbai, India: IIPS.
11. Rutstein S, Rojas G. Online Guide to DHS
Statistics. 2006; Available from:
http://www.measuredhs.com/help/Datasets/whnjs.htm.
12. Kakwani N. Measurement of tax progressivity: An
international comparison. Economic Journal1977;87:71-80./p>
13. Wagstaff A. Inequality aversion, health
inequalities and health achievement. J Health Econ2002 Jul;21(4):627-41.
14. Dholakia R, Kumar A, Datta S. Millennium
Development Goals needs assessment at state level in India: A study of
Madhya Pradesh, Rajasthan and Uttar Pradesh. Background paper for the UN
Millenium Project Task force on Project & Economic Development2004.
15. Bhat R, Jain N. Analysis of public expenditure on
health using state level data. Ahmedabad: Indian Institute of
Management2004 Contract No.: WP2004-06-08.
16. National Rural Health Mission. Government of
India; [cited 2009 January 2]; Available from:
http://mohfw.nic.in/NRHM.htm.
17. Ahluwalia M. Economic reforms in India since
1991: Has gradualism worked? Journal of Economic
Perspectives2002;16(2):67-88.
18. Parker B, Kozel B, Kukerja M. In search of a
chance: Urban opportunities, poverty and vulnerability in northern
India. Urban Research symposium: Urban Development for Economic Growth
and Poverty Reduction; December 15-17, 2003; Washington, D.C.: The World
Bank; 2003.
19. Alderman H, Appleton S, Haddad L, Song L,
Yohannes Y. Reducing child malnutrition: how far does income growth take
us? Washington DC: World Bank2000.
20. Preston SH. The changing relation between
mortality and level of economic development. Popul Stud (Camb)1975
Jul;29:231-48.
21. Pritchett L, Summers L. Wealthier is healthier.
Journal of Human Resources1996;31:841-68.
22. Ahluwalia MS. State-level performance under
economic reforms in India. Conference on Indian Economic Prospects:
Advancing Policy Reform; Stanford University, Palo Alto, CA: Center for
research on Economic Development and Policy Reform; 2000.
|
|
|
 |
|
